South African Journal of Clinical Nutrition is co-published by NISC (Pty) Ltd, Medpharm Publications, and Informa UK Limited (trading as the Taylor & Francis Group)
SAJCN
ISSN 1607-0658 EISSN 2221-1268 © 2018 The Author(s)
RESEARCH
South African Journal of Clinical Nutrition 2018; 31(1):20–28https://doi.org/10.1080/16070658.2017.1342950
Open Access article distributed under the terms of the Creative Commons License [CC BY-NC 3.0]
http://creativecommons.org/licenses/by-nc/3.0
Consumption patterns and demographic factors influence on fruit juice
classifications, health benefits and sugar content perceptions in two Municipal
Districts in Cape Town, Western Cape, South Africa
Rodney Graeme Duffetta*
aMarketing Department, Cape Peninsula University of Technology, Cape Town, South Africa *Email: [email protected]
Objectives: The study ascertained consumer perceptions of differences between fruit juice classifications regarding their respective health benefits and sugar content. The research also considered the influence of consumption patterns and demographic factors.
Design: A cross-sectional quantitative study design was used via a structured self-administered questionnaire.
Setting: Fruit juice consumers (aged 16 – 66+; male and females; adolescent and adults; Black, Coloured, White, Indian and Asian) who resided in the Western Cape in the City of Cape Town and Cape Winelands municipal districts.
Subjects: A sample of 7 640 fruit juice consumers.
Outcome measures: Fruit juice consumer consumption patterns, fruit juice classifications perceptions and demographic factors were evaluated by means of a generalised linear model (GLM).
Results: The majority of respondents agreed that there was a difference between fruit juice classifications. Respondents who consumed fruit juice with higher regularity; drank more fruit juice; bottled and tap water; wanted a decrease in prices and increase in information on fruit juice nutrition/health benefits had favourable perceptions. Black or Coloured respondents and those who were single; female consumers; had higher education levels; and, had a household income volunteered the most favourable perceptions.
Conclusions: Based on the results, it can be concluded that consumers are erudite about the differences, health benefits and sugar content of fruit juice classifications. A number of consumption patterns and demographic factors also had an influence on consumer perceptions; hence, increased information should be disseminated to encourage South African consumers to pursue healthy balanced diets.
Keywords: consumer perceptions, fruit juice, fruit juice classifications, health benefits, sugar content
Introduction
A proliferation of recent public accessible literature (internet and newspapers), largely emanating from journal articles, has emphasised the possible negative health risks of consuming fruit juice. The literature has caused some confusion among consumers as a result of conflicting messages received from the marketing efforts of fruit juice suppliers, schooling, government health organisations and other public sources.1,6,8 Fruit juice is
frequently marketed as a health product and as consumers’ awareness of the potential health benefits increases, so does the demand. Pure (100%) fruit juice is on the top end of the price/ quality range, demands a premium price, and is typically purchased by high income consumers. However, sugar-sweetened beverages, such as fruit nectars (12.5% - 50% depending on the type of fruit), squashes (24% juice undiluted and 6% diluted) and fruit drinks (6%), contain diminishing levels of fruit juice and higher quantities of added sugar and, hence, are of lesser health benefit. These fruit juice products are inexpensively priced and are typically purchased by
lower-income consumers.2,3 In recent years, made-from-concentrate
fruit juices (consists of 50% blended juice of the named fruit with apple, pear and/or grape juice comprising the balance of the blend) have seen a decline owing to consumers desiring healthier fruit juice options.4
The health effects of artificially and sugar sweetened beverages and 100% fruit juice has received widespread attention from both scientific and public forums.5–16 Hyson asserts that fruit juice
has certain health benefits and disease prevention attributes after a review and critical analysis of 100% fruit juice-related scientific literature, but that there were many unanswered questions and a need for more research.11 The potential health
risks of fructose (natural sugar) and sugar sweetened classifications of fruit juice have been debated in the popular press, but the discourse typically concentrates on the sugar
content and disregards the health benefits.8,17 Fruit juice
manufacturers have indiscriminately positioned fruit juice as a healthy beverage to both children and adults.18 However, fruit
juice lacks fibre and a single cup almost contains the daily recommended amount of sugar for adults and exceeds the recommendations for children. Seltzer and Steidle indicate that the high sugar content of fruit juice overshadows the potential
health benefits.18 Consequently, government proposed that a
sugar tax will be levied on sugar sweetened beverages in South Africa to help reduce the risk of obesity, Type 2 diabetes and strokes that are associated with high usage intake. Initially, only certain fruit juice classifications, such as nectars, drinks, squashes and cordials, would incur the sugar tax of 20% in 2017, and that 100% fruit juice will also be subject to the tax.19
O’Neil et al. report that consumers may be confused about the
nutritional and health benefits of fruit juice owing to the lack of agreement among health professionals and researchers based on their analysis of the scientific evidence and the insufficiency thereof.6 Petzer and Meyer disclose that there are still large
The page number in the footer is not for bibliographic referencing www.tandfonline.com/ojcn 7
South African Journal of Clinical Nutrition is co-published by NISC (Pty) Ltd, Medpharm Publications, and Informa UK Limited (trading as the
RESEARCH
Creative Commons License [CC BY-NC 3.0]http://creativecommons.org/licenses/by-nc/3.0
Consumption patterns and demographic factors influence on fruit juice
classifications, health benefits and sugar content perceptions in two Municipal
Districts in Cape Town, Western Cape, South Africa
Rodney Graeme Duffetta*
aMarketing Department, Cape Peninsula University of Technology, Cape Town, South Africa *Email: [email protected]
Objectives: The study ascertained consumer perceptions of differences between fruit juice classifications regarding their respective health benefits and sugar content. The research also considered the influence of consumption patterns and demographic factors.
Design: A cross-sectional quantitative study design was used via a structured self-administered questionnaire.
Setting: Fruit juice consumers (aged 16 – 66+; male and females; adolescent and adults; Black, Coloured, White, Indian and Asian) who resided in the Western Cape in the City of Cape Town and Cape Winelands municipal districts.
Subjects: A sample of 7 640 fruit juice consumers.
Outcome measures: Fruit juice consumer consumption patterns, fruit juice classifications perceptions and demographic factors were evaluated by means of a generalised linear model (GLM).
Results: The majority of respondents agreed that there was a difference between fruit juice classifications. Respondents who consumed fruit juice with higher regularity; drank more fruit juice; bottled and tap water; wanted a decrease in prices and increase in information on fruit juice nutrition/health benefits had favourable perceptions. Black or Coloured respondents and those who were single; female consumers; had higher education levels; and, had a household income volunteered the most favourable perceptions.
Conclusions: Based on the results, it can be concluded that consumers are erudite about the differences, health benefits and sugar content of fruit juice classifications. A number of consumption patterns and demographic factors also had an influence on consumer perceptions; hence, increased information should be disseminated to encourage South African consumers to pursue healthy balanced diets.
Keywords: consumer perceptions, fruit juice, fruit juice classifications, health benefits, sugar content
Introduction
A proliferation of recent public accessible literature (internet and newspapers), largely emanating from journal articles, has emphasised the possible negative health risks of consuming fruit juice. The literature has caused some confusion among consumers as a result of conflicting messages received from the marketing efforts of fruit juice suppliers, schooling, government health organisations and other public sources.1,6,8 Fruit juice is
frequently marketed as a health product and as consumers’ awareness of the potential health benefits increases, so does the demand. Pure (100%) fruit juice is on the top end of the price/ quality range, demands a premium price, and is typically purchased by high income consumers. However, sugar-sweetened beverages, such as fruit nectars (12.5% - 50% depending on the type of fruit), squashes (24% juice undiluted and 6% diluted) and fruit drinks (6%), contain diminishing levels of fruit juice and higher quantities of added sugar and, hence, are of lesser health benefit. These fruit juice products are inexpensively priced and are typically purchased by
lower-income consumers.2,3 In recent years, made-from-concentrate
fruit juices (consists of 50% blended juice of the named fruit with apple, pear and/or grape juice comprising the balance of the blend) have seen a decline owing to consumers desiring healthier fruit juice options.4
The health effects of artificially and sugar sweetened beverages and 100% fruit juice has received widespread attention from both scientific and public forums.5–16 Hyson asserts that fruit juice
has certain health benefits and disease prevention attributes after a review and critical analysis of 100% fruit juice-related scientific literature, but that there were many unanswered questions and a need for more research.11 The potential health
risks of fructose (natural sugar) and sugar sweetened classifications of fruit juice have been debated in the popular press, but the discourse typically concentrates on the sugar
content and disregards the health benefits.8,17 Fruit juice
manufacturers have indiscriminately positioned fruit juice as a healthy beverage to both children and adults.18 However, fruit
juice lacks fibre and a single cup almost contains the daily recommended amount of sugar for adults and exceeds the recommendations for children. Seltzer and Steidle indicate that the high sugar content of fruit juice overshadows the potential
health benefits.18 Consequently, government proposed that a
sugar tax will be levied on sugar sweetened beverages in South Africa to help reduce the risk of obesity, Type 2 diabetes and strokes that are associated with high usage intake. Initially, only certain fruit juice classifications, such as nectars, drinks, squashes and cordials, would incur the sugar tax of 20% in 2017, and that 100% fruit juice will also be subject to the tax.19
O’Neil et al. report that consumers may be confused about the
nutritional and health benefits of fruit juice owing to the lack of agreement among health professionals and researchers based on their analysis of the scientific evidence and the insufficiency thereof.6 Petzer and Meyer disclose that there are still large
differences in education and income levels, as well as information
access in South Africa (SA), with nearly 25% of the population living in relative poverty.21 These large disparities in general
well-being are indicative that not all consumers have access to recent health-related information nor are they able to discern its reliability owing to their poor socio-economic status. Therefore, the primary research objective of this study attempted to empirically ascertain consumer perceptions towards the collective fruit juice classifications (the consumption rate of the different fruit juice classifications was not considered on an individual basis, but rather the cumulative consumption of pure fruit juice, fruit nectars, squashes and fruit drinks) and their respective health benefits and sugar content in a developing country (South Africa). The second research objective sought to determine if various consumption patterns have an influence on consumer perceptions of fruit juice classifications. The third research objective aimed to establish if various demographic factors had an impact on consumer perceptions of fruit juice classifications.
Methods
Study design
A descriptive cross-sectional quantitative study design was used.
Subjects and setting
A convenience sample included fruit juice consumers (aged 16 – 66+; male and females; adolescent and adults; and Black, Coloured, White, Indian and Asian) who resided in the Western Cape (predominantly in the City of Cape Town and Cape Winelands municipal districts), which constitutes over 11% of SA’s population. The convenience sampling technique was adopted whereby different geographic clusters were first
identified using census data,22 which included suburban lower
(townships); middle; and upper (suburbs) class areas in rural and urban areas in order to obtain a diverse spread of demographic and socio-economic profiles prevalent in the Western Cape, South Africa. Thereafter, a range of community groups (religious, sports, education, youth and other local community groups) were selected via regional telephone directory listings and contacted telephonically to obtain permission for their members to participate in the study. The sample was relatively similar to the census data regarding certain demographic factors, namely
age, population group and gender.22
The fieldworkers used in the survey were marketing students who received theoretical and practical training via several subjects, namely quantitative techniques, marketing research and marketing communication. They then employed systematic sampling to survey respondents at the community organisations, with every second respondent being invited to voluntarily participate in the study. The researcher’s research assistants supervised the fieldworkers on the collection sites and thoroughly inspected the questionnaires to ensure that they were complete and correct (in other words, to ensure that two items were not completed for one question).
The investigation conformed to the ethical requirements of Cape Peninsula University of Technology’s Faculty of Business and Management Research Ethics Committee. Informed written consent was secured from all respondents prior to their participation in the survey. Participation was on a voluntary basis, and the anonymity and confidentiality of all respondents was upheld in the study since the survey was conducted on an anonymous basis.
Questionnaire and data collection
Structured self-administered research instruments were utilised, which allowed the respondents (every second fruit juice consumer in a household, community group or organisation was invited to participate in the study) to complete the questionnaires on their own without any assistance, thereby eliminating interviewer bias. The questionnaire was one page in length, and only consisted of close-ended questions in the form of multiple-choice and Likert scale statements. The research instrument consisted of three sections and was adapted from South African Fruit Juice Association (SAFJA);3 Nicklas et al.;5 Clemens et al.;10
and Landon and Baghurst.23 A principle component factor
analysis was implemented to confirm the validity of the fruit juice classification scale. The first principle components of the fruit juice classification scale accounted for 62.549% of the
Table 1: Principle component factor analysis of fruit juice classifications
Initial Eigenvalues Extraction Sums of Squared Loadings
Fruit juice classifications Total % of Variance Cumulative % Total % of Variance Cumulative %
There is a difference between fresh fruit juice, unsweetened pure (100%) fruit juice, fruit nectar, fruit drinks and squash, and fruit flavoured drinks fruit juice classifications
1.876 62.549 62.549 1.876 62.549 62.549
Not all fruit juice
classifica-tions are equally healthy. 0.600 19.999 82.548
Some of the fruit juice clas-sifications are sweetened with sugar
0.524 17.452 100.000
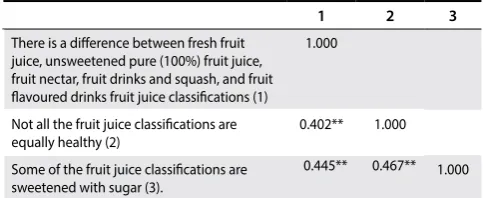
Table 2: Pearson’s correlation coefficient of fruit juice classifications
**Correlation is significant at the p < 0.01 level (2-tailed).
1 2 3
There is a difference between fresh fruit juice, unsweetened pure (100%) fruit juice, fruit nectar, fruit drinks and squash, and fruit flavoured drinks fruit juice classifications (1)
1.000
Not all the fruit juice classifications are
equally healthy (2) 0.402** 1.000
Some of the fruit juice classifications are sweetened with sugar (3).
The page number in the footer is not for bibliographic referencing www.tandfonline.com/ojcn 8
South African Journal of Clinical Nutrition 2018;1(1)
22 South African Journal of Clinical Nutrition 2018; 31(1):20–28
variance in the data, which revealed that there was little divergence in the scale items, and was suggestive of discriminant validity (Table 1).
The fruit juice classification scale items displayed a medium positive correlation, with the coefficients ranging from 0.402 - 0.445, which show that the measured variables displayed a general convergence of responses, which is indicative of
convergent validity (Table 2). Furthermore, the fruit juice
classification scale overall Cronbach’s Alpha co-efficient score was 0.700, which represented an acceptable reliability level.
The first section of the questionnaire gathered information relating to fruit juice consumer consumption patterns by means of six multiple-choice questions. The second section consisted of a three-item scale to determine consumer perceptions regarding the fruit juice classifications in terms of differences, health benefits and sugar content via five-point symmetric Likert scale statements that ranged from “strongly disagree” (1) to “strongly agree” (5). The questionnaire clarified that the different fruit juice classifications contained varying percentages of fruit juice, unsweetened pure (100%) fruit juice, fruit nectar (12.5% - 50% depending on the type of fruit), fruit drinks and squash (24% juice undiluted and 6% diluted), and fruit flavoured drinks (6%).3
The third section of the questionnaire gathered data pertaining to respondents’ demographic factors by means of seven multiple-choice questions.
A total of 7 640 questionnaires were completed over a three-month period (March to May 2016), which were used for the data analysis of this study.
Data analysis
The questionnaires were numbered, coded, captured and analysed by means of the statistical program known as SPSS (version 23) by the researcher. Firstly, basic descriptive statistical techniques were applied to establish frequencies, means, standard deviations and other statistical test values, in order to provide a tabular overview of the consumption patterns, fruit juice classification scale and demographic factors. Secondly, a generalised linear model (GLM) was used to examine the relationship between the independent variables (consumption patterns and demographic factors) and dependent variable (fruit juice classification scale). The GLM was also used to establish if there was an overall significant difference regarding the fruit juice classification scale. Analysis of variance (ANOVA) was employed to compare the different means via Wald’s Chi-square statistic distribution, and was applied as the GLM to establish if there were statistically significant outcomes between the consumption patterns, and demographic factors (gender, age, marital status, education level, employment status, population group, monthly household income) versus the dependent variables (i.e. the three scales/measures). The Bonferroni pairwise
comparison post-hoc test was implemented to locate the
differences between the above-mentioned variables. Reliability is concerned with consistency of results; in other words, the research instrument scale or construct should constantly yield analogous results.
Results
A total 10 000 consumers were approached to participate in the study and, ultimately, 7 640 fruit juice consumers were surveyed in the Western Cape, South Africa (a response rate of 76.4%).
Table 3 provides a complete overview of these consumers’
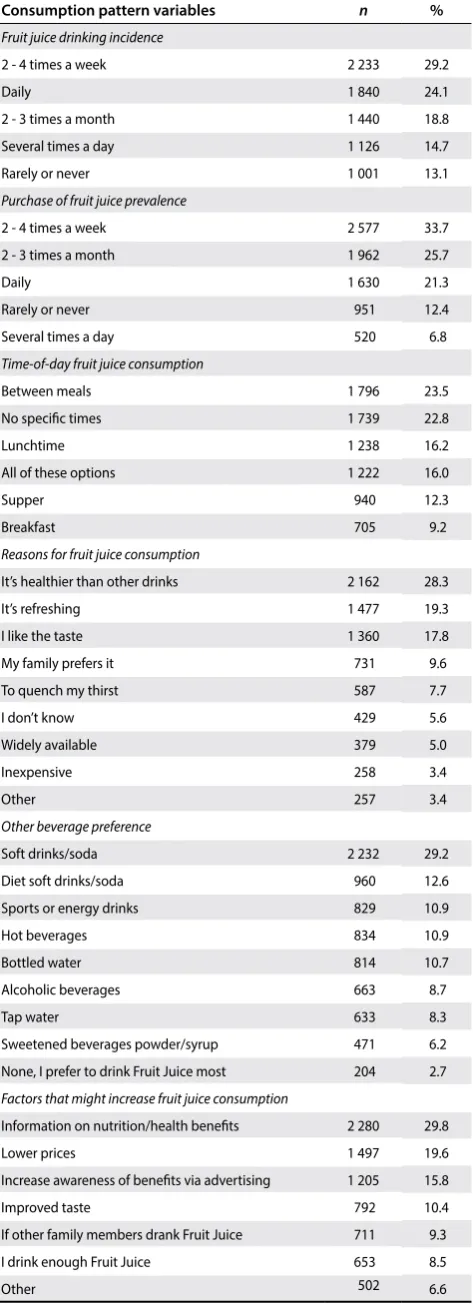
consumption patterns and demographic factors (gender, age, marital status, education level, employment status, population group, monthly household income). The consumption pattern variables (Table 3) of the different fruit juice classifications were not considered on an individual basis, but rather the cumulative
Table 3: Fruit juice consumers’ consumption patterns (n = 7 640).
Consumption pattern variables n %
Fruit juice drinking incidence
2 - 4 times a week 2 233 29.2
Daily 1 840 24.1
2 - 3 times a month 1 440 18.8
Several times a day 1 126 14.7
Rarely or never 1 001 13.1
Purchase of fruit juice prevalence
2 - 4 times a week 2 577 33.7
2 - 3 times a month 1 962 25.7
Daily 1 630 21.3
Rarely or never 951 12.4
Several times a day 520 6.8
Time-of-day fruit juice consumption
Between meals 1 796 23.5
No specific times 1 739 22.8
Lunchtime 1 238 16.2
All of these options 1 222 16.0
Supper 940 12.3
Breakfast 705 9.2
Reasons for fruit juice consumption
It’s healthier than other drinks 2 162 28.3
It’s refreshing 1 477 19.3
I like the taste 1 360 17.8
My family prefers it 731 9.6
To quench my thirst 587 7.7
I don’t know 429 5.6
Widely available 379 5.0
Inexpensive 258 3.4
Other 257 3.4
Other beverage preference
Soft drinks/soda 2 232 29.2
Diet soft drinks/soda 960 12.6
Sports or energy drinks 829 10.9
Hot beverages 834 10.9
Bottled water 814 10.7
Alcoholic beverages 663 8.7
Tap water 633 8.3
Sweetened beverages powder/syrup 471 6.2
None, I prefer to drink Fruit Juice most 204 2.7
Factors that might increase fruit juice consumption
Information on nutrition/health benefits 2 280 29.8
Lower prices 1 497 19.6
Increase awareness of benefits via advertising 1 205 15.8
Improved taste 792 10.4
If other family members drank Fruit Juice 711 9.3
I drink enough Fruit Juice 653 8.5
variance in the data, which revealed that there was little divergence in the scale items, and was suggestive of discriminant validity (Table 1).
The fruit juice classification scale items displayed a medium positive correlation, with the coefficients ranging from 0.402 - 0.445, which show that the measured variables displayed a general convergence of responses, which is indicative of
convergent validity (Table 2). Furthermore, the fruit juice
classification scale overall Cronbach’s Alpha co-efficient score was 0.700, which represented an acceptable reliability level.
The first section of the questionnaire gathered information relating to fruit juice consumer consumption patterns by means of six multiple-choice questions. The second section consisted of a three-item scale to determine consumer perceptions regarding the fruit juice classifications in terms of differences, health benefits and sugar content via five-point symmetric Likert scale statements that ranged from “strongly disagree” (1) to “strongly agree” (5). The questionnaire clarified that the different fruit juice classifications contained varying percentages of fruit juice, unsweetened pure (100%) fruit juice, fruit nectar (12.5% - 50% depending on the type of fruit), fruit drinks and squash (24% juice undiluted and 6% diluted), and fruit flavoured drinks (6%).3
The third section of the questionnaire gathered data pertaining to respondents’ demographic factors by means of seven multiple-choice questions.
A total of 7 640 questionnaires were completed over a three-month period (March to May 2016), which were used for the data analysis of this study.
Data analysis
The questionnaires were numbered, coded, captured and analysed by means of the statistical program known as SPSS (version 23) by the researcher. Firstly, basic descriptive statistical techniques were applied to establish frequencies, means, standard deviations and other statistical test values, in order to provide a tabular overview of the consumption patterns, fruit juice classification scale and demographic factors. Secondly, a generalised linear model (GLM) was used to examine the relationship between the independent variables (consumption patterns and demographic factors) and dependent variable (fruit juice classification scale). The GLM was also used to establish if there was an overall significant difference regarding the fruit juice classification scale. Analysis of variance (ANOVA) was employed to compare the different means via Wald’s Chi-square statistic distribution, and was applied as the GLM to establish if there were statistically significant outcomes between the consumption patterns, and demographic factors (gender, age, marital status, education level, employment status, population group, monthly household income) versus the dependent variables (i.e. the three scales/measures). The Bonferroni pairwise
comparison post-hoc test was implemented to locate the
differences between the above-mentioned variables. Reliability is concerned with consistency of results; in other words, the research instrument scale or construct should constantly yield analogous results.
Results
A total 10 000 consumers were approached to participate in the study and, ultimately, 7 640 fruit juice consumers were surveyed in the Western Cape, South Africa (a response rate of 76.4%).
Table 3 provides a complete overview of these consumers’
consumption patterns and demographic factors (gender, age, marital status, education level, employment status, population group, monthly household income). The consumption pattern variables (Table 3) of the different fruit juice classifications were not considered on an individual basis, but rather the cumulative
Table 3: Fruit juice consumers’ consumption patterns (n = 7 640).
Consumption pattern variables n %
Fruit juice drinking incidence
2 - 4 times a week 2 233 29.2
Daily 1 840 24.1
2 - 3 times a month 1 440 18.8
Several times a day 1 126 14.7
Rarely or never 1 001 13.1
Purchase of fruit juice prevalence
2 - 4 times a week 2 577 33.7
2 - 3 times a month 1 962 25.7
Daily 1 630 21.3
Rarely or never 951 12.4
Several times a day 520 6.8
Time-of-day fruit juice consumption
Between meals 1 796 23.5
No specific times 1 739 22.8
Lunchtime 1 238 16.2
All of these options 1 222 16.0
Supper 940 12.3
Breakfast 705 9.2
Reasons for fruit juice consumption
It’s healthier than other drinks 2 162 28.3
It’s refreshing 1 477 19.3
I like the taste 1 360 17.8
My family prefers it 731 9.6
To quench my thirst 587 7.7
I don’t know 429 5.6
Widely available 379 5.0
Inexpensive 258 3.4
Other 257 3.4
Other beverage preference
Soft drinks/soda 2 232 29.2
Diet soft drinks/soda 960 12.6
Sports or energy drinks 829 10.9
Hot beverages 834 10.9
Bottled water 814 10.7
Alcoholic beverages 663 8.7
Tap water 633 8.3
Sweetened beverages powder/syrup 471 6.2
None, I prefer to drink Fruit Juice most 204 2.7
Factors that might increase fruit juice consumption
Information on nutrition/health benefits 2 280 29.8
Lower prices 1 497 19.6
Increase awareness of benefits via advertising 1 205 15.8
Improved taste 792 10.4
If other family members drank Fruit Juice 711 9.3
I drink enough Fruit Juice 653 8.5
Other 502 6.6
consumption of pure fruit juice, fruit nectars, squashes and fruit drinks. Respondents commonly drank fruit juice 2 – 4 times a week (29.2%) and the 2 – 4 times a week fruit juice purchase interval category was the most popular (33.7%). Respondents generally drank fruit juice between meals (23.5%) or at no specific times (22.8%). The three main reasons why respondents consumed fruit juice were: it was healthier than other drinks (28.3%); it was refreshing (19.3%); and, they liked the taste (17.8%). The leading beverage that was consumed by respondents was soft drinks/soda (sugar-sweetened, flavoured carbonated drinks) (29.2%), followed by diet soft drinks/soda (12.6%). The three factors that might increase fruit juice consumption were: information on nutrition/health benefits (29.8%); lower prices (19.6%); and, increased awareness of benefits via advertising (15.8%).
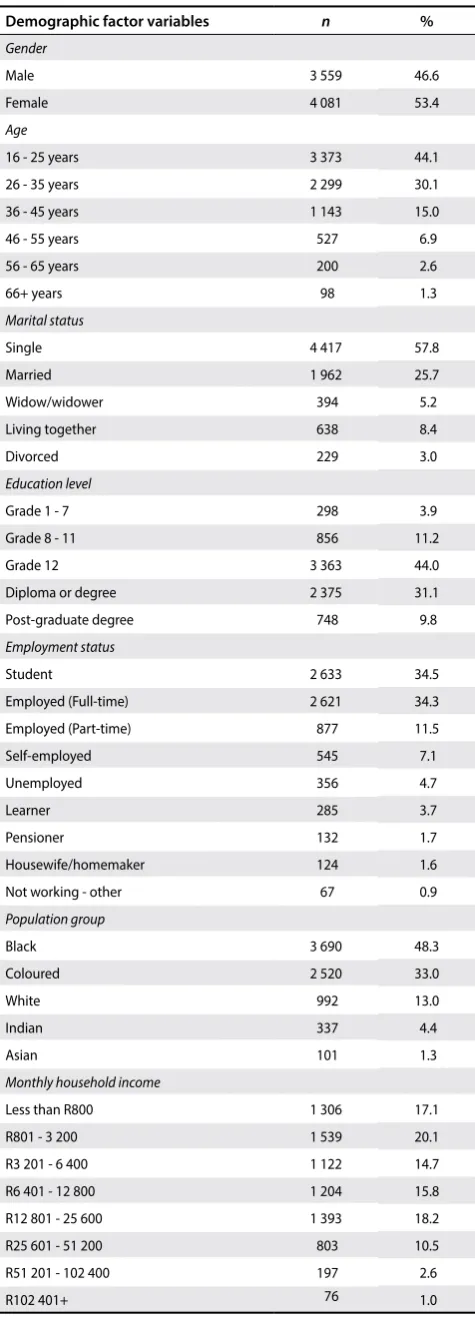
Table 4 shows that a majority of respondents were female (53.4%) and the 16 - 25 year old age category accounted for 44.1% of the sample, whereas 26 - 35 years represented 30.1% of the sample. The majority of the respondents were single (57.8%) and Grade 12 was the highest qualification for 44.0% of the sample, whereas 31.1% had attained a diploma or degree. The majority of respondents were employed (full-time) (34.3%) or students (34.5%). The respondents were mainly Black (48.3%) and Coloured (33.0%). The three lowest monthly household income categories that collectively accounted for over half of the sample, were less than R800 (17.1%), R801 – 3 200 (20.1%), and R3 201 – 6 400 (14.7%).
Overall influence of fruit juice classifications
The descriptive analysis of the fruit juice classification scale produced a mean value of 3.75 and standard deviation (SD) was 0.782. The Wald Chi-Square test distribution showed that there was significant difference (p < 0.001) for the fruit juice classification scale indicating that consumers perceived a difference between the different fruit juice classifications and their respective health benefits and sugar content.
Influence of consumption patterns on fruit juice
classifications
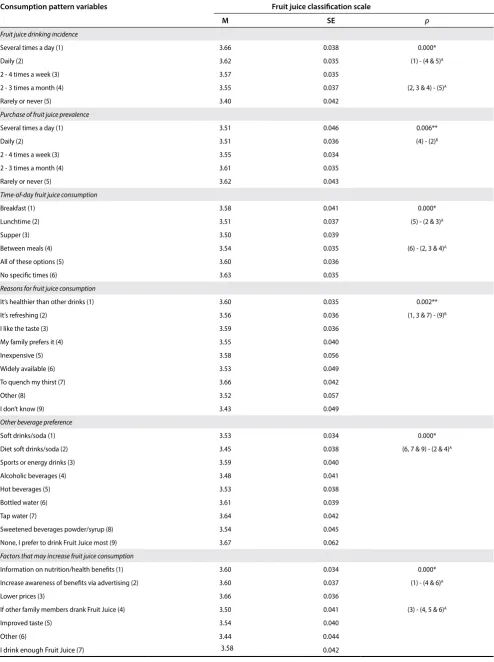
The GLM ANOVA was used to assess the influence of consumption patterns on the fruit juice classification scale (dependent variable). The Bonferroni correction pairwise post-hoc test was utilised among the estimated marginal means to locate where the significant differences were between the afore-mentioned variables. All six of the usage characteristics yielded significant differences regarding the fruit juice classification scale (Table 5)
The significant differences for the variables were as
follows (Table
5
)
Fruit juice drinking incidence (p < 0.001): respondents who drank fruit juice several times a day (mean (M) = 3.66, standard error (SE) = 0.038) displayed more favourable perceptions regarding differences between fruit juice classifications than those who consumed it 2 - 3 times a month (M = 3.55, SE = 0.037) and rarely or never consumed fruit juice (M = 3.40, SE = 0.42). Additionally, respondents who rarely or never consumed fruit juice (M = 3.40, SE = 0.42) showed less positive predispositions in terms of differences between fruit juice classifications compared to those who drank fruit juice daily (M = 3.62, SE = 0.035), 2 - 4 times a week (M = 3.57, SE = 0.035), and 2 - 3 times a month (M = 3.55, SE = 0.037).
Table 4: Fruit juice consumers’ demographic factors (n = 7 640)
Demographic factor variables n %
Gender
Male 3 559 46.6
Female 4 081 53.4
Age
16 - 25 years 3 373 44.1
26 - 35 years 2 299 30.1
36 - 45 years 1 143 15.0
46 - 55 years 527 6.9
56 - 65 years 200 2.6
66+ years 98 1.3
Marital status
Single 4 417 57.8
Married 1 962 25.7
Widow/widower 394 5.2
Living together 638 8.4
Divorced 229 3.0
Education level
Grade 1 - 7 298 3.9
Grade 8 - 11 856 11.2
Grade 12 3 363 44.0
Diploma or degree 2 375 31.1
Post-graduate degree 748 9.8
Employment status
Student 2 633 34.5
Employed (Full-time) 2 621 34.3
Employed (Part-time) 877 11.5
Self-employed 545 7.1
Unemployed 356 4.7
Learner 285 3.7
Pensioner 132 1.7
Housewife/homemaker 124 1.6
Not working - other 67 0.9
Population group
Black 3 690 48.3
Coloured 2 520 33.0
White 992 13.0
Indian 337 4.4
Asian 101 1.3
Monthly household income
Less than R800 1 306 17.1
R801 - 3 200 1 539 20.1
R3 201 - 6 400 1 122 14.7
R6 401 - 12 800 1 204 15.8
R12 801 - 25 600 1 393 18.2
R25 601 - 51 200 803 10.5
R51 201 - 102 400 197 2.6
The page number in the footer is not for bibliographic referencing www.tandfonline.com/ojcn 10
South African Journal of Clinical Nutrition 2018;1(1)
24 South African Journal of Clinical Nutrition 2018; 31(1):20–28
Table 5: Influence of consumption patterns on fruit juice classifications
*Wald’s Chi-square test showed a significant difference at p < 0.001. **Wald’s Chi-square test showed a significant difference at p < 0.05.
ABonferroni correction pairwise comparisons mean difference is significant at the 0.001 level. BBonferroni correction pairwise comparisons mean difference is significant at the 0.05 level.
Consumption pattern variables Fruit juice classification scale
M SE p
Fruit juice drinking incidence
Several times a day (1) 3.66 0.038 0.000*
Daily (2) 3.62 0.035 (1) - (4 & 5)A
2 - 4 times a week (3) 3.57 0.035
2 - 3 times a month (4) 3.55 0.037 (2, 3 & 4) - (5)A
Rarely or never (5) 3.40 0.042
Purchase of fruit juice prevalence
Several times a day (1) 3.51 0.046 0.006**
Daily (2) 3.51 0.036 (4) - (2)B
2 - 4 times a week (3) 3.55 0.034
2 - 3 times a month (4) 3.61 0.035
Rarely or never (5) 3.62 0.043
Time-of-day fruit juice consumption
Breakfast (1) 3.58 0.041 0.000*
Lunchtime (2) 3.51 0.037 (5) - (2 & 3)A
Supper (3) 3.50 0.039
Between meals (4) 3.54 0.035 (6) - (2, 3 & 4)A
All of these options (5) 3.60 0.036
No specific times (6) 3.63 0.035
Reasons for fruit juice consumption
It’s healthier than other drinks (1) 3.60 0.035 0.002**
It’s refreshing (2) 3.56 0.036 (1, 3 & 7) - (9)B
I like the taste (3) 3.59 0.036
My family prefers it (4) 3.55 0.040
Inexpensive (5) 3.58 0.056
Widely available (6) 3.53 0.049
To quench my thirst (7) 3.66 0.042
Other (8) 3.52 0.057
I don’t know (9) 3.43 0.049
Other beverage preference
Soft drinks/soda (1) 3.53 0.034 0.000*
Diet soft drinks/soda (2) 3.45 0.038 (6, 7 & 9) - (2 & 4)A
Sports or energy drinks (3) 3.59 0.040
Alcoholic beverages (4) 3.48 0.041
Hot beverages (5) 3.53 0.038
Bottled water (6) 3.61 0.039
Tap water (7) 3.64 0.042
Sweetened beverages powder/syrup (8) 3.54 0.045
None, I prefer to drink Fruit Juice most (9) 3.67 0.062
Factors that may increase fruit juice consumption
Information on nutrition/health benefits (1) 3.60 0.034 0.000*
Increase awareness of benefits via advertising (2) 3.60 0.037 (1) - (4 & 6)A
Lower prices (3) 3.66 0.036
If other family members drank Fruit Juice (4) 3.50 0.041 (3) - (4, 5 & 6)A
Improved taste (5) 3.54 0.040
Other (6) 3.44 0.044
I drink enough Fruit Juice (7) 3.58 0.042
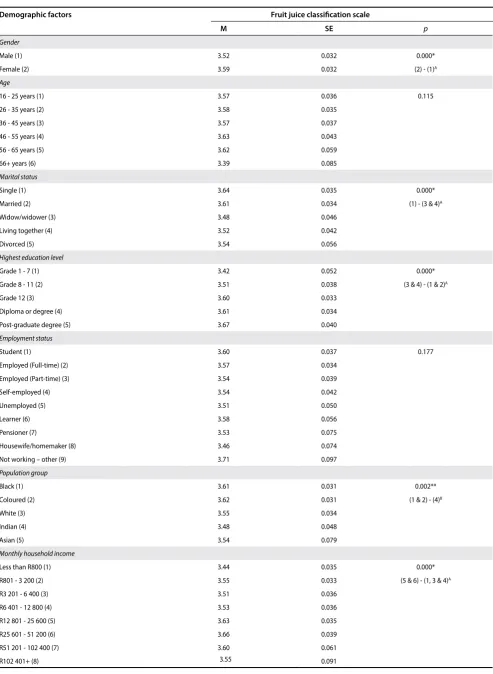
Table 6: Influence of demographic factors on fruit juice classifications
*Wald’s Chi-square test showed a significant difference at p < 0.001. **Wald’s Chi-square test showed a significant difference at p < 0.05.
ABonferroni correction pairwise comparisons mean difference is significant at the 0.001 level. BBonferroni correction pairwise comparisons mean difference is significant at the 0.05 level.
Demographic factors Fruit juice classification scale
M SE p
Gender
Male (1) 3.52 0.032 0.000*
Female (2) 3.59 0.032 (2) - (1)A
Age
16 - 25 years (1) 3.57 0.036 0.115
26 - 35 years (2) 3.58 0.035
36 - 45 years (3) 3.57 0.037
46 - 55 years (4) 3.63 0.043
56 - 65 years (5) 3.62 0.059
66+ years (6) 3.39 0.085
Marital status
Single (1) 3.64 0.035 0.000*
Married (2) 3.61 0.034 (1) - (3 & 4)A
Widow/widower (3) 3.48 0.046
Living together (4) 3.52 0.042
Divorced (5) 3.54 0.056
Highest education level
Grade 1 - 7 (1) 3.42 0.052 0.000*
Grade 8 - 11 (2) 3.51 0.038 (3 & 4) - (1 & 2)A
Grade 12 (3) 3.60 0.033
Diploma or degree (4) 3.61 0.034
Post-graduate degree (5) 3.67 0.040
Employment status
Student (1) 3.60 0.037 0.177
Employed (Full-time) (2) 3.57 0.034
Employed (Part-time) (3) 3.54 0.039
Self-employed (4) 3.54 0.042
Unemployed (5) 3.51 0.050
Learner (6) 3.58 0.056
Pensioner (7) 3.53 0.075
Housewife/homemaker (8) 3.46 0.074
Not working – other (9) 3.71 0.097
Population group
Black (1) 3.61 0.031 0.002**
Coloured (2) 3.62 0.031 (1 & 2) - (4)B
White (3) 3.55 0.034
Indian (4) 3.48 0.048
Asian (5) 3.54 0.079
Monthly household income
Less than R800 (1) 3.44 0.035 0.000*
R801 - 3 200 (2) 3.55 0.033 (5 & 6) - (1, 3 & 4)A
R3 201 - 6 400 (3) 3.51 0.036
R6 401 - 12 800 (4) 3.53 0.036
R12 801 - 25 600 (5) 3.63 0.035
R25 601 - 51 200 (6) 3.66 0.039
R51 201 - 102 400 (7) 3.60 0.061
The page number in the footer is not for bibliographic referencing www.tandfonline.com/ojcn 12
South African Journal of Clinical Nutrition 2018;1(1)
26 South African Journal of Clinical Nutrition 2018; 31(1):20–28
Marital status (p < 0.001): single respondents (M = 3.64, SE = 0.035) displayed higher positive predispositions regarding differences between fruit juice classifications than widowers/ widows (M = 3.48, SE = 0.046) and living together respondents (M = 3.52, SE = 0.042).
Highest education level (p < 0.001): respondents who had completed Grade 12 (M = 3.60, SE = 0.033), had a diploma or degree (M = 3.61, SE = 0.034), and a post-graduate degree (M = 3.67, SE = 0.040) exhibited positive sentiments towards differences between fruit juice classifications compared to those who had completed Grade 1 - 7 (M = 3.42, SE = 0.052) and Grade 8 - 11 (M = 3.51, SE = 0.038).
Population group (p < 0.05): Black (M = 3.61, SE = 0.031) and Coloured respondents’ (M = 3.62, SE = 0.031) perceptions of differences between fruit juice classifications were more positive than Indian respondents (M = 3.48, SE = 0.048).
Average monthly household income (p < 0.001): respondents with a household income of R12 801 - R25 600 (M = 3.63, SE = 0.035) and R25 601 - R51 200 (M = 3.66, SE = 0.039) exhibited positive sentiments towards differences between fruit juice classifications than those who earned less than R800 (M = 3.44, SE = 0.035), R3 201 - R6 400 (M = 3.51, SE = 0.036), R6 401 - R12 800 (M = 3.53, SE = 0.036) per month.
Discussion
The high response rate (76.4%) of the survey is one of the main advantages of self-administered questionnaires when administered on a face-to-face basis (the fieldworkers waited for the respondents to complete the questionnaires and were on hand to provide clarification for any questions) and extensive research populations can be surveyed by a comparatively small number of fieldworkers over a brief time period in a cost-effective
manner (as in this study).24 However, the relatively high
percentage of the students may diminish the sample’s representativity, but the sample was analogous to the census
data vis-à-vis certain demographic factors, namely age,
population group and gender,22 and also due to the large number
of respondents, the sample can be considered representative of the research population.
The results affirm that consumers perceive a difference between fruit juice classifications, which include: discerning a difference between fresh fruit juice, unsweetened 100% fruit juice, fruit nectar, fruit drinks and squash, and fruit flavoured drinks; observing that some of the fruit juices’ classifications are sweetened with sugar; and perceiving that not all fruit juices’ classifications are equally healthy. Therefore, a number of the consumers are aware of the differences, health benefits and sugar content between fruit juice classifications despite the considerable number of divergent messages in the scientific and public domain.5−16 Fruit juice retains and provides a majority of
nutrients in a cost-effective manner, which assists consumers in developing countries to realise their daily fruit and nutrient requirements.7,11,23 Nicklas et al.;5 O’Neil et al.;7 Kim and House;9
and Landon and Baghurst23 indicate that the overall nutritional
profiles of fruit juice consumers comprised of significantly higher intakes of magnesium, iron, potassium, riboflavin, folate, vitamin C and vitamin B6; and significantly lower intakes of added sugars, saturated fatty acids and discretionary fat in comparison to non-consumers, which indicates that fruit juice consumers’ generally
have healthier balanced diets.5,7,9,23 Akhtar-Danesh and
Dehghan25 confirm that fruit juice consumption is associated
Purchase of fruit juice prevalence (p < 0.05): respondents who purchased fruit juice 2 - 3 times a month (M = 3.61, SE = 0.035) exhibited positive sentiments regarding differences between fruit juice classifications compared to those who purchased fruit juice daily (M = 3.51, SE = 0.036).
Time-of-day fruit juice consumption (p < 0.001): respondents who drank fruit juice during lunchtime (M = 3.51, SE = 0.037) and supper (M = 3.50, SE = 0.039) presented less favourable attitudes in terms of differences between fruit juice classifications compared to those who consumed fruit juice in terms of all of the options (i.e. breakfast, lunchtime, supper and between meals) (M = 3.60, SE = 0.036). Respondents who consumed fruit juice at no specific time of the day (M = 3.63, SE = 0.035) exhibited more positive sentiments than those who drank it during lunchtime (M = 3.51, SE = 0.037), supper (M = 3.50, SE = 0.039) and between meals (M = 3.54, SE = 0.035).
Reasons for fruit juice consumption (p < 0.05): respondents who revealed that they did not know why they drank fruit juice (M = 3.43, SE = 0.049) displayed a less favourable attitudes regarding the differences between fruit juice classifications compared to those who disclosed that fruit juice was healthier than other drinks (M = 3.60, SE = 0.035), liked the taste (M = 3.59, SE = 0.036) and quenched their thirst (M = 3.66, SE = 0.042).
Other beverage preference incidence (p < 0.001): respondents who indicated that they preferred to drink bottled water (M = 3.61, SE = 0.032), tap water (M = 3.64, SE = 0.042) and only fruit juice (M = 3.67, SE = 0.062) showed positive sentiments regarding differences between fruit juice classifications in comparison to those who preferred to drink diet soft drinks/soda (M = 3.45, SE = 0.038) and alcoholic beverages (M = 3.48, SE = 0.041).
Factors that may increase fruit juice consumption (p < 0.001): respondents who disclosed that information about nutrition/ health benefits (M = 3.60, SE = 0.034) would increase their fruit juice consumption displayed positive attitudes than respondents who revealed that if other family members drank fruit juice (M = 3.50, SE = 0.041) and other reasons (M = 3.44, SE = 0.044). Respondents who cited lower prices (M = 3.66, SE = 0.036) and who would increase their fruit juice consumption showed more favourable predispositions in terms of differences between fruit juice classifications compared to those who disclosed that if other family members drank fruit juice (M = 3.50, SE = 0.041), improved taste (M = 3.54, SE = 0.040) and other reasons (M = 3.44, SE = 0.044).
Influence of demographic factors on fruit juice
classifications
The GLM ANOVA was also utilised to determine the influence of demographic factors (independent variables) on the fruit juice classification scale (dependent variable) – the results are depicted in Table 6. There were no significant differences for age and employment status.
However, significant differences were revealed amongst the variables that are described below (Table 6):
Gender (p < 0.001): female respondents (M = 3.59, SE = 0.032) displayed more favourable perceptions regarding differences between fruit juice classifications than male respondents (M = 3.52, SE = 0.032).
The findings of the present study confirm that there were many significant differences between consumption pattern variables and demographic factors. In this regard, female consumers displayed the most favourable perceptions regarding differences between the fruit juice classifications, which is a reasonable notion in a developing country, where many households are fatherless, and females (mothers and daughters) are solely responsible for the well-being of household members.29 Hence, it is also more likely
that females would be more interested in gaining increased knowledge to assist their families with a healthier diet. Respondents who were single displayed higher positive predispositions regarding differences between the fruit juice classifications, which could be explained by the prevailing health trend,20,29 particularly
among young adults who are more likely to be single.22 Consumers
who completed higher education levels exhibited more positive sentiments towards differences between fruit juice classifications. Bradshaw has documented that education levels played an important role in health status among South Africans, and wealth quintile resulted in health status disparity among the population in South Africa.29 Hence, lower income earners may not consume
fruit juice on a regular basis owing to limited financial resources
and focus on day-to-day subsistence.21 The dissemination of
additional information, therefore could reach and empower a majority of South Africans who do not have high education levels to improve their health by means of a more balanced diet which includes fruit juice and whole fruit to meet the recommended daily allowances, as indicated by Clemens et al.;10 Akhtar-Danesh and
Dehghan;25 and Drewnowski and Rehm.26 Black and Coloured
consumers’ perceptions were more positive than that of Indian consumers. This may be as a result of the substantial growth of spending power and access to education among particular previously disadvantaged ethnic groups over the past two decades (post-apartheid).21,30,31 Consumers with higher household incomes
exhibited positive sentiment differences between the fruit juice classifications than those with lower incomes.
In conclusion, a number of consumers are aware of the differences, health benefits and sugar content between fruit juice classifications in South Africa, regardless of the contradictory messages in the media. Furthermore, several demographic factors also had an influence on consumer perceptions of fruit juice classifications. A majority of the consumption pattern and demographic factors suggest that consumers with greater access to information, and from more privileged socio-demographics, had positive sentiments towards differences between fruit juice classifications. This study’s findings support the implementation of an education programme on the importance of vital nutrients, minerals and vitamins contained in different food groups (such as whole fruit and fruit juices) especially in the lower socio-demographic regions in the country.
ORCID
Rodney Graeme Duffett http://orcid.org/0000-0002-4568-6988
References
1. Saner E. How fruit juice went from health food to junk food. The Guardian. 2014 Jan 17;4.
2. Elepu G, Nabisubi J, Sserunkuuma D. Segmentation of processed fruit juice consumers in urban Uganda. BMS 2016;7(1):80–95.
https://doi.org/10.5296/bms.v7i1
3. SAFJA. General & Technical FAQ’s. [homepage on the Internet]. 2016. c2017. Available from: http://www.safja.co.za/safja-faq.html
4. Hunlun C. Characterising the flavonoid profile of various citrus varieties and investigating the effect of processing on the flavonoid content [unpublished dissertation]. Stellenbosch: Stellenbosch University; 2016.
with a healthy lifestyle and that fruit juice consumers are generally more concerned about their health. Yet, the consumption of fruit juice is only 12 litres per capita in South Africa versus several developed countries with 44 litres per
capita.24 However, many South Africans do not have access to
recent health-related information nor are they able to determine its trustworthiness owing to their low socio-economic status as a result of poor education, low income levels and other related factors.21 Clemens et al. suggested that it was important to
disseminate information about the health benefits of fruit juice,
but consumed inappropriate amounts.10 Hence, a basic
education programme could be implemented in impoverished communities, which would highlight the potential health benefits and recommended daily allowances of particular food groups such as fruit juice and whole fruit. Furthermore, information should also be provided about certain food groups, which pose potential health risks, as a result of their high sugar content. For example, it could be explained that a glass of fruit juice, with a high percentage of fruit juice, counts towards the recommended five serves of fruit and vegetables per day, but the consumption of more than a glass a day could pose a health risk due to high sugar content.5,6,8,11 Drewnowski and Rehm26 found
declining levels of whole fruit versus fruit juice consumption in the lower socioeconomic groups. Therefore, a widespread education programme (or by other means, such as community organisations, clinics, and schools) may be a suitable means of influencing South Africans to seek a healthier balanced diet.
Regular consumers of fruit juice products are able to distinguish between the different classes more readily than those who
consumed it less frequently.27 Hence, the dissemination of
additional information may assist those who drink fruit juice less frequently with the necessary knowledge to pursue a healthier diet. Consumers who purchased fruit juice several times a month observed the most favourable perceptions between fruit juice classifications. This finding may also be explained by the trend of consumers shifting their consumption patterns by purchasing better quality fruit juice, but less in quantity.28 However, this
result may also be as a direct result of the conflicting media
messages that have caused confusion among some consumers.28
Again, a simple education programme may serve to alleviate any misconceptions. Consumers who observed fruit juice as being healthier than other drinks that were exhibited, liked the taste and quenched their thirst, displayed the most positive predisposition between the fruit juice classifications, which is a reasonable supposition due to the health and fruit juice flavour profile (taste) trends observed in South Africa and Europe.20,28
Fruit consumption has been associated with a number of health benefits, which include a lower risk for cardiovascular disease,
hypertension and certain cancer types.5,6,10,16 Consumers who
preferred to only consume fruit juice, bottled water and tap water over other beverages demonstrated the greatest positive sentiments towards the differences between fruit juice classifications, which are healthier options.20,27,28 Fruit juice intake
resulted in better, healthy, nutritious diet quality and was found to have a significantly positive relationship regarding the higher consumption of total and whole fruit, while the consumption of
added sugar was lower.5,6 Consumers who stated that they may
The page number in the footer is not for bibliographic referencing www.tandfonline.com/ojcn 14
South African Journal of Clinical Nutrition 2018;1(1)
28 South African Journal of Clinical Nutrition 2018; 31(1):20–28
5. Nicklas TA, O’Neil CE, Fulgoni VL. Consumption of 100% fruit juice is associated with better nutrient intake and diet quality but not with weight status in children: NHANES 2007-2010. Int J Child Health Nutr.
2015;4:112–21. https://doi.org/10.6000/1929-4247.2015.04.02.7
6. O’Neil CE, Nicklas TA, Zanovec M, et al. Diet quality is positively associated with 100% fruit juice consumption in children and adults in the United States: NHANES 2003-2006. Nutr J. 2011;10:17.
https://doi.org/10.1186/1475-2891-10-17
7. O’Neil CE, Nicklas TA, Zanovec M, et al. Fruit juice consumption is associated with improved nutrient adequacy in children and adolescents: the National Health and Nutrition Examination Survey (NHANES) 2003–2006. Public Health Nutr. 2012;15(10):71–8.
https://doi.org/10.1017/S1368980012000031
8. Rampersaud GC. 100% Fruit juice: perspectives amid the sugar debate. Public Health Nutr. 2015;19(5):906–13.
9. Kim H, House LA. Linking consumer health perceptions to consumption of nonalcoholic beverages. Agr Resource Econ Rev. 2014;43(1):1–16.
https://doi.org/10.1017/S1068280500006870
10. Clemens R, Drewnowski A, Ferruzzi MG, et al. Squeezing fact from fiction about 100% fruit juice. Adv Nutr. 2015;6:236S–43S.
https://doi.org/10.3945/an.114.007328
11. Hyson DA. A review and critical analysis of the scientific literature related to 100% fruit juice and human health. Adv Nutr. 2015;6:37–51.
https://doi.org/10.3945/an.114.005728
12. Slavin JL, Lloyd B. Health benefits of fruits and vegetables. Adv Nutr.
2012;3:506–16. https://doi.org/10.3945/an.112.002154
13. Müller L, Gnoyle S, Popken AM, et al. Antioxidant capacity and related parameters of different fruit formulations. Food Sci Technol.
2010;43:992–9.
14. Mirmiran P, Noori N, Zavareh MB, et al. Fruit and vegetable consumption and risk factors for cardiovascular disease. Metabolism: Clinical and Experimental. 2009;58:460–8. https://doi.org/10.1016/j. metabol.2008.11.002
15. Poulose SM, Harris ED, Patil BS. Cytotoxic effects of citrus limonoids: Glycosides are more lethal than aglycones against human neuroblastoma and colonic adenocarcinoma cells. Nutr Cancer
2006;56(1):103–12. https://doi.org/10.1207/s15327914nc5601_14
16. Oyebode O, Gordon-Dseagu V, Walker A, et al. Fruit and vegetable consumption and all-cause, cancer and CVD mortality: analysis of Health Survey for England data. J Epidemiol Community Health.
2014;68:856–62. https://doi.org/10.1136/jech-2013-203500
17. Popkin BM. Sugary beverages represent a threat to global health. Trends Endocrinol Metab. 2012;23:591–3.
https://doi.org/10.1016/j.tem.2012.07.003
18. Seltzer R, Steidle J. How juice went from a health food to junk food. [homepage on the Internet]. 2016. c2017. [cited 4 August 2016]. Available from: http://feedingmykid.com/article/how-juice-went-from-a-health-food-to-junk-food/.
19. Child K. ‘Juices added’ to sugar tax crush. The Times. 2016 Oct 6;6. 20. Stanford M. Is SA’s health trend boosting fruit juice sales? [homepage
on the Internet]. 2016. c2017. Available from: http://www. insightsurvey.co.za/blog/is-sas-health-trend-boosting-fruit-juice-sales
21. Petzer DJ, De Meyer CF. Trials and tribulations: marketing in modern South Africa. European Business Rev. 2013;25(4):382–90.
https://doi.org/10.1108/EBR-02-2013-0016
22. Statistics South Africa. Census 2011: In brief. Pretoria: Statistics South Africa; 2011. p. 17–62.
23. Landon S, Baghurst K. Findings from the 2007 Australian National children’s nutrition and physical activity survey. Fruit Juice Rev.
2010;Apr:1–12.
24. Zikmund WG. Exploring the Marketing Research. Mason, OH: Thomson South Western; 2000. p. 272.
25. Akhtar-Danesh N, Dehghan M. Association between fruit juice consumption and self-reported body mass index among adult Canadians. J Hum Nutr Diet. 2010;23:162–8.
https://doi.org/10.1111/jhn.2010.23.issue-2
26. Drewnowski A, Rehm CD. Socioeconomic gradient in consumption of whole fruit and 100% fruit juice among US children and adults. Nutr J. 2015;14(3):2–9.
27. Insight Survey. SA Fruit juice industry landscape report. [homepage on the Internet]. 2016. c2017. Available from: http://www. insightsurvey.co.za/wp-ontent/uploads/2016/04/Fruit%20Juice%20 Report%20Brochure%20(12%20April%202016).pdf
28. European Fruit Juice Association. Liquid fruit market report. [homepage on the Internet]. 2014. c2017. Available from: http://aijn. org/files/default/aijn2014-full.pdf
29. Mulye TP, Park MJ, Nelson CD, et al. Trends in adolescent and young adult health in the United States. J Adolesc Health 2009;45(1):8–24.
https://doi.org/10.1016/j.jadohealth.2009.03.013
30. Bradshawc D. Determinants of health and their trends. South African health review. Durban: Health Systems Trust; 2008:51–69.
31. Duh H, Struwig M. Justification of generational cohort segmentation in South Africa. Int J Emer Mark. 2015;10(10):89–101.
https://doi.org/10.1108/IJOEM-08-2012-0078