Usability Scale Ratings
Sam McLellanUsability Architect Schlumberger
5599 San Felipe, Suite 100 Houston, Texas 77056 USA [email protected] Andrew Muddimer Project Manager Schlumberger
5599 San Felipe, Suite 100 Houston, Texas 77056 USA [email protected]
S. Camille Peres Assistant Professor of Psychology
University of Houston-Clear Lake Box 307
2700 Bay Area Blvd Houston, TX 77058 USA [email protected]
Abstract
Longitudinal studies have to do with testing over time and thus take into consideration previous user experience with a product or product versions. However, it is difficult to conduct these types of studies. Therefore the literature is sparse on examples of the explicit effect of user experience on user satisfaction metrics in industry-standard survey instruments. During a development experience in 2009, we used a cross-sectional method to look at the effects of user profiles on ratings for commercial products that use one such instrument, the System Usability Scale or SUS.
Recent research has reported finding that differences in user ratings could be based on the extent of a user’s prior experience with the computer system, a Web site being visited or a desktop application like Microsoft’s Office suite being used. Compared to off-the-shelf office products or personal Web applications, we were curious if we would find the same experience effect for domain specialists using geosciences products in the course of their daily professional job roles. In fact, from data collected with 262 end users across different geographic locations testing two related oilfield product releases, one Web-based and one desktop-based, we found results that were quite close to early assessment studies: Users having a more extensive experience with a product tended to provide higher, more favorable, SUS scores over users with either no or limited experience with a product—and by as much as 15-16%, regardless of the domain product type. This and other observations found during our product testing have led us to offer some practical how-to's to our internal product analysts responsible for managing product test cycles, administering instruments like the SUS to users, and reporting results to development teams.
Keywords
Introduction
A quick look at the human-computer interaction literature shows a few recent studies dealing with the longitudinal aspect of usability evaluation—that is, testing over time to take into consideration previous user experience with a product or product versions. For example, testing users over an 8-week period and recording frustration episodes and levels, Mendoza and Novick (2005) found that users' frustration levels decreased significantly over the duration of the study as proficiency levels increased. In a 2005 ACM article entitled "Does Time Heal? A Longitudinal Study of Usability," Kjeldskov and his co-authors reported similarly that, in relation to problem severity, there was "a significant difference between the mean severity ratings for novices and experts, with the latter generally experiencing the usability problems of the system as less severe” (Kjeldskov, Skov, & Stage, 2005, p.190). Performing tasks repeatedly with two comparable products, this time over a period of a few days, Vaughan and Dillon (2006)
suggested that product comprehension, navigation, and usability were also useful measures for uncovering performance differences between designs over time.
The renewed interest in longitudinal usability stems, in part, from a concerted effort—of real, practical benefit to product development teams iteratively designing and reviewing interfaces with customers—to understand implications for factors such as user profiles for testing, review methodologies in company development processes, or strategies for usability results analysis. Those who may have attended the 2007 ACM SIGCHI conference workshop entitled “Capturing Longitudinal Usability: What really affects user performance over time?” would have heard this concern voiced: “Typical usability evaluation methods tend to focus more on ‘first-time’ experiences with products that may arise within the first hour or two, which trends the results more towards ‘discoverability’ or ‘learnability’ problems, rather than true usability problems that may persist over time” (Vaughan & Courage, 2007, pp. 2149-2150).
Software intent and target user base should always have implications for test participant selection. For example, some software may only be intended to be used infrequently by first-time users (such as Web-based IT systems, installation programs, etc.) and should typically support novices by being fast and easy to learn and use. Other applications, such as some of our own oilfield domain applications, are designed for more frequent use and for highly experienced domain experts. These applications boast features that may take a longer time to learn to use but, over the long run, support expert users in being more effective in doing particular work.
Specifically tasked with assisting product development teams in iteratively designing, evaluating, and quantifying the user experience for suites of product interfaces, our software analysts have used standard survey instruments like Questionnaire for User Interaction Satisfaction (QUIS; Harper & Norman, 1993) and SUS (Brooke, 1996) for quantitative information about product satisfaction to supplement results from more direct product review methods. In 2009, we collected data from 262 users of two oilfield products we were
developing. These users had varying degrees of experience with the product and thus allowed us to examine the effects of experience on usability ratings. Further, we were able to explore whether these effects differed by the domain products being evaluated.
Lewis (1993) reported finding differences in user ratings on a questionnaire similar to SUS, the Computer System Usability Questionnaire (CSUQ), stemming from the number of years of experience these users had with the computer system. More recently, Sauro (2011a) found, from over 1,100 users visiting some 62 Web sites (airlines, rental cars, retailers, and the like), that users who had been to the Web site previously rated these Web sites as much as 11% more usable than those who had never been to these Web sites prior to rating them with SUS. His examination of 800 users with varying years of usage of common, commercial desktop products like Word, Quicken, Photoshop, and the like found the identical average difference based on experience—in general, “a user with a lot of prior experience will rate an application as more usable…especially…the case between the users with the most experience and those with the least (or none at all)” (Sauro, 2011b, p.1).
Method and Process
The following sections discuss the method, evaluation measures, participants, and results of our study.
Method
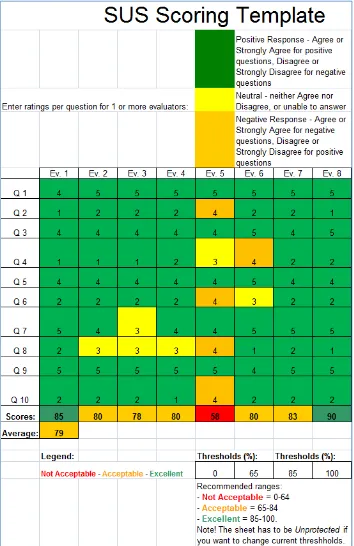
The System Usability Scale (SUS) is a simple, widely used 10-statement survey developed by John Brooke while at Digital Equipment Corporation in the 1980s as a “quick-and-dirty” subjective measure of system usability. The tool asks users to rate their level of agreement or disagreement to the 10 statements—half worded positively, half negatively—about the software under review. For reporting results, we used a scoring template that turns the raw individual survey ratings across multiple users of a specific software product into a single SUS score based on Brooke’s standard scoring method (manipulating statement ratings to get them a common 0-4 rating, then multiplying the sum by 2.5 to get a score that can range from 0-100).We used such tools with reviews, regardless of whether we were looking at interface designs or implementations.
The results of our study were from one 2009 testing cycle for two related products from the same suite: one with a Web-based frontend and the other, a desktop application. The SUS questionnaire was administered by one of our product commercialization teams and the associated deployment team—teams responsible for conducting internal testing and training or coordinating external prerelease (beta) testing with customers. The SUS was given to users at the end of an iteration period, which could last one week or much longer.
The SUS surveys were provided in English for these tests. Because both internal and external user populations come from any number of countries with non-native English speakers, we asked users upfront to let us know if any part of the survey instruments was unclear or confusing, and we examined individual user scores after the test for any potential problems resulting from misunderstanding or inadvertent miscues.
The SUS survey included requests for demographic information from users: their name, their company, their job role, the software being evaluated, the software version, date of the user’s evaluation, duration of the evaluation, and the user’s experience using the software. The survey then provided the following 10 standard statements with 5 response options (5-point Likert scale with anchors for Strongly agree and Strongly disagree):
1. I think that I would like to use this system frequently
.
2. I found the system unnecessarily complex
.
3. I thought the system was easy to use
.
4. I think that I would need the support of a technical person to be able to use this system
.
5. I found the various functions in this system were well integrated
.
6. I thought there was too much inconsistency in this system
.
7. I would imagine that most people would learn to use this system very quickly
.
8. I found the system very cumbersome to use
.
9. I felt very confident using the system
.
Measure
Typically, to evaluate the SUS responses, we look at the mean and standard deviations of the user responses for a specific system. We then color code individual responses in the scoring template to help visualize positive, neutral, and negative responses, accounting for the alternating positive-then-negative makeup of the statements.
Participants
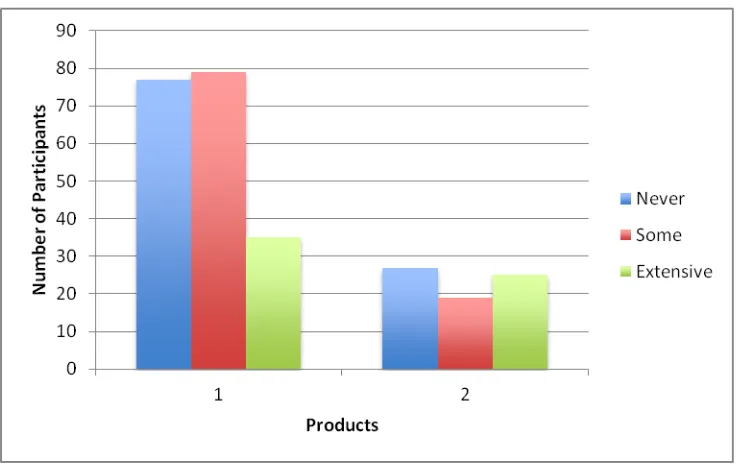
Participants were actual users of our software. A total of 262 users responded, 190 for the first product and 72 for the second. Prior to their familiarizing themselves with and using the new product software versions, all users were asked to identify themselves as one of the following:
Someone who had never used (or installed/configured as the case may have been) the software
Someone who had some but limited experience using the software Someone who had extensive experience using the software
Figure 2 shows the experience level of the users tested. Approximately the same number of users from different locations were given the SUS after a set period of training and subsequent testing and use of the product.
Figure 2. Number of users in each experience level for both products Results
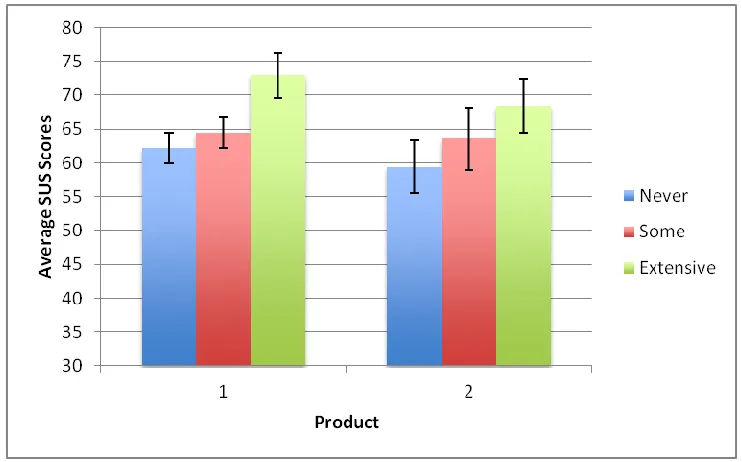
A 3 by 2 (Experience-Extensive, Some, Never by Product-One and Two) between subjects factorial ANOVA was conducted to determine the effects of experience and product type on usability ratings. As seen in Figure 3, SUS scores increased based on experience level, and this effect was significant, F (2, 256) = 15.98, p < 0.001, 2 = 0.11. There was no main effect of product F (1, 256) = 3.57, p = 0.06) nor was there an interaction between product and
experience, F (2, 256) = 0.46, p = 0.63. Table 1 provides the results of a Tukey’s HSD pairwise comparison for post-hoc analysis. This table shows that the Extensive group had higher ratings than both the Never and Some groups (both p < 0.001), and that there was no significant difference between the Some and Never groups (p = 0.117).
Table 1. Results of Pairwise Comparison for Three Difference Experience Levels
95% confidence interval Mean Diff. Std. Error p value Lower Upper
Extensive Some 9.85 1.75 < .001 5.628 14.07 Extensive Never 6.62 1.86 .001 2.130 11.09
Figure 3. SUS scores across products and experience levels: There was a main effect of experience but no effect of product or interaction between experience and product. Error bars represent the 95% confidence interval.
Conclusion
Despite its age, compared to other industry survey tools measuring user satisfaction, SUS still shows itself to be a useful, practical quantitative tool for supplementing more direct
observations or reviews about software use (Tullis & Stetson, 2004).
That said, SUS ratings are influenced by several factors in addition to the usability of the product being evaluated. There are factors like user experience that our own practical
experience shows can dramatically affect overall SUS scores for domain products—in fact, by as much as 15-16% between our Never and Extensive groups for either product type. This is consistent with results from an assessment by Sauro, who reported that more experienced users of Web sites (a repeat user group who had been to the Web site before) tended to provide higher, more favorable, SUS scores over a first-time user group (those who’d never been to the Web site before)—on average, experience increased scores very close to our results—by 6-15% (2011a, p.96).
We should add that other factors may also affect satisfaction ratings—for example, inherent differences resulting from cultural diversity of users (Tractinsky, 1997), mistakes in
Practitioner’s Take Away
Given a potential relationship between such factors as user experience and SUS ratings, we provide the following instructions to our internal company practitioners using SUS as a measure of usage satisfaction. We believe these same recommendations would be useful for anyone using the SUS with domain products.
Ask users for their level of experience with the domain product being evaluated with the SUS.
For now, we have formally added “experience with a product” to the demographics our practitioners gather when administering SUS. Our practitioners can use the experience factor to more aptly assess results when using scores as a quantitative metric for user acceptability or satisfaction. This will also help us gather additional data points, as more analysis with our other products and product types with an experience level
demographic is still needed to demonstrate if this experience effect is a general one, or more common, for example, for one particular type of product or another (Web-based, Web-enabled, desktop, mobile, etc.).
Regularly inspect the literature for other demographics (or survey changes) that might be useful to incorporate formally across their product centers using SUS as part of user test instruments.
With the sustained use of SUS in the industry, we are also more sensitive than ever, as practitioners, of monitoring what the latest research is finding about SUS and other factors that we may want to consider in our demographic set. For example, we have formed a cross-engineering center team to annually consider additional demographics or survey modifications. We have had requests from product champions to modify the wording of SUS to substitute “product” for “system” in all SUS statements to better describe the software that we build (a recommendation made by Lewis and Sauro, 2009). This year, we are also looking at adding a user’s cultural background and native language, given the company’s worldwide user population for its products, many products’ support for running in different languages, and some research suggesting an effect on product evaluation in general (see, for example, Wallace & Yu, 2009) or SUS scoring in particular (Yeo, 1998). Despite an iterative design and review process that includes target user markets, it would be interesting to inspect results to see what effect cultural differences make to perceived usability of domain products with instruments like SUS.
Report SUS results from the intended user community for a product.
We have asked our company practitioners to be even more mindful to gather the right mix of test subjects, something that should naturally be done anyway—namely, test users with the right level of experience that matches the target user base for a specific product—since the level of anticipated product usage may dictate actually biasing the user test group (or at least the results reported) towards more first-time users (the case for more occasionally used IT applications) or towards more experienced users (the case for new versions of regularly used domain products with a substantially large, existing customer base).
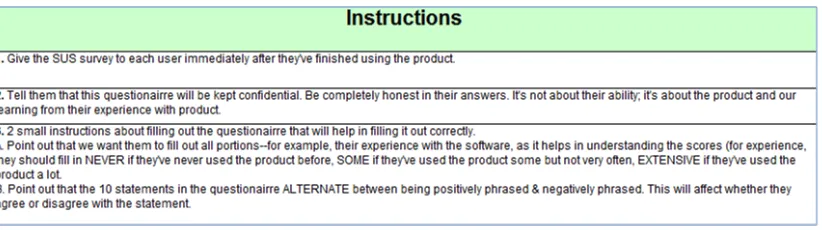
Be explicit to users about directions for correctly filling out the SUS.
Figure 4. SUS Instructions included in SUS form
Be explicit to administrators about how to correctly administer the SUS to users.
Administrators present at the end of user testing are now asked to explicitly go over these instructions with users. Our product analysts looking at their products’ SUS results have indicated this has helped since introducing the written instructions. We do not have enough evidence at the moment to know if this has helped substantially, or if we should consider more substantive approaches such as making all statements positive, something we have not done since we have considerable investment in these templates and their formal use across multiple product centers in their current state (Sauro & Lewis, 2011, also Sauro, 2011c).
Be explicit to product teams about directions for appropriately reading the results of the SUS.
A few years ago, we incorporated color coded cues in our scoring template to help us visualize potential issues associated with known issues due to the alternating nature of SUS statements (Sauro & Lewis, 2011). Instructions are, like the SUS form itself, included in the scoring template.
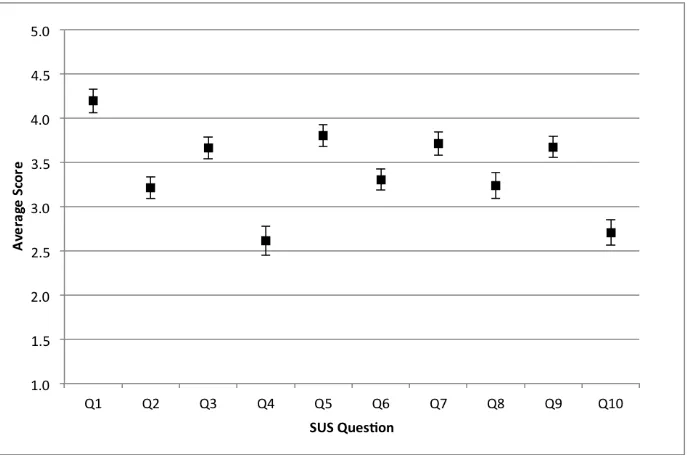
Figure 5. SUS statement by statement comparison: Markers represent the mean score for each question and the error bars represent the 95% confidence interval.
Acknowledgements
Thanks are due to the product deployment teams who carefully administered the SUS, using its explicitly written directions to users, as part of their formal test plans.
References
Bangor, A., Kortum, P. T., & Miller, J. T. (2008). An empirical evaluation of the System Usability Scale. International Journal of Human-Computer Interaction, 24(6), 574-594.
Borsci, S., Federici, S., & Lauriola, M. (2009). On the dimensionality of the System Usability Scale: A test of alternative measurement models. Cognitive Processes, 10, 193-197. Brooke, J. (1996). SUS: a "quick and dirty" usability scale. In P. W. Jordan, B. Thomas, B. A.
Weerdmeester, & A. L. McClelland (Eds.), Usability Evaluation in Industry (pp. 189-194). London: Taylor and Francis.
Erevelles, S., Srinivasan, S., & Ragnel, S. (2003). Consumer satisfaction for Internet service providers: An analysis of underlying processes. Information and Management, 4, 69-89. Finstad, K. (2006). The System Usability Scale and non-native speakers. Journal of Usability
Studies 1(4), 185-188.
Harper, B.D., & Norman, K.L. (1993). Improving user satisfaction: The Questionnaire for User Interaction Satisfaction. Proceedings of the 1st Annual Mid-Atlantic Human Factors Conference (pp. 225-233), Santa Monica, CA. Human Factors and Ergonomics Society. Kjeldskov, J., Skov. M.B., & Stage, J. (2005). Does time heal? A longitudinal study of usability.
Proceedings of OZCHI ’05 (pp. 1-10), New York, NY, USA. ACM.
Lewis, J. (1993). IBM Computer Usability Satisfaction Questionnaires: Psychometric evaluation and instructions for use (Technical Report 54.786). IBM Corporation. Retrieved from http://drjim.0catch.com/usabqtr.pdf
Lewis, J. R., & Sauro, J. (2009) The factor structure Of The System Usability Scale. Proceedings of the Human Computer Interaction International Conference (HCII 2009), San Diego, CA, USA. Available at http://www.measuringusability.com/papers/Lewis_Sauro_HCII2009.pdf. Mendoza, V., Novick, D.G. (2005). Usability over time. ACM 23rd International Conference on
Computer Documentation (pp. 151-158).
Mockus, A., Zhang, P., & Luo Li, P. (2005) Predictors of customer perceived software quality. Proceedings of ICSE '05 Proceedings of the 27th international conference on Software engineering (pp. 225-233), New York, NY, USA. ACM.
Sauro, J. (2011a). A practical guide to the System Usability Scale (SUS): Background, benchmarks & best practices. Denver, CO: Measuring Usability LLC.
Sauro, J. (2011b). Does prior experience affect perceptions of usability? Retrieved December 2011 from http://www.measuringusability.com/blog/prior-exposure.php
Sauro, J. (2011c). SUSTisfied? little-known System Usability Scale facts. UX Magazine10(3). Available at http://www.upassoc.org/upa_publications/user_experience/past_issues/2011-3.html
Sauro, J., & Lewis J.R. (2011). When designing usability questionnaires, does it hurt to be positive? Proceedings of ACM SIGCHI (pp. 2215-2223), New York, NY, USA. ACM.
Shaw, N., DeLone, W., & Niederman, F. (2002). Sources of dissatisfaction in end-user support: An empirical study. Database for Advances in Information Systems, 33(2), 41-55.
Tractinsky, N. (1997). Aesthetics and apparent usability: Empirically assessing cultural and methodological issues. Proceedings of ACM SIGCHI (pp. 115-122), New York, NY, USA. ACM.
Tullis, T.S., & Stetson, J.N. (2004, June 7-11). A comparison of questionnaires for assessing website usability. Proceedings of UPA,Minneapolis, MN.
Vaughan, M., & Courage, C. (2007). SIG: Capturing longitudinal usability: What really affects user performance over time? Proceedings of ACM SIGCHI (pp. 2149-2150), New York, NY, USA. ACM.
Vaughan, M., & Dillon, A. (2006). Why structure and genre matter for users of digital information: A longitudinal experiment with readers of a web-based newspaper. International Journal of Human Computer Studies, 64(4), 506-526.
Wallace, S., & Yu, H-C. (2009). The effect of culture on usability: Comparing the perceptions and performance of Taiwanese and North American MP3 player users. Journal of Usability Studies 4(3), 136-146.
About the Authors
Sam McLellan
McLellan began his career with Schlumberger in 1983. He cofounded a corporate usability services team in the early 1990s to champion and formalize usability
methodologies and was the inaugural leader of the company’s Human Interface Community of Practice. Currently he serves as the Usability Architect at its Houston engineering facility.
Andrew Muddimer
Muddimer is an ergonomist by degree and joined
Schlumberger at its Industrial Design Group, where he completed large-scale hardware design projects, from ticket machines to seismic land equipment and control cabins. He served as Chief Usability Architect across all SIS engineering centers and is the 2012 President of the Houston chapter the HFES.
S. Camille Peres