Grassroots Efforts in Contemporary Urban Mapping: An Analysis of
Alternative Uses of Collaborative Platforms
D. Laguia Martinez
School of Architecture, Tsinghua University, Beijing, China
*Corresponding Author’s Email: [email protected]
Tel.: +86 13220187445
INTRODUCTION
Back to Interactivity
One year after the world got over the not very well understood menace of the Millennium Effect, in Manila the use of the just made up SMS communication overthrew the President Estrada1, being the new virtual cloud, the medium where the demonstrations 1. During the 2001 EDSA Revolution, a four-day political peaceful protest, hundreds of thousands of protesters choked the centre of Manila, organized mostly by the sending of mobile text messages. It was described as a “mob rule”, “de facto coup” or “a defeat for due process of law” where after four days of demonstrations, Joseph Restrada and his family left the Malacanan Palace and Gloria Macapagal-Arroyo became President.
were organized via text messages. Eleven years later, the Egyptian repressive regime would shut down the whole country’s telecommunication system attempting in vain to stop the protests arisen in Facebook, Twitter and other social networks that finally forced Mubarak’s resignation2.
During the last decade, a new culture has been shaped. A culture which driven by broadband 2. The Egyptian Revolution of 2011, also known as the January 25 Revolution, mainly consisted on marches, public space occupations, riots, non-violent civil resistance, strikes and acts of civil disobedience. It lasted for over two weeks and finally overthrow Mubarak Government and triggered his prosecution, the dissolution of the Parliament and the suspension of the Constitution.
Stud. Archit. Urban. Environ. Sci. J., 1(1): 11-20, Winter 2018
RESEARCH PAPER
ARTICLE INFO
Article History:
Received: June 19th, 2017 Accepted: July 17th, 2017 Available Online: October 1st, 2017
Keywords:
Grassroots Efforts Bottom-up Approach Urban Mapping
ABSTRACT
Technologies have started to overlap new virtual communication and information layers on top of the urban physical territory, thus bringing along distinct possibil-ities of social organization. Regarding this phenomenon and intending to achieve improvement in a great variety of fields from Politics to Urban Planning, the terms of Smart or Digital Cities among others have been adopted, still without directly addressing the socio-organizational potential Information and Communication Techniques are bringing along. This article analyzes the evolution and feedback of a Living Lab, through the everyday use of contemporary extended tools of social and media apps, formed with the aim of quantifying the yet inefficiently mapped network of the region. By means of bottom-up development strategies, the possible achievement of more proficient initiatives compared with the current top-down approaches is assessed, not only in terms of economical cost, but also in scope and response capacity. Furthermore, expecting to indicate a line for future research possibilities, as their output and results constitute a continuously updated statistic bank, at the same time a solid database of important usefulness for other disciplines has been naturally developed, intuitively setting up a model capable of exportation to other similar communities.
How to cite this article
12 networks and complex information systems is transforming faster than ever the way we structure human relationships, and from that stage, transforming the way we live our physical spaces. While in the XX century, society has been dominated by non-interactive forms of entertainment (cinema, radio, recorded music and television), now based on a whole brand-new set of cooperative participation procedures, as seen in Manila or El Cairo, interactivity is meant to play a major role in present and future city planning [1]. With the instant ways of communication, interaction and possible quick access to information, we are no longer mere senders, but also producers, reproducers, co-workers and providers.
Information and Communication Technologies (ICTs) will not only make a more efficient use of our present physical infrastructure (buildings, roads, etc.) to ensure a strong and healthy economic progress [2]. Furthermore, as Deakin and Allwinkle [3] have formerly pointed out, they will fully establish local governance and decision-making mechanisms that will allow citizens to actively participate through co-design networks and open innovation processes.
But, on the contrary, are contemporary urban design tools ready for the new socio-spatial demands? Present political and infrastructural mechanisms are based on hierarchical organizations of power, dominance or interrelation, and as Ratti and Townsend [4] recently denoted, top-down visions ignore the great innovative potential of the grassroots efforts. By providing finished solutions rather than raw materials for designing the physical and social fabric of smart cities, the present political and organizational relationships leave aside any capability of the users to think up fresh ideas for making a better community. This article aims to collaborate on the research of bottom-up development strategies based on the use of ICTs and as the main feature of grassroots social efforts, movements at the local level that despite of their apparent natural and spontaneous condition [5] and mostly driven by volunteers, provoke a significant effect in the socio-political context where they appear.
Grassroots Efforts in Contemporary Cities
As Anthopoulos and Fitisilis state in their article “From Digital to Ubiquitous Cities: Defining a Common Architecture for Urban Development” [6], all communities face common challenges: the improvement of habitants’ everyday life; the
formation of knowledge based communities; or the simplification of both public and private service. Though the solutions have been proved to at one point indubitably need of a very specific local approach, understanding digitalization as an international effort and still at an early stage of development, this techno-urban advancement of the cities could be compared to the evolutionary growth of the World Wide Web [7]:
1. As the Static Guideline the Web was in the beginning (1.0), some cities of USA became online with the America-On-Line cities which offered public information about common issues [8]. Also, the later Digital City Kyoto simulated a virtual city available to visitors or citizens and providing a unified simplified access to mainly commercial and administrative tools [9].
2. As well as the World Wide Web evolved to a collaborative guideline (2.0), years after, the digital cities adapted to face local needs as the Copenhagen base did in the late 90s [10]. In that platform first steps were taken to create a social scenario, where a peer-to-peer system could be initially foreseen in forms of user interfaces, forum communications and message boards.
3. In the same way the Web evolved to a new guideline of contents portability, programming languages integration and information connectivity (3.0), the concept of the U-cities (Ubiquitous cities) appeared. Though initially considered by New York University’s Rudin Center Researcher Anthony Townsend [11] as a strictly Korean phenomenon, now we can point out some worldwide cases that joined the one of Songdo [12]: Osakain Japan, Masdar City in the United Arab Emirates, or PlanIT Valley in Portugal. In these cities ICTs are applied during urban and real-estate development, creating networks exchanging information and intercommunicating their civilians with their public or private institutions.
13
Stud. Archit. Urban. Environ. Sci. J., 1(1): 11-20, Winter 2018
From this point of view, some of these previous projects (3.0) will become obsolete in comparison with the achievements made by a big population, now interconnected through the peer-to-peer technologies (4.0), which have brought up the tools to identify, popularize and solve problems with much more efficacy and speed. While until now the complexity of the social fabric was only controlled by those with access to the information and by those with access to the tools to work with it, today we are already witnesses of a bigger phenomenon, involving both specialized and non-specialized poles of a much more integrated kind of global community.
In this article, in order to prove both the already existing capability of appearance and the possibility of being able to incentivize these new types of social systems, by means of the use of a Living Lab, a group of volunteers have joint to evaluate and assess the validity of a small-scale urban mapping exercise. During two months, the performance and evolution of their individual sport running routines has been merged together through GPS tracking mechanisms, collecting the data required for the elaboration of a network of urban elements in their common context. Later, once the raw information was filtered and studied through the methods described in the following section, the output has been proved to constitute the municipality’s great majority (over 80%) of the roads, squares, streets and rural paths. Taking into account the zero cost of the initiative, the short period of time analyzed, and the small scale of the group involved, the impressive result provides evidence of the potential of the grassroots social efforts.
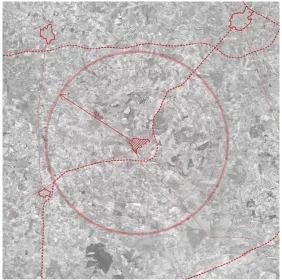
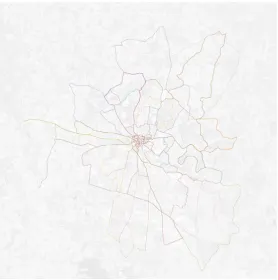
On top of that, compared to other publicly
accessible mapping databases as Google Maps or Bing Maps –Figures 1 and 2– and with their undoubtedly expensive and costly infrastructure, this article intends to contribute to the current academic debate surrounding the possibilities of bottom-up approaches in contemporary communities’ management problems. In the short period of only two months of mapping process carried out for this project, as seen in the pictures above, the difference in the amount of network represented by the cartographic webpages and the roads and streets identified by the Living Lab participants evidences an improvement necessity of the informational gathering methods of the mapping engine giants. In spite of the real impossibility of their use beyond the theoretical demonstration of the conclusions drawn in this paper, the results clearly serve to point the vast latent capabilities of new social standards of interpersonal relationships and co-participation procedures, encouraging future academic research in this line.
As pointed out in the images above, with an accuracy of over 95% when contrasted with cartographical historical databases and orthogrammetric governmental maps3, much higher than that of Google and Bing images, the Living Lab evidences the success of bottom-up managed initiatives in those areas where the economical profit does not incentive private initiatives. ICTs, apart from bringing about the new social interaction possibilities that this document assesses, have also created the possibility of data generation that Figure 3 evidences, from where to dive into much more 3. The aerial image database employed has been the PNOA service, which stands for National Plan of Aerial Orthophotography, and constitutes the most objective representation of the territory for the country of Spain. It can be accessed for free at <http://pnoa.ign.es/>.
(Figure 1)
(Figure 2)
(Figure 3)
Bing Map of the area Google Map of the area Result Living Lab Map
(Figure 1)
(Figure 2)
(Figure 3)
Bing Map of the area Google Map of the area Result Living Lab Map
(Figure 1)
(Figure 2)
(Figure 3)
Bing Map of the area Google Map of the area Result Living Lab Map
14 complex and truly cooperative social movements with direct urban and sociopolitical impact.
METHODOLOGY OF THE RESEARCH
The location chosen for the Living Lab is the municipality of Cenizate, which belongs to the province of Albacete, Spain. According to the demographic information available at the public Governmental Census databases [15], it has a population of 1,397 people and has been chosen due to the next considerations:
• Though the danger of depopulation that small settlements are suffering in the most of European countries, this town presents a curious exception. It has not only kept growing but has even had the highest growth of the region through the last decade (1,115 inhabitants in 2001 to 1,397 inhabitants in 2011). This peculiarity would not risk the capabilities of exportation of the project to other less favorable areas, but, in its place, it guarantees that also could be applicable to diverse sets of circumstances as purely urban zones, characterized by its present steady growth.
• As well, in the last years the population pyramid
shows a distribution slightly diverse from the country average, having a higher young percentage, probably occasioned by the maintenance of several industrial and agricultural manufacturing facilities that can provide and sustain stable employment for the area, thus supporting the aforementioned application to non-rural city contexts.
• The urban density (24,59 inhabitants per kilometer) is representative for a great number rural municipalities in Spain, Portugal and South American Countries, while, at the same time, its total area (63,26 square kilometers) is of a size small enough to guarantee a comprehensive research and the validity of the results. Later, these could be extended and applied to the rest of the similar situations commented with a high probability of success.
Therefore, although the study case could not be purely considered as a sheer city, this community emulates many of the behaviors of modern urban areas while, on the other hand it has a much clearer and traceable urbanism. In this way, it has allowed the project to be defined by the natural limits of the present street network condition, instead of the being forced to state a number of reasons that would let (Figure 1) (Figure 2) (Figure 3)
Bing Map of the area Google Map of the area Result Living Lab Map
(Figure 4)
Location and scope of the project within the region
15
Stud. Archit. Urban. Environ. Sci. J., 1(1): 11-20, Winter 2018
us design a set of radii to delimitate a more artificial approach to the study, required in other typologies of urban morphological analysis [16].
Regarding to the agents involved, all the participants of the Living Lab, which has generated the whole body of the results exhibited in this article, both are born and raised inhabitants of Cenizate, currently belong to the local Athletics Club, and voluntarily engaged in the project. A total of fifteen runners, who usually base their 3/4 weekly trainings on software mobile apps for the mapping and tracking of their activities, accepted to publicly share through a common channel the feedback generated after their sport sessions. These activities, on average 15 to 25 kilometer each one, form a total of over three hundred activities and over one thousand kilometers mapped, tracked, and verified at the end of the two months of the research.
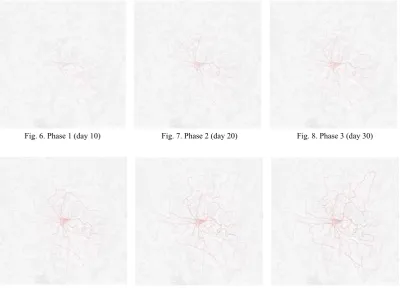
In order to compare the series of time-map representations of the activities conducted during the experiment, later represented for six periods (every ten days in the course of the project), a modus operandi derived from the “Cartographic Redrawing” method [17, 18] was used. While the Cartographic Redrawing, as explained by the Portuguese authors, refers to the
vectorization technique of raster images based on the present condition so as to sequentially eliminate the non-existing roads on previous stages of the urban network, in the case of the Living Lab, a temporarily-symmetrical approach has been elaborated. By means of GIS (Geographic Information System) open-source software QGIS, using as a background the orthogrammetric image of the municipality, the tracked routines of each participant for each of the six periods was successively imported, thus identifying and correcting possible GPS deviations, and step by step building the final result –figure 5. Besides, as can be seen in figures 6 to 11, starting from the results of the first ten days’ phase, the next periods were added as subsequent layers with lower transparency, in order to allow for a qualitative evaluation of the mapping progress and to let the participants schedule new routines in unmapped/untrained areas.
The research has been conducted during the months of July and August in the year 2016 and the sport results of the runners compared to the results of the previous years 2014 and 2015, time frame where they have always been using their tracking phone apps and a similar training routine. These dates were chosen
(Figure 5)
Comparative chart of the performance of the runners
16 to fit in the preparatory program of the athletics team for one of the main races of the season called “La Gran Joya” in its IX edition on August 16th 2016, which was when their most intensive training was programmed and therefore when the research could benefit from a greater mapping potential. The contrast of the results of the 2016 year compared to the two previous ones is not presented in this article since the apparent evolution in the diverse annual outcomes could not be directly linked to the new engagement brought along by the Living Lab, and is probably more a consequence of their physical improvement and the enrolment of new members in the Athletic Club. Still, it was a very interesting and welcomed product, since it became a qualitative data of importance for each individual athlete: on the one hand for the reviewing of their sport achievements, and on the other hand also for the study of their routes in order to be able to readjust their plans and produce a more varied network of training schedules. In such a manner, in line with the ideas shared in the introduction, not only the mapping result was on the major achievements of the Living Lab, but also other unplanned outcomes were created without additional effort and became useful for the members engaged in the exercise.
As in the “Green Eyes Project” by the Fing Think Tank [19], where so as to increase the amount of ozone measurements in Paris, two hundred smart devices where distributed among the citizens who passively sensed the ozone and noise levels as they went through their daily routines, a similar procedure has been chosen for the realization of the maps here presented. Nevertheless, as this paper focus on the importance that these kinds of interventions can be naturally initiated by anonymous individuals without the necessity of extra costs, instead of using costly ozone sensing gadgets, the only tool used through the exercises has been the personal mobile phones of the volunteers involved. Similarly, instead of later using the Citypulse mapping engine for the exhibition of the results [19], more accessible and simple communication sharing platforms (social networks such as Twitter, Facebook Messenger and Whatsapp among others) have been used in this exercise. From these platforms, without the need of physical interaction, the author was able to download their mapping exercises and easily give back to the participants the correlative individual and comparative team resulting maps and statistics, without the need of compulsory communication
between the runners with each other.
Finally, regarding the GPS tracking app, since it was a condition neither to require any extra effort from the participants, nor to demand any expert knowledge, the commonly extended sport mobile phone apps already used by the participants were chosen. These were popular apps such as Endomondo, Runtastic and Mapmyrun, which allow for routine geolocalised sharing. Although these software lack of social implementations (at least at the moment) for the creation of cooperative incitement based on community belonging feelings, they allow to freely share the routine detailed information in a variety of platforms, thus fully satisfying the necessities for conducting this research. Nonetheless, please note in Figure 3, that the major traffic routes have been added as dashed lines. They have been represented in such a manner because they were added manually afterwards in the GIS post-edition process, just to serve for the comparison purpose with Bing and Google mapping engines of the previous section. These routes were not mapped by the Living Lab participants since they are mostly vehicular areas colonized by other means of transportation and the athletes intentionally only went through them in very specific occasions.
RESULTS AND DISCUSSION
To Map the World in a Month
From the first and limited navigation routes of over fifteen centuries ago to the modern commercialized maps, two major changes have occurred. One, regarding the representation and reproduction of the information, from brushes and parchment to digitally vectorization. And secondly, regarding the collection and manipulation of data, from visual estimations and magnetic compasses to digital raster graphic processers and GIS referencing. Recently, during the last decade, thanks to the field rugged computers, GPS and laser rangefinders, it has been possible to retrieve data of great accuracy, directly in the terrain, and with tremendous speed, directly arriving to the later aesthetical processes of representation of the information intended.
17
Stud. Archit. Urban. Environ. Sci. J., 1(1): 11-20, Winter 2018
cartographical representation. Once the technology is fully implemented for the autonomous realization of the ideas presented in this paper, both processes of representation-reproduction and collection-manipulation will be unified in one single act, then almost simultaneously transmitted to the rest of the peer units. Very soon from now, without the need of a hierarchical or even coordinated structure, groups of people will show the accomplishment of highly efficient results, because of their quadratically increasing network links [21], links that by these days enable us to connect to information and other characters of the mob, performing tasks of incredible complexity based on anonymous peer-to-peer liaison. While today still looks like science fiction, before long either urban or landscape maps and architecture or spatial plans will be drawn real-time, based on the information of connections of individual nods of the net, which in an altruist participative symbiosis are already cooperating to the construction of information sets, which even at present logarithmically surpasses our processing analysis capacities.
Nowadays, since we have not yet arrived to the point in time described in the last paragraph, and due to the rural and less populated character of the areas presented in this research, their mapping does not represent a profitable commercial investment for third parties, lacking the economic interest that could drive the realization of the venture. Thus, the result shown in the images of Google Maps and Bing Maps is a delineation of limited fidelity and narrow scope, since the economical retribution of higher quality products would never exceed the cost of manufacture if done with the modern techniques and procedures. A typical example of market spontaneous order where later government needs to earmark important sums of taxes to the elaboration of the municipal cadaster cartographical information, so as to regulate uses like agriculture, ranching and stock breading, land administration, fire prevention, nature and biological research, and so forth.
To this extent, not proposing the modest methodology used in here as a guide but rather as an example of bottom-up mapping initiatives, after
(Figure 6)
(Figure 7)
(Figure 8)
Phase 1 (day 10) Phase 2 (day 20)
Phase 3 (day 30)
(Figure 9)
(Figure 10)
(Figure 11)
Phase 4 (day 40) Phase 5 (day 50)
Phase 6 (day 60)
(Figure 6)
(Figure 7)
(Figure 8)
Phase 1 (day 10) Phase 2 (day 20)
Phase 3 (day 30)
(Figure 9)
(Figure 10)
(Figure 11)
Phase 4 (day 40) Phase 5 (day 50)
Phase 6 (day 60)
(Figure 6)
(Figure 7)
(Figure 8)
Phase 1 (day 10) Phase 2 (day 20)
Phase 3 (day 30)
(Figure 9)
(Figure 10)
(Figure 11)
Phase 4 (day 40) Phase 5 (day 50)
Phase 6 (day 60)
(Figure 6)
(Figure 7)
(Figure 8)
Phase 1 (day 10) Phase 2 (day 20)
Phase 3 (day 30)
(Figure 9)
(Figure 10)
(Figure 11)
Phase 4 (day 40) Phase 5 (day 50)
Phase 6 (day 60)
(Figure 6)
(Figure 7)
(Figure 8)
Phase 1 (day 10) Phase 2 (day 20)
Phase 3 (day 30)
(Figure 9)
(Figure 10)
(Figure 11)
Phase 4 (day 40) Phase 5 (day 50)
Phase 6 (day 60)
(Figure 6)
(Figure 7)
(Figure 8)
Phase 1 (day 10) Phase 2 (day 20)
Phase 3 (day 30)
(Figure 9)
(Figure 10)
(Figure 11)
Phase 4 (day 40) Phase 5 (day 50)
Phase 6 (day 60)
Fig. 6. Phase 1 (day 10) Fig. 7. Phase 2 (day 20) Fig. 8. Phase 3 (day 30)
18 the results obtained, we can have an idea of the real potential of encouraging and stimulating social co-participation and creation as the motor of real development. Contrary to Putnam’s ideas [22], the power of emerging virtual communities, based on a completely new set of actors, norms and structures, would counteract the decrease of social capital and civic engagement experienced during the last century, decoding a new whole collection of opportunities with direct application in education, exchange of broad community information, and government political participation [23]. In the case studied in Cenizate’s Living Lab, the result would not necessarily deny any higher existing authority and would not lack of an organized structure, needed to guarantee the fidelity of the outcome. Instead, in despite of their initial complex appearance, these systems themselves might be examples of the first real meritocracies [24], where decision making power is vested in individuals practically only based on merit or excellence, valuing expertise and knowledge over the fixed external authority of centralized social systems but still coordinated and harnessed by them in a different way to all intents compared to the present market-economies.
CONCLUSIONS
Grassroots Efforts beyond Mapping
Despite the fact that Urban Planner as a recognized unique profession is barely 70 years old [25], since its birth, it has been constituted as part of a top-down process by which the designer created the plans after a series of conditions given by the investors and the national government or local city council authority. Even, still in contemporary education system, the profession is taught based on architectural, surveying or engineering disciplines, appreciating the final result depending on the grade of integration and coherence that the author would achieve between these disciplines and the fulfillment of the requirements of the area of the city to be planned.
In the last years, influenced by the paper “Advocacy and Pluralism in Planning” by American theorist Paul Davidoff [26] a shift has started to be shaped. The importance of the sociopolitical nature of planning has been acknowledged, then claiming for a more democratic process, promoting direct and active participation of community associations and developer actors. Evidence suggests that when reforms
or measures are imposed from above, it can be difficult to assume them by the citizens [27], who sometimes consider that their execution arrives too late or that it doesn’t match the necessities that triggered their design. Moreover, according to some authors and in line with the results demonstrated in this paper, the support of initiatives coming from the masses allow for a better feeling, a wider range of creativity and a cooperative sense of belonging [28]. In such a way, recently the concept of Strategic Urban Planning (SUP) processes have taken one step further in order to improve resource management, intending to achieve further grades of cooperation and comprehension between administration, businesses and an ample spectrum of social agents [29].
Nevertheless, although these measures are by now starting to be put into practice, achieving more satisfactory results than the previous purely hierarchical ones, their foundation still lacks of a consistent basis of real participation, sometimes just remaining at a superficial level, creating politically controversial debates, and far from taking advantage of the whole ICTs assortment of possibilities. Since the urban planners in the end remain in charge of organization, analysis and moderation of the conversational programs, their designs ignore the capabilities of real bottom-up approaches, thus not being truly co-participative design processes. Therefore, insomuch as there are grounds for believing in new social and organizational structures to be more efficient and wider in scope of action, being present technology “smartification” process a suitable medium, is contemporary city planning and decision making now finally ready for tangible bottom-up implementations?
19
Stud. Archit. Urban. Environ. Sci. J., 1(1): 11-20, Winter 2018
was the detonator of Egypt president resignation in 2011; and as the Blackberry Messenger chat room that organized the England Riots of the same year [31]; the most innovative and significant uses of the ICTs have been the ones where the software was cooperatively used in a way that it was not conceived for. These uses made the tools evolve and create the new ones in a constant development where we are not only users but producers, anonymously contributing to natural appearance of social smart mobs, which sometimes manage to apprehend the authoritative power of governmental or private financial structures. We are those producers both in a design way, being nowadays the creation tools handier for us to conceive other functions; but also in a collaborative way, being part of a peer-to-peer system where we can all be connected as small sensors of the most sophisticated machine and coordinated as an immense social bird flock [4].
From this point in time on, having used the example of mobile phones apps utilization, this article does not simply intend to prove the specifics of the methodology used. Putting aside the infrastructural costs of the networks that sustain present communication technologies [32], this article instead aspires to present the great range of fields and the immense scope of actions that no longer need to rely on private necessities, since already the communicative tools and data mining resources have overcome the power of previous obsolete top-down approaches. The case of Cenizate’s municipality mapping exercise described in this text, if understood only by its urban network drawing outcome, just represents an insignificant contribution compared to the real magnitude of these kind of enterprises. Whereas it may indeed have a striking impact on the agents involved in the Living Lab and on the whole inhabitants of the municipality due to the knowledge of the specific region mapped, the major learning withdrawn from this experience is the new availability of social engagement possibilities that are now within reach. While the difference in the rapport of the three mapped images (the one obtained versus the ones retrieved from the Bing and Google online resources) is noticeable, what this comparison truly demonstrates is the evident differences between before and after the appearance of the ICTs and the new interactivity that has been unlocked.
Although the first advances in the field are predictably going to come from private corporations, taken for granted that the fast speed of growth that
characterizes contemporary society will continue to increase, there is also the need to analyze their real potential and study their implementation at socio-organizational levels. Therefore, “Grassroots Efforts in Urban Mapping” has presented the initial findings of a longer term investigation of the spatial structure and sociological morphologies of contemporary urban communities, a research aiming to reckon that the so called smart design planning cannot be simply described as generically urban or approached by unidirectional methodologies, being imperative an understanding of the social factors that influence city planning and therefore, policy making.
CONFLICTS OF INTEREST
The author declares there are no conflicts of interest that may affect the publication of this manuscript.
REFERENCES
1. Paskaleva, K. Enabling the smart city: The Progress of E-city Governance in Europe [online]. In: International Journal of Innovation and Regional Development (IJIRD), 2009, p. 405–422 [Viewed on 10 February 2015]. Available from: doi: 10.1504. 2. Holland, RG. Will the Real Smart City Please Stand up? [online].
In: City, 2008, p. 303–320 [Viewed on 20 December 2016]. Available from: doi: 10.1080.
3. Deakin, M and Allwinkle, S. Urban Regeneration and Sustainable Communities: the Role of Networks, Innovation and Creativity in Building Successful Partnerships [online]. In: Journal of Urban Technology, 2007 [Viewed on 5 January 2015]. Available from: doi: 10.1080.
4. Ratti, C. and Townsend, A. The Social Nexus: The best way to harness a city’s potential for creativity and innovation is to jack people into the network and get out of the way [online]. In: Scientific American, New York, USA, September 2011. [Viewed on 7 September 2016]. Available from: <http://www. scientificamerican.com/>.
5. Ekins, P. A new world order: grassroots movements for global change. Routledge, 1992.
6. Anthopoulos, L and Fitisilis, P. From Digital to Ubiquitous Cities: Defining a Common Architecture for Urban Development [online]. TEI Larissa, Greece, Athens, 2011, p 1–3. [Viewed on 21 October 2016]. Available from: <http://dde.teilar.gr/publications/ >. 7. Mendoça Teixeira, M. Cyberculture: From Plato to the Virtual
Universe, The Architecture of Collective Intelligence. Germany, Munich, GRIN Verlag 2012, p. 14–20.
8. Wang, L and Wu, HA. A Framework of Integrating Digital City and Eco-city. School of Business, Hubei University, China, Wuhan, 2005.
9. Ishida, T, Akahani, J, Hiramatsu, K, Isbister, K, Lisowski, S, Nakanishi, H, Okamoto, M, Miyazaki, Y, and Tsutsuguchi, K. Digital City Kyoto: Towards a Social Information Infrastructure. In: Communications of the ACM, 2002, vol.45, No.7.
20 11. Townsend, A. Smart Cities: Big Data, Civic Hackers, and the
Quest for a New Utopia. W. W. Norton & Company, 2013. 12. Hyang Sook, C. Ubiquitous-City Business Strategies: The Case
of South Korea. In: Management of Engineering and Technology PICMET, IEEE, Korea, Seoul, 2007.
13. Amandarajan, M and Amandarajan, A ed. Research collaboration: Theory, techniques and challenges. U.S., New York: Springer, 2010. 14. Honeywill, R. Social Intelligence Lab [online]. [Viewed
on 29 January 2015]. Available from: < http://www. socialintelligencelab.com>.
15. Diputación de Albacete. Evolución de la demografía hasta el año 2012 [online]. [Viewed on 20 August 2016]. Available from: <http://www.dipualba.es/municipios/cenizate>.
16. Griffiths, S, Dhanani, A, Claire, E, Haklay, M, Jeevendrampillai, D, Nikolova, N, Rickles, P and Vaughan, L. Using Space Syntax and Historical Land-use Data to Interrogate Narratives of High Street “Decline” in Two Greater London Suburbs. In: KIM, Y. O., PARK, H. T. and SEO, K. W. (eds.), In: Proceedings of the Ninth International Space Syntax Symposium, Korea, Seoul: Sejong University, 2013, p.036:1-036:15.
17. Pinho, P. and Oliveira, V. Cartographic Analysis in Urban Morphology. In: Environment and Planning B: Planning and Design, Vol. 36 (1), 2009, p.107–127.
18. Serra, M and Pinho, P. Dynamics of Periurban Spatial Structures: Investigating Differentiated Patterns of Change on Oporto’s Urban Fringe. In: Environment and Planning B: Planning and Design, vol. 38 (2), 2011, p. 359–382.
19. Rivière, AC, and Brugière, A. Bien Veillir Grace au Numerique. Autonomie, Qualité de Vie, Lien Social. First Edition. France, Paris, FYP Edition, 2010.
20. Matthews, SE. How Google Tracks Traffic [online]. In: The Connectivist. July 2013 [Viewed on 21 November 2016]. Available from: <http://www.theconnectivist.com/2013/07/ how-google-tracks-traffic/>.
21. Rheingold, H. Smart Mobs: The Next Social Revolution. Basic Books, 2002.
22. Putnam, R, Social Capital: Measurement and Consequences [online]. Kennedy School of Government, Harvard University. July, 2014. [Viewed on 19 January 2015]. Available from: <http:// www.oecd.org/innovation/research/1825848.pdf>.
23. Blanchard, A and Horan, T. Virtual Communities and Social Capital [online]. In: Social Science Computer Review. October 1998 vol. 16 no. 3 pp. 293–307 [Viewed on 10 November 2016]. Available from: doi: 10.1177.
24. Rheingold, H. The Cooperation Project: Objectives, Accomplishments, and Proposals [online]. In: Institute for the Future. March 2005 [Viewed on 30 January 2015]. Available from: <http://www.rheingold.com/cooperation/>.
25. Hodge, G and Gordon, D. Planning Canadian Communities. Fifth edition, Nelson College Indigenous, 2007.
26. Davidoff, P. Advocacy and Pluralism in Planning [online]. In: Journal of the American Institute of Planners. November 1965, vol. 31, p. 331–338 [Viewed on 1 February 2015]. Available from: doi: 10.1080.
27. Pereira, B, Carlos, L, Marvall, JM, and Przeworski, A. Economic reforms in new democracies. United Kingdom, Cambridge, Cambridge University Press, 1993.
28. Dubois, HFW. Harmonization of the European vaccination policy and the role TQM and reengineering could play. In: Quality Management in Health Care, 2002, 10 (2): p. 47–57. 29. Borja, J and Castells, M. Local y global: La Gestion de las
Ciudades en la Era de la Informacion. Spain, Madrid, Fundacion Caja Madrid (Ed.), 1998.
30. Bischoff, P. China’s Mobile Internet Users Now Outnumber its PC Internet Users [online]. In: Techinasia. July 2014 [Viewed on 16 January 2016]. Available from: <http://www.techinasia.com/ chinas-mobile-internet-users-outnumber-pc-internet-users>. 31. Garside, J. UK riots: Mobile phone operators help police to
identify looters. The Guardian (London), August 2011. [Viewed on 28 August 2016]. Available from <http://www.theguardian. com/uk/2011/aug/09/uk-riots-mobile-phone-operators>. 32. Blum, A. Tubes: Behind the Scenes at the Internet. United
Kingdom, Penguin, 2012.
COPYRIGHTS
Copyrights for this article are retained by the author(s) with publishing rights granted to the SAUES Journal.