© Shiraz University
K-MEANS BASED MULTIMODAL BIOMETRIC AUTHENTICATION
USING FINGERPRINT AND FINGER KNUCKLE PRINT
WITH FEATURE LEVEL FUSION
*A. MUTHUKUMAR
1**AND S. KANNAN
21Dept. of Electronics and Communication Eng., Kalasalingam University, Krishnankoil, Srivilliputtur, India
Email: muthukumar@klu.ac.in
2Dept. of Electrical and Electronics Eng., Kalasalingam University, Krishnankoil, Srivilliputtur, India
Abstract– In general, identification and verification are done by passwords, pin number, etc., which are easily cracked by others. To overcome this issue, biometrics has been introduced as a unique tool to authenticate an individual person. Biometric is a quantity which consists of individual physical characteristics that provide more authentication and security than the password, pin number, etc. Nevertheless, unimodal biometric suffers from noise, intra class variations, spoof attacks, non-universality and some other attacks. In order to avoid these attacks, the multimodal biometrics, i.e. a combination of more modalities is adapted.Hence this paper has focused on the integration of fingerprint and Finger Knuckle Print (FKP) with feature level fusion. The features of Fingerprint and (FKP) are extracted. The feature values of fingerprint using Discrete Wavelet Transform and the key points of FKP are clustered using K-Means clustering algorithm and their values are fused. The fused values of K-Means clustering algorithm is stored in a database which is compared with the query fingerprint and FKP K-Means centroid fused values to prove the recognition and authentication. The comparison is based on the XOR operation. Hence this paper provides a multimodal biometric recognition method to provide authentication with feature level fusion. Results are performed on the PolyU FKP database and FVC 2004 fingerprint database to check the Genuine Acceptance Rate (GAR) of the proposed multimodal biometric recognition method. The proposed multimodal biometric system provides authentication and security using K-Means clustering algorithm with GAR=99.4%, FRR=0.6% and FAR=0% with security of 128 bits for each modality.
Keywords– Biometrics, feature level fusion, fingerprint and FKP feature extraction, K-Means clustering algorithm, multimodal biometric systems
1. INTRODUCTION
Biometrics is a powerful and unique tool based on the anatomical and behavioral characteristics of human beings. Biometrics is defined as the measure of human body characteristics such as fingerprint, FKP, eye, retina, voice pattern, Iris and Hand measurement. Most anatomical characteristics used for security application are fingerprint, Iris, FKP, face and palm print [1-5]. Apart from anatomical characteristics, behavioral characters like voice, signature, and gait moments are also used to recognize the user. Therefore authentication plays an important role in the secured way of communication. Currently, passwords and smartcards are used as the authentication tools for verifying the authorized user. However, passwords can be easily cracked by dictionary attacks, and smart cards may be stolen or missed. So, the authorized user will not be identified, and the hackers are allowed. Biometrics is the only remedy for these problems.
This paper discusses two biometric identifiers named fingerprint and FKP. Analysis and comparison of all possible biometrics discussed by Uludag et.al [6] on various factors, states that each biometric has its own importance and unimportance. The feature extraction of fingerprint has been discussed in [7-9]. The fingerprint recognition was done with image segmentation and K-Means clustering algorithm [10-11]. Many researches are being done on FKP [12-13] biometric as it has unique characteristics like fingerprint, iris, etc. in order to identify the genuine user. The features of FKP are extracted using the Gabor filtering with the cropped region of interest [14-15]. Zhang, et.al has proposed the score level fusion with FKP and its recognition has been performed with the phase congruency, local feature and local phase features [16]. Lowe has proposed a novel approach to extract the invariant features as key points, which are used for object recognition through Hough transform [17]. The local information of FKP is accessed using Scale Invariant Feature Transform (SIFT) and Speed Up Robust Features (SURF) [17-19]. The SIFT algorithm is used to get the key points using the scaling and invariant features, which are matched to prove the user authentication [17-18].
Most biometric systems that are presently used in real time applications typically use a single biometric characteristic to authenticate the user. The challenges encountered by the unimodal biometric systems are noise in the sensed data, non-universality, spoofing, and intra-class variations. These limitations of the unimodal biometric system can be solved by integrating the multiple sources of biometric information. Such systems are known as Multimodal Biometric Systems, which are more reliable due to the presence of multiple, independent pieces of data. The limitations of unimodal biometric systems can be overcome by using multimodal biometrics where two or more sources are used to validate identity. High security is achieved by means of continuously verifying the user’s presence [6, 20]. Their system of fingerprint and face biometric data requires the presence of the user at all times, for continuous monitoring, hence it is not suitable for access control applications. In their approach, the system administrator provides the decision rules in accordance with the security level. Vincenzo Conti et.al [21] has proposed fusion of features of fingerprint and iris with frequency based approach and hamming distance based matching algorithm. Monwar et.al [22] has discussed rank level fusion of face, ear and signature with principal component analysis and fisher’s linear discriminant analysis for matching purpose. The fusion of various modalities has been done by four methods: sensor level fusion, feature level fusion, score level fusion and decision level fusion [23].
The general multimodal biometric recognition process was shown in Fig. 1, which consists of two- phase, i.e., enrollment phase and verification phase. The first extracted features of multimodal biometrics are stored in the database and are known as enrollment phase and the same features are matched with the database using the query input known as verification phase. The feature extraction process extracts the person’s input information from the biometric data. In this paper, feature values of fingerprint are extracted using 2D-Discrete wavelet transform at 2 level decomposition using Haar transform [8], [9], [24].
Feature values extracted from biometrics are analyzed by various clustering methods. The various clustering methods are hierarchical clustering, K-Means clustering algorithm and different statistical distribution’s methods. This paper proposes a scenario of integrating the biometrics of fingerprint and FKP combined with feature level fusion. The fused values of K-Means clustering algorithm with both biometrics were stored in database in enrollment phase. In the verification phase, the fused values of both biometrics are matched with the stored one to decide whether that user is genuine or an impostor.
The rest of this paper is arranged as follows, Section 2 describes the structure of the proposed work. Section 3 gives the details of the feature extraction and key point extraction of fingerprint and FKP. Section 4 discusses the clustering process using K-Means clustering algorithm. Section 5 explains the multimodal biometric enrollment and verification phase. The experimental results and the analysis are given in section 6. Finally, section 7 provides the conclusion.
2. STRUCTURE OF THE PROPOSED WORK
Biometrics is a technique used to provide unique individual characteristics of a human being. The unimodal biometric has a number of disadvantages, which are discussed in the introduction section, so this paper proposes the multimodal biometrics by integrating fingerprint and FKP. The clustering method will give centroid value of the group, which reduces the number of points of a system. This paper proposes a new technique named biometric clustering system to merge the above two process to provide authentication for individuals. This paper proposes a novel method to combine the feature extraction process with clustering to find the output values of fingerprint and FKP in the bit format with feature level fusion. The databases used for this paper were obtained from the Polytechnic University of Hongkong [25] and FVC2004 DB1, DB2, DB3, DB4 [26]. This paper also consists of two processes, i.e. multimodal biometric enrollment and verification phase. The multimodal biometric enrollment process is shown in Fig. 2.
Fig. 2. Multimodal biometric enrollment phase
In this phase, the feature values are extracted from fingerprint using 2D-DWT and are clustered together to find the centroid value using K-Means clustering algorithm. The key points are extracted from the FKP using histogram and SIFT. The key points are also clustered together to find the centroid value using K-Means clustering algorithm. The centroid value of fingerprint and FKP are converted to binary values of 128 bits each. The two 128 bits are concatenated and stored in the database. This type of fusing the two biometric values is known as feature level fusion. The next phase of this paper is multimodal biometric verification phase which is shown in Fig. 3.
recognition and authentication. The comparison is based on the XOR operation. If all the outputs of the compared values are zero, then decide whether the user is authenticated as a genuine one, or whether user is an impostor.
Fig. 3. Multimodal biometric verification phase
3. FEATURE EXTRACTION OF FINGERPRINT AND FINGER KNUCKLE PRINT
a) Feature extraction of fingerprint using discrete wavelet transform (DWT)
Fingerprint is one of the most important biometric anatomical characteristics. The fingerprint is framed of valleys and ridges. For extracting fingerprint feature values, this paper proposes 2D-Discrete Wavelet Transform (DWT) based feature extraction [8-9] [24] [27-28], which are depicted in Fig. 4. The fingerprint is captured using sensors, but it creates some noises while capturing. In order to reduce the noise and to increase the contrast between ridges and furrows, enhancement method is used.
Fig. 4. Feature extraction process flow
In fingerprint, median filter is used to remove the noise. In this, the first step appends two rows and columns of zeros to the whole image. The second step separates the image into 33 matrices. Third step calculates central pixel based upon the median of all the pixel values. By using this median filter, noise is removed from fingerprint. The next step is histogram equalization. Histogram equalization is used to enhance the visualization effect by increasing the pixel size and is shown in Fig. 5b. DWT is determined mathematically, when the decomposition of the image into four different coefficients takes place. Out of the four, one is scaling function coefficient and the other three are wavelets coefficients (horizontal, vertical and diagonal). Thus 2D-DWT [24] is expressed as,
(1) y) (x, y)
f(x, MN
1 m.n) , (j
W j,m,n
1 N
0 y 1 M
0 x
0 0
y), (x, y)ψ
f(x, MN
1 m.n) (j,
W N 1 i
0 y 1 M
0 x i
ψ
j,m,n
where f(x, y) is the input image,W(j0,m.n),
W
i(
j
,
m
.
n
)
are the coefficients of image approximation which offer horizontal, vertical and diagonal details of image respectively. In this,W
i(
j
,
m
.
n
)
is the wavelet function used to decompose the image into number of levels. Thus multiresolution features of the original image are extracted directly from the wavelet decomposition coefficients. These decomposed values are extracted and combined. All the combined coefficients will give the feature values of a particular image. The decomposition is done by decimating the given image into two levels as lower value components and higher value components using down sampling method through Haar transform. The Haar transform is expressed as, otherwise 0 p (q)/2 z p 0.5)/2 (q 2 p 2 p 0.5)/2 (q z p 1)/2 (q 2 p 2 N 1 (z) pq h (z) k h (3)
For example, N=4, k, q, and p consider the values which are shown in Table 1.
(a) (b) (c)
Fig. 5(a). Input image, (b). Histogram equalization, (c) Wavelet output at level 2 decomposition
Table 1. Haar table
K P Q 0 0 0 1 0 1 2 1 1 3 1 2
When calculating DWT value, the approximated value and level of decomposition are considered. In this paper, the level of decomposition as 2 is considered, which implies J=2, where N=M=2J, so j=0, 1, 2…, J-1. The output of DWT is shown in Fig. 5c, with decomposition level as 2 with Haar transform.
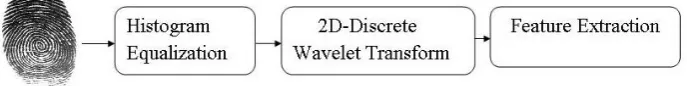
b) Key point extraction of finger knuckle print (FKP)
equalization is used to enhance the visualization effect by increasing the pixel size which is shown in Fig. 7b. The next step of feature extraction is to extract the key points from FKP using the SIFT [17].
Fig. 6. Feature extraction of finger knuckle print
Fig. 7(a). Input image of FKP, (b) Histogram equalization
The SIFT algorithm is mainly used for image matching purpose. SIFT is also used for detection and extracting local features of an image. The first step of SIFT process is to find the difference of Gaussian function convoluted with the FKP image on order to detect the key point locations which are invariant to scale change. The difference of Gaussian is calculated by Eqs. (4) and (5).
) , ( ) , , ( ) , ,
(x y G x y I x y
L (4)
) , ( ) , , ( ) , ( ) , , ( ) , ,
(x y G x y k I x y G x y I x y
D (5a)
) , , ( ) , , ( ) , ,
(x y L x y k L x y
D (5b)
The above equation I(x, y), G(x, y, σ), L(x, y, σ), and D(x, y, σ) represents the image, Gaussian function, scale-space of image and difference of Gaussian function respectively. The Gaussian function is calculated using Eq. (6).
2 2 2 )/2 ( 2 2 1 ) , , (
x y
e y
x
G (6)
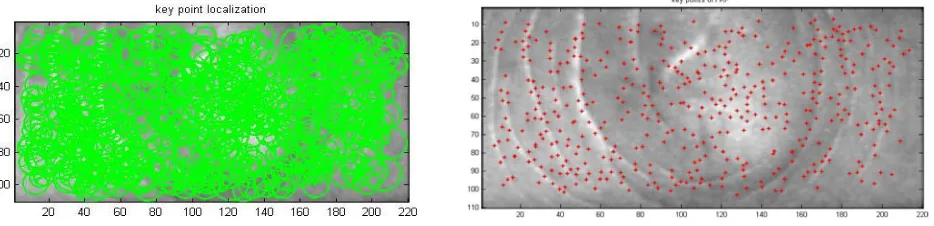
The next step is to detect the local maxima and minima of D(x, y, σ) by comparing each pixel value of FKP image with the neighbor pixel values. They are selected if the pixel value is higher or lower than the reference neighbor pixels. These localized key points are shown in Fig. 8a.These selected values are named key points. To eliminate the low contrast points along the edge of the image, Taylor’s expansion method is used. After applying the Taylor expansion, stable key points are selected and located by eliminating the low intensity pixel key points. The orientations of key points are assigned for the selected key points. The key points taken from the FKP is shown in Fig. 8b. The key points selected are scale invariant points.
4. FEATURE VALUES USING K-MEANS CLUSTERING ALGORITHM
Clustering is the process of grouping a non-linear set of objects. This approach assigns the database of n -objects into k-number of clusters (k < n). The main concept of this K-Means clustering approach is every object in the database must be located in any of the clusters or group, then every cluster must contain a minimum of one object. Then each cluster can be used to find a mean vector, according to this approach, it comes under the category of the centroid model. In this paper, K-Means clustering algorithm is used to find the set of minutiae and key points, which are stored as the feature values in database during enrollment process.
The minutiae and key points taken from the feature extraction process are clustered using this algorithm. Consider the points given as the input data vectors M = (m1, …, mn). The process of Fingerprint and FKP K-Means clustering algorithm is shown below [11]. K-Means clustering algorithm starts by initializing the first co-ordinate values as the centroid and defines the numbers of clusters to be split. Steps of K-Means clustering algorithm are given below:
Step 1: Feature extraction points and Key points are taken from fingerprint and FKP. Step 2: Initialize cluster and Centroid with feature extraction and Key points. Step 3: Find the distance between two points with centroid value.
Step 4: Assign number of clusters with minimum distance. Step 5: If (optimum number of clusters is reached) Calculate centroid and clusters
Else Go to step 2 End
According to the problem, this paper proposes the eight numbers of clusters to be defined for each biometric and these objects are assigned to each cluster initially. Then according to the initial centroid value, distance between centroid and key points are calculated using Euclidean distance Eq. (7). The minimum distance is retained in the updated distance matrix.
p
1 r j
2 k i r
1 j
2 k i 2 k
i m || [c(j)- m (j)] [c (j)- m (j)] c
|| (7)
The key points are grouped into new clusters until an optimum cluster is reached. When optimum cluster value is reached, there is no possibility of movements for the feature and key points to move on the next cluster. At optimum level, centroid value is also calculated.
5. MULTIMODAL BIOMETRIC ENROLLMENT AND VERIFICATION PHASE
This paper consists of two phases named multimodal biometric enrollment phase and verification phase. The overview of multimodal biometric enrollment phase is shown in Fig. 2. The multimodal biometric enrollment phase consists of the following steps:
The first step is to enhance input image of fingerprint and FKP by histogram equalization method simultaneously.
The next step is to extract the feature and key points from the enhanced fingerprint and FKP image. After extracting, the feature and key points from fingerprint and FKP are clustered using K-Means
clustering algorithm.
The centroid values calculated from K-Means clustering algorithm are converted into 128 bits of binary values from each biometric.
The next phase is multimodal biometric verification phase. The overview of multimodal biometric verification phase is shown in Fig. 3. The multimodal biometric verification consists of the following steps:
The process of generating 256 fused bits from fingerprint and FKP using K-Means clustering algorithm is the same as enrollment process.
The next step is to match the query 256 bits with the stored bits. The matching process is done by XOR operation. If both the bits are the same, XOR gives value as ‘0’, otherwise both the bits are different, XOR gives value as ‘1’.
The last step is to decide that, if all the 256 bits are zero, the user is genuine, else the user is impostor one.
6. EXPERIMENTAL RESULTS AND ANALYSIS
Experiments in this paper are conducted using the fingerprint database FVC 2004 [26]. This database consists of four sub databases, the first three sub databases are collected from various sensors, and the fourth sub database is generated synthetically. Each sub database consists of 80 fingerprint images. The details of each database are shown in Table 2. The followed experiments in this paper are conducted using the FKP database from FKPROI of Hong Kong Polytechnic University [25]. This database contains FKP images with its region of interest alone by cropping the outer surface image. This database consists of four sub databases; they are left index FKP, left middle FKP, right index FKP, and right middle FKP. Each sub database consists of 165 fingers of 12 images each. Totally, database consists of 660 folders of 7920 FKP images.
Table 2. FVC 2004 database details
Name of database Sensor type Image size Resolution
DB1 Optical sensor 640480 500 dpi
DB2 Optical sensor 328364 500 dpi
DB3 Thermal sweeping sensor 300480 512 dpi
DB4 SFinGe v3.0 288384 about 500 dpi
The output of fingerprint feature extraction is shown in Fig. 5. The fingerprint image is enhanced with histogram equalization, which is shown in Fig. 5b and 9a. The FKP image is also enhanced with histogram equalization, which is shown in Fig. 7b and 9b. The feature and key point’s extraction of fingerprint and FKP are shown in Fig. 5 and 8.
Fig. 9. Histogram equalization of (a) Fingerprint and (b) FKP
values of both biometrics are converted into 128 binary bits of each. The centroid value of K-Mean clustering for both finger print and FKP is shown in Fig. 10.
Fig. 10. K-Mean clustering graph for (a) Fingerprint points and (b) FKP points
For this paper, simulation is performed by 10 images of each database subset for both biometrics. For example, an enrollment and the verification phase output are taken from both biometric images of fingerprint and FKP is shown in Fig. 11. Table 3 consists of all parameters which are used in this paper to perform all the steps.
Fig. 11. Fused value of 256 bits and matched output
Table 3. Parameters used for multimodal biometric enrollment and verification phase using fingerprint and FKP Parameter Size No. of DWT level(Finger print) 2 level Haar decomposition
No. of key points (FKP) 430-545 points
K-Means clustering 8 clusters
Processing format Hex Decimal, Binary Fingerprint and FKP values 256 bits(128+128)
XOR comparison values 256 bits
Consider that SV (stored value) and QV (query value) on the database are to be compared. The MV (matched value) is the output of XOR operation of two different values. The MV is given by,
256
1
i XOR(SVi,QVi)
MV (8)
[25] [26]. The simulation of fingerprint and FKP has been performed in MATLAB environment. The execution time of each process is shown in Table 4.
Table 4. Execution time for enrollment and verification phase
In this paper, three methods are used to define the accuracy of the biometric systems. The first method is to compare the accuracy of system and this is done by number of iterations using K-Means clustering algorithm. If the number of iterations of K-Means clustering algorithm increases, then the accuracy of matching SV with QV is also increased. The optimum centroid value is achieved if the number of iteration increases, which is shown in Fig. 12. If optimum centroid value is reached, it is converted into 128 binary bits with optimum value, so the accuracy of recognition rate becomes very high.
Fig. 12. Accuracy of system by K-means algorithm
The second method is to evaluate G-S curve with the accuracy of Genuine Acceptance Rate (GAR) with number of bits (security) utilized in the system. The curve is obtained by varying the number of clusters using K-Means clustering algorithm and by using centroid bit conversion used in this system. Fig. 13 shows the performance of multibiometric system with varying number of bits. It is observed that, the security of the system is obtained with 99.5% of GAR at 128 bits. The security of the system increases with the increasing number of bits generated.
Fig. 13. G-S curve for the proposed system
Process Time(in Seconds)
Fingerprint feature values generation 3.20
FKP values generation 2.30
Fused values 0.53
The third method is to compare False Rejection rate (FRR) with GAR and False Acceptance Rate (FAR) is also considered. The GAR, FAR, FRR are calculated in the Eq. 9, 10 and11 respectively. If the number of feature points and key points are very high in fingerprint and FKP, then the GAR is high and the FRR becomes low. A number of tests are conducted to examine the performance of the proposed approach with the above factors. The results attained from the proposed approach are FRR=0.6%, GAR= 99.4% and FAR=0%
GAR=
attempts genuine
of no. Total
accepted attempts
genuine of
No. (9)
FRR=
attempts genuine
of no. Total
rejected attempts genuine
of
No. (10)
FAR=
attempts genuine
of no. Total
accepted attempts
impostor of
No. (11)
Finally, comparison of the proposed approach with other approaches is done. Karthik et.al [29] have proposed a scheme for securing the multibiometric templates using fuzzy vault approach. Fingerprint and iris were examined using MSU-DBI fingerprint and CASIA iris databases, achieving GAR=98.2% and FAR=0.01% with the security of 41 bits. Vincenzo Conti et al. [21] have used frequency based multibiometric system with fingerprint and iris. They have tested their experiments using FVC2002 and BATH for fingerprint and iris respectively, obtaining the result of GAR=94.29% and FRR=5.71. According to this proposed approach, the GAR is increased with more feature points, key points and with the maximum cluster size. Comparison of the proposed approach with the existing approach is shown in Table 5 and its ROC curves are shown in Fig. 14. The overall performance of this proposed approach is GAR=99.4% and FRR=0.6% with 128 bits security.
Table 5. Comparison for the proposed approach
Biometrics Algorithm Modality FAR (%) GAR (%) FRR (%)
Fingerprint+ IRIS
Fuzzy vault based approach [27]
Multimodal biometric system
0.01 98.2 1.8
Fingerprint
+IRIS Frequency based approach [14] Multimodal biometric system 0 94.29 5.71 Fingerprint
+FKP K-Means clustering algorithm (Proposed) Multimodal biometric system 0 99.4 0.6
7. CONCLUSION
This paper presents a method of multimodal biometric systems based on the fingerprint and FKP using K-Means clustering algorithm. For an ideal multibiometric system, the value of GAR has to be 100% and FRR has to be nil. Due to many reasons like acquiring image from the sensor, feature extraction process, matching process etc, 100% accuracy of recognition cannot be achieved. So in order to improve the recognition accuracy, this paper proposes the generation of 128 bits binary values from fingerprint and FKP simultaneously. The two 128 bits are concatenated and stored in database. This fusion values of 256 bits are matched with fused value of query input image with XOR operation and then whether the user is genuine or an impostor is decided. Based on this research work, the authentication is done by integrating the fingerprint and FKP with feature fusion. The proposed multibiometric system provides authentication and security using K-Means clustering algorithm with GAR = 99.4%, FRR = 0.6% and FAR = 0% with security of 128 bits for each modality. These results are obtained by using the PolyU FKP database and FVC 2004 fingerprint database.
Acknowledgment: The authors gratefully acknowledge the management of Kalasalingam University, Krishnankoil, Tamilnadu, India, for the facilities provided to carry out this research work.
REFERENCES
1. Anil, K. Jain, Ross, A. & Pankanti, S. (2006). Biometrics: A tool for information security. IEEE Transactions on Information Forensics and Security, Vol. 1, No. 2, pp. 125-143.
2. Kumar, A. & Zhang, D. (2010). Improving biometric authentication performance from the user quality. IEEE Transactions on Instrumentation and Measurement, Vol. 59, No. 3, pp. 730-735.
3. Kumar, A. & Passi, A., (2010). Comparison and combination of iris matchers for reliable personal authentication. Pattern Recognition, Vol. 23, No. 3, pp. 1016–1026.
4. Kumar, A. & Venkata Prathyusha, K. (2009). Personal authentication using hand vein triangulation and knuckle shape. IEEE Transactions on Image Processing, Vol. 18, No. 9, pp. 2127-2136.
5. Miguel, A. Ferrer, Carlos, M. Travieso & Jesus, B. Alonso, (2006). Using hand knuckle texture for biometric identifications. IEEE Aerospace & Electronics Systems Magazine, Vol. 43, No. 6, pp. 23-27.
6. Uludag, U., Pankanti, S., Prabhakar, S. & Anil, K. Jain, (2004). Biometric cryptosystems: Issues and challenges.
Proceedings of IEEE, Vol. 92, No. 6, pp. 948-960.
7. Nandakumar, K., Anil, K. Jain & Pankanti, S. (2007). Fingerprint-based fuzzy vault: Implementation and performance. IEEE Transactions on Information Forensics and Security, Vol. 2, No. 4, pp. 744-747.
8. Jiang, Li. (2004). Wavelet-based feature extraction for improved end member abundance estimation in linear unmixing of hyper spectral signals. IEEE Transactions on Geo science and Remote Sensing, Vol. 42, No. 3, pp.
644-649.
9. Roberto, K. H. Galvao & Yoneyama, T. (2004). A competitive wavelet network for signal clustering. IEEE Transactions on Systems, Man, and Cybernetics—Part B: Cybernetics, Vol. 34, No. 2, pp. 1282-1288.
10. Yang,G. P., Zhou, G. T., Yin, Y. & Yang, X. (2010). K-means based fingerprint segmentation with sensor interoperability. EURASIP Journal on Advances in Signal Processing, Vol. 2010, Article ID: 729378, pp. 1-12.
11. Liu, M., Jiang, X. & Kot, A. C. (2007). Efficient fingerprint search based on database clustering. Pattern Recognition, Vol. 40, No. 6, pp. 1793–1803.
12. Zhang, L., Zhang, L., Zhang, D. & Zhu, H. (2011). Ensemble of local and global information for finger– knuckle-print recognition. Pattern Recognition, Vol. 44, No. 9, pp. 1990–1998.
14. Zhang, L., Zhang, L., Zhang, D. & Zhu, H. (2010). Online finger-knuckle-print verification for personal authentication. Pattern Recognition, Vol. 43, No. 7, pp. 2560–2571.
15. Zhang, L., Zhang, L. & Zhang, D. (2009). Finger-knuckle-print: A new biometric identifier. International Conference on Image Processing. Cairo, pp.1981–1984.
16. Zhang, L., Zhang, L., Zhang, D. & Guo, Z. (2012). Phase congruency induced local features for finger-knuckle-print recognition. Pattern Recognition, Vol. 45, No. 7, pp. 2522–2531.
17. David, G. Lowe, (2004). Distinctive image features from scale-invariant key points. International Journal of Computer Vision, Vol. 60, No. 2, pp. 91–110.
18. Badrinath, G. S., Nigam, A. & Gupta, P. (2011). An efficient finger-knuckle-print based recognition system fusing SIFT and SURF matching scores. Proceedings of 13th International Conference on Information and Communications Security, Beijing, china, pp. 374-387.
19. Zhu Le-Qing, (2011). Finger knuckle print recognition based on SURF algorithm. Eighth International Conference on Fuzzy Systems and Knowledge Discovery, Shanghai, pp. 1879-1883.
20. Sim, T., Zhang, S., Janakiraman, R. & Kumar, S., (2007). Continuous verification using multimodal biometrics.
IEEE Transaction on Pattern Analysis and Machine Intelligence, Vol. 29, No. 4, pp. 687–700.
21. Conti, V., Militello, C., Sorbello, F. & Vitabile, S. (2010). A frequency-based approach for features fusion in fingerprint and iris multimodal biometric identification systems. IEEE Transactions on Systems, Man, and Cybernetics—Part C: Applications and Reviews, Vol. 40, No. 4, pp. 384-395.
22. Md. Maruf Monwar & Marina, L. Gavrilova, (2009). Multimodal biometric system using rank-level fusion approach. IEEE Transactions on Systems, Man, and Cybernetics—Part B: Cybernetics, Vol. 39, No. 4, pp.
867-878.
23. Ross, A. & Anil, K. Jain, (2003). Information fusion in biometrics. Pattern Recognition Letters, Vol. 24, pp.
2115–2125.
24. Rafael, C. Gonalez & Richard, E. Woods, (2012). Digital image processing. Pearson Education, 3rd edition.
25. Poly U FKP, Database: http: // www. comp. polyu. edu. Hk / ~ biometrics/FKP.htm. 26. Fingerprint Verification Competition: FVC2004. http://bias.csr.unibo.it/fvc2004/.
27. Rabbani, H. & Vafadoost, M., (2006). Wavelet based image denoising based on a mixture of laplace distributions. Iranian Journal of Science & Technology, Transaction B, Engineering, Vol. 30, No. B6, pp.
711-733.
28. Eftekhari, M. & Eghbali, H. J. (2006). Digital image filtering in wavelet domain using genetic programming.
Iranian Journal of Science & Technology, Transaction B, Engineering, Vol. 30, No. B6, pp. 701-710.
29. Nandakumar, K. & Anil K. Jain, (2008). Multibiometric template security using fuzzy vault. 2nd IEEE International Conference Biometrics: Theory, Applications and Systems, (BTAS 2008), Arlington, VA, pp.1-6.