*
E-mail:[email protected]
Geomorphometric Analysis of Maroon
River by Digital Elevation Model
Mumipour, Mehdi
Dept. of Environment, Faculty of Natural Resources Khoramshahr University of Marine Science and Technology, Khoramshahr, IR Iran
Received: November 2015 Accepted: March 2016
© 2016 Journal of the Persian Gulf. All rights reserved.
Abstract
Digital Elevation Models (DEMs) are used to estimate different morphologies, analysis of river profile, delineating drainage basin and drainage pattern associated with lithological and structural changes. The study area is Maroon River located in Khuzestan Province, Iran. In this study geomorphometric analysis based on DEM carried out to understand Maroon river uplift rate and tectonic- erosion relationships in its catchment. Geomorphic processes, such as stream length gradient, Hypsometric Integral, Isobase map, Incision map and concavity of the river were extracted from digital elevation model. Slope- Area plot was used for analysis of uplift rate and stream power of the river. Results show that the changes in stream length (SL) are because of lithological change in the study area. More erodible lithologies cause low SL values. Isobase map of the study area was obtained by relating drainage network and topographic surface. Isobase map delineate structural and lithological erosional processes. Hypsometric integral and hypsometric curve of the Maroon River catchment indicates a old catchment, so erosion is more effective in landscape evolution than tectonics. Uplift rate map of Maroon River shows different rates in upstream and downstream of the river. Concavity and Steepness indices were obtained using stream profile analysis and by using power function, uplift rate is calculated. Logarithmic regression of the area and slope values of the Maroon River lead to calculating concavity and steepness values. It is concluded form this investigation that erosional condition is more powerful in the study area.
Keywords: Geomorphometric Analysis, Maroon River, DEM, Uplift Rate
1. Introduction
In regions with active tectonic, the geometry and evolution of river systems are sensitive to surface uplift rate (Clark et al, 2004). Zagros simply folded belt developed during late Cenozoic (Mobasher, 2007) and is still active as is affected by tectonic activity of Arabian- Iranian plate boundary shortening processes, as wide spread seismic activity
in this region is an evidence (Berberian and King, 1981). In a tectonically active region, geomorphic markers, such as alluvial fans, multiple river terraces and some other geomorphic features are essential as a reference frame for gauge deformations (Tsai and Sung, 2003). Stream profile analysis is more stable parameter in tectonic studies rather than river terraces. By using digital elevation models (DEMs) such analyses become more easy, fast and precise.
Geomorphic responses to tectonic uplift provide (Marine Science)/Vol. 7/No. 23/ March 2016/13/25-38
key insights on mountain belt evolution and landscape
morphology (Whipple, 2004). In this study, tectonic-
erosion setting of Maroon River catchment is
investigated based on geomorphometric analysis of
DEM. Some parameters, such as stream length
gradient (SL), Hypsometric Integral (HI), Isobase
map, Concavity, Steepness and uplift rate of the main
stream are calculated and tectonic setting of the study
area is discussed. The aims of this study are to find out
Maroon River uplift rate and discuss the tectonic-
erosion setting of the study area.
2. Material and Methods
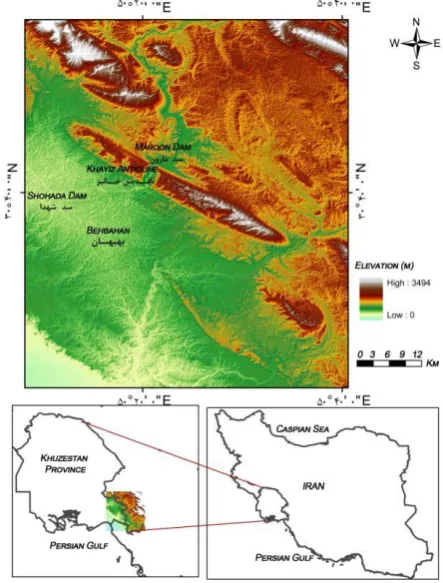
The study area is located between 30° 30´ N and 30° 55´ N latitudes, and 50° 00´ E and 50° 30´ E longitudes, in the southwestern Zagros simply folded Belt (ZSFB) in southwestern Iran (Fig. 1). The Zagros Mountain range hosts more than half of the world’s known hydrocarbon reserves (Sepehr and Cosgrove 2005). Compressional tectonic forces have led to folding, thrusting, and large-scale strike-slip faulting and significant crustal shortening in the Zagros Mountains. The basement has gone through an extensional tectonic event during the Precambrian before the deposition of the Cambrian sediments (e.g., Stocklin 1968, Berberian and King 1981, Berberian 1995).
The compressional Zagros orogeny formed a variety
of asymmetric, NW-SE trending, en-echelon folds, and
NE-dipping thrusts on the southwestern limbs of the
folds. Fold axial planes generally dip to N-NE, so that
the southern limbs of the folds are steeper, and in some
cases they are overturned or vertical (Mobasher 2007).
In this study, morphometric indices are used as
indicators of landscape response to tectonic activity
or erosion processes. Shape and structure of the
drainage constitute a response to the uplift process,
more or less modulated by lithologic condition of the
area (Jackson and Leeder, 1994). In this research,
morphometric data are not statistically analyzed, but
are spatially analyzed in order to reveal spatial
relationship between geomorphometric parameters
and tectonic- erosion and uplift rate of the study area.
The main material for this study is digital elevation
model (DEM). Wide ranges of DEMs are available,
from global to local scales. ASTER GDEM (Advanced
Spaceborne Thermal Emission and Reflection
Radiometer (ASTER) Global Digital Elevation Model)
was used here, with horizontal spatial resolution of
about 30 meters a vertical resolution of about 7 meters.
Delimitation of the morphological units was performed
by threshold application on slope and azimuthal maps
derived from DEM and confirmed by conformation
with hydrographic network and associated drainage
basin automatically derived from DEM (Delcaillan et
al, 2006). These data are used to calculate various
morphometric indices. Table 1 summarizes the indices
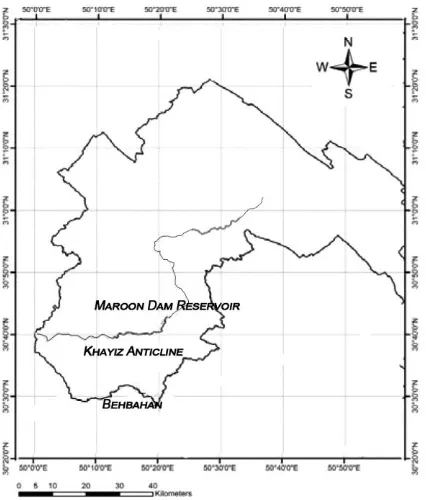
that used in this study. Figure 2 shows Maroon basin
boundary that HI parameters are calculated according
to this area.
Fig. 1: The study area location on Iran
Table 1: Geomorphometric indices that used in this study
Indices symbol formula Reference
Stream Length Gradient SL Hack (1973)
Hypsometry Integral HI Strahler (1952)
Isobase map - Discussed in the text Cox & Rosenthal (1993) Concavity - Discussed in the text Shahzad and Gloaguen
(2011)
Steepness - Discussed in the text Shahzad and Gloaguen (2011)
Uplift Rate - Discussed in the text Shahzad and Gloaguen (2011)
Fig. 2: Maroon basin boundary
Drainage network was ordered according to strahler (1952). Longitudinal profile of the main river is used for identifying breaks in slope. Such knickpoints then are used as indicator of uplift and to divide two parts with different uplift rates.
TecDEM (Tectonics from Digital Elevation Model) is a MATLAB toolbox that uses Global DEMs. DEMs are replacing traditional topographic maps in geosciences and provide us the automatically extracted drainage networks. Because of rapid response of drainage to tectonic changes, thus it is a potential parameter for tectonic analysis. DEMs provide an opportunity to quantify the influence of neotectonic
processes on landscape development (Shahzad and Gloaguen 2011a, 2011b). It first extracts the drainage network using Deterministic-8(D8) algorithm. D8 algorithm is the most convenient and widely used method to extract drainage network (Hogg et al., 1997; Maidment, 1993).
2.1. Processing of SL Map using GIS
Anomalies of stream profiles, especially knickpoints, are important for studying tectonic impacts on fluvial landforms. Studies on knickpoints and other slope break indices mostly use discrete data representation.
Some authors have tried to make contours of SL values to detect anomalies of stream profiles, whereas others have tried to connect SL values to geological objects. This study is innovative because its result is a map showing SL anomalies along the main rivers of a watershed. It can highlight zones with high values of SL which will be interpreted in terms of differential erosion, or tectonic activity.
Generally, the values needed to compute SL are measured from topographic profiles. Instead of a commonly used method for calculating a slope map from a DEM using a moving window, we computed slope using contour lines derived from a DEM. The contouring method averages out much of the vertical noises included in many available DEMs, particularly in steep and narrow watersheds.
2.2. The stream Power Law
Deviations from the typical concave-up shape of stream longitudinal profiles, such as knickpoints or convex segments, indicate a disequilibrium state resulting from tectonic, base level or lithological perturbations (Kirby and Whipple, 2004; Chen et al., 2003; Pedrera et al., 2009; Font et al., 2010). The normalized steepness index (ksn) is widely used to investigate tectonically induced perturbations in river longitudinal profiles and has been used to propose patterns of uplift (Kirby and Whipple, 2004; Wobus et al., 2006; Whittaker et al., 2008). The lithological or structural contrasts force the streams to reach a new equilibrium condition. Mathematically, this is written in below equation:
n m S KA U E U dt
dz
(1)
which U and E are uplift and erosion rates, respectively. K is erosion efficiency factor which is related to sediments and rock strength directly, A is upstream drainage area and S is channel slope. The constants m and n are dependent on basin hydrology, hydraulic geometry and erosion process. dz/dt is the rate of changing elevation within specific time. So,
if landscape is in steady-state condition, then it is equal to 0. Thus for steady state equilibrium, equation 2 can be written as:
n m n A K U S 1
(2)
Where m/n is the concavity of the profile and coefficient K is steepness of the profile. So, it can be written as:
K
A
S
s (3)which θ and ks are concavity and steepness indices, respectively. They can be calculated directly using regression analysis of data as shown in equation 2, i.e., area and slope (Howard 1994, Snyder et al. 2000, Whipple 2004, Wobus et al. 2006). By combining equations 1 and 2, a useful relationship for calculating uplift rates is presented below:
K
k
U
snn(4)
which ksn is normalized steepness index. This equation gives uplift rate for the area with steady state landscape by choosing appropriate values of m, n and K. after logarithmic regression, analysis of area and slope values, concavity and steepness values were calculated and by using their values in equation 3, uplift rate is calculated. Constant values of n and K is obtained from previous studies (Seidl and Dietrich 1992, Wobus et al. 2006). Because of importance of knickpoint selection in understanding landscape responses to tectonics, these points were selected in stream longitudinal profile based on change in slope and concavity.
2.3. Basin Hypsometry
The hypsometric curves have been used to infer the
stage of development of the drainage network and also it is a powerful tool to differentiate between tectonically active and inactive areas (Keller and
Pinter, 2002). The curve is created by plotting the proportion of total basin height against the proportion of total basin area (Figure 3).Convex hypsometric
curves characterize young slightly eroded regions; S
shaped curves characterize moderately eroded regions; concave curves point to old, highly eroded regions. In the present study, all basins are automatically processed to calculate Basin hypsometry using TecDEM. The simplest way to characterize the shape of hypsometric curve for a given drainage basin is to calculate its hypsometric integral (HI).
The HI shows the distribution of landmass volume remaining beneath or above a basal reference plane (Strahler, 1952; Schumm, 1956). This index proved as an efficient factor in evaluating the response of
landscapes to active tectonics (e.g., Pérez-Peña et al., 2009; Mahmood and Gloaguen, 2012; Andreani et al., 2014; Domínguez-González et al., 2015). In theory, hypsometric integral value ranges between 0 and 1. Low hypsometric integral values indicate old and more eroded areas and evenly dissected drainage basins. High values of the hypsometric integral value indicate that most of the topography is high relative to the mean, such as a smooth upland surface cut by deeply incised streams indicating young and less eroded areas.
Fig. 3: SL values of Maroon River in the study area, a) SL values in longitudinal profile, b) SL values as shown on DEM map.
2.4. Isobase Map
The spatial distribution of stream height (isobase map) is a useful proxy for investigating geologic or tectonic processes (e.g., Dury, 1952; Filosofov, 1960; Golts and Rosenthal, 1993; Grohmann et al., 2007, 2011). Drainage networks are commonly organized according to Strahler (1957) stream order. According to Golts and Rosenthal (1993) streams of similar orders are of similar geological age and are related to similar geological events. Hence the interpolation of isobase lines, which connect streams with a similar order, produce a surface resulting from the same erosional events. Isobase lines represent erosional surfaces which have formed due to recent tectonic and erosional events (Filosofov, 1960). Studies suggest that Isobase maps are prepared by interpolating the elevation at the location of 2nd and 3rd order streams (Golts and Rosenthal, 1993; Grohmann, 2004). Sharp changes in the isobase map indicate the possible location of faults and/or lithological contrasts.
As suggested by Grohmann et al. (2011), isobase maps can be seen as a smoothed version of the original topographic surface, from which was removed the “noise” of the first Strahler order stream erosion. Sharp topographic changes affecting an isobase surface were used to infer potential structures or uplifted blocks associated with tectonic movements (e.g., Golts and Rosenthal, 1993; Grohmann et al., 2007; Garrote et al., 2008; Domínguez-González et al., 2015).
2.5. Incision Map
The Incision map shows relative or local relief and is a tool for quantifying relative elevation. It is calculated by measuring the difference between the maximum and minimum elevation in a moving window. The calculation of relative relief is influenced by the shape and size of the moving window and is a well documented problem (Ascione
et al., 2008). The moving window should be large enough to include at least two major ridges and/or valleys otherwise the results will not represent local relief but simply the slope gradient (Evans, 1972). Moving window is 10*10 km in this study and results are shown in figure 6.
3. Results and Discussion
The generation of maps that reveal some surface dynamics parameters by using TecDEM is a tool for analysis of tectonic influence on geomorphological pattern of the study area. These types of analyses are especially suitable in regions with drainage network anomalies and relief pattern discontinuities (Gloaguen et al., 2007, 2008; Kurz et al., 2007).
Values of the SL index over the study area, determined from digital elevation models and geographic information system (GIS), are shown on Fig. 3. In order to discriminate values at the index related to rock resistance, different levels of average rock strength were defined (by rock type and field observation) from very low strength (silt, sand and marl), low strength (older alluvial fan deposits and fairly well-consolidated conglomerate), moderate strength (fillite and schist), high strength (calcareous sandstone, travertine, and conglomerate), and very high strength (marble). Based upon the quantitative SL indices linked to relative rock resistance described above with field observations suggest that: 1- Along the southern part of the Maroon River, values of the SL index show a variable distribution. The highest and perhaps most anomalous values of the index are along the Maroon River on its pass from Khayiz anticline. These high indices are not associated with particularly resistant rocks, so is interpreted to be a tectonic signal. Several locations along the western flank of the Khayiz anticline also have anomalously high SL index values on relatively soft rocks.
2- Along the NE portion of the study area, SL indices tend to be relatively low compared with the other
parts. Anomalous values of the indices are related to outcrops of the resistant massive limestone found along the river profile.
Hypsometry analysis is based on investigating the shape of basin hypsometric curves which vary from concave to convex. Hypsometric plot of the Maroon river basin is shown in Figure. 4. Hypsometric integral of the Maroon river basin is about 0.22 that means this basin is an old basin. Analysis suggest that as th basin is in old stage, so erosion processes are more influent that tectonic ones.
Fig. 4: Hypsometric curve and Hypsometric Integral Values for Maroon River basin
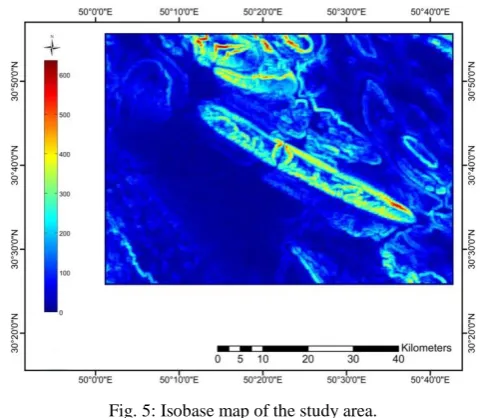
The analysis of surface dynamics parameters such as Isobase, Incision and vertical dissection maps provides insight into the tectonic geomorphology of the study area. These parameters might reveal major tectonic features. The Isobase map of the study area (Fig. 5) which shows the location of 2nd and 3rd order streams is changable. Changes in the relative position of 2nd and 3rd order streams at high or low relief correlates with some of the tectonic features, e.g. Main Boundary Thrust and linear features. Other minor changes in the Isobase map might be related to residual morphotecronic features in the study area.
The isobase map, constructed based on second and higher order drainages, allowed depiction of the
features controlled by recent structures as an inflexion in the fault line area or a lineament (Fig. 5). As a first analysis, it shows three large domains in the study area: High (A), Medium (B) and Low (C. High isobase values occur in the central-southern portions of the area and include mainly carbonate rocks. Medium values occur in the central-west part of the area, over sedimentary rocks. Low isobase values occur over alluvium deposits of the Quaternary formation. The main morphological difference between the isobase and the original topographic surface is the removed of the noise of the low- order streams, which allows the identification of possible tectonic influence.
Fig. 5: Isobase map of the study area.
The incision map or local relief is used to identify regions of high gradients (Guzzetti and Reichenbach, 1994). The incision map of the study area was also prepared using a moving window of 1 km2 and again shows steep changes to the west of the Khayiz. This map also shows a series of sharp changes in the NW side of the study area, which is related to the EW-trending series of lineaments. Using the incision map these lineaments can be further traced to prepare a more detailed neotectonics map of the study area (Fig. 6). As can be seen on the map, incision is high on NE part of the study area, which is mainly composed of sedimentary rocks with medium erodibility. Low altitude parts of the area have less incision value.
Fig. 6: Incision map of the study area.
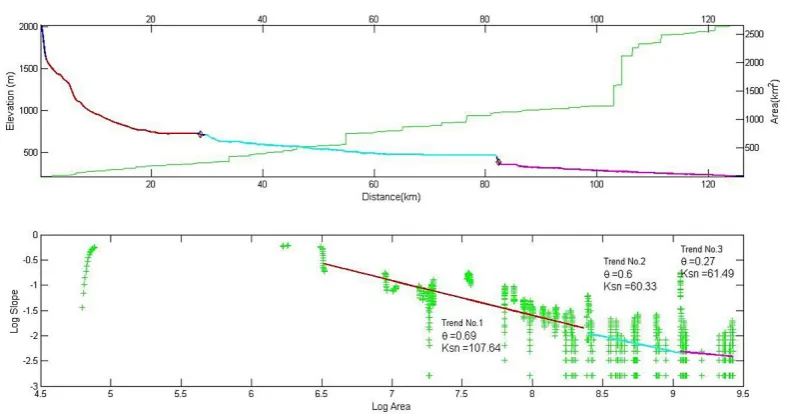
The Maroon River is studied using stream power
law (Fig. 7 and Fig 9). The analysis is discussed here
in detail. The stream profile analysis of the Maroon
river is shown in figure 8. This is a three segment
stream. Two knickpoints shows tectonic activity. All
knickpoints show the presence of local faults. Three
trends observed in this stream based on morphologic
conditions, i.e., an upper segment, middle segment
and lower segment. The upper segment passed on
relict landscape with steepness index 107.64 and
uniform concavity index 0.69, which means that it
suffer less erosion. The middle segment shows
intermediate concavity 60.33 and steepness 0.6,
which means that erosion process are active. The
lower segment suggests lower concavity and
steepness indices, i.e., 0.27 and 61.49 respectively.
As the stream go down, the sharp change in the
geomorphic indices shows gradual changes in
lithology and tectonic activity. The northern part of
the region has low steepness values and because
steepness is directly related to uplift rate it means
that region undergone less deformation processes on
northern section, compared to other parts. Figure 8
shows correlation between geologic formations and
faults locations to SL values.
The evolution of landscapes results from complex interactions between climatic and tectonic processes (e.g., Willett and Brandon, 2002; Ferrater et al., 2015). Recent tectonic or climatically induced base-level fall are associated with the propagation of an erosion wave, which represents the limit between an upper-relict landscape and a lower adjusting zone (e.g., Pérez-Peña et al., 2015). As a result, relict portions of landscapes (i.e., where uplift is not yet counterbalanced by fluvial erosion) may persist though time (e.g., Burbank and Anderson, 2012; Clark et al., 2005; Legrain et al., 2014; Giletycz et al., 2015).
Fig. 7: Slope- Area plot of the study area.
Fig. 8: Lithologic and Faults map of the study area showing SL values.
Fig. 9: Uplift rate map of Maroon River
3.1. Upstream Impacts of Dam Implementation
Geomorphological adjustments upstream of a dam are primarily concerned with sedimentation due to trapping of sediment within the reservoir. A reservoir leads to hydraulic conditions that reduces the flow velocity to near zero, so any sediment transported to the reservoir will settle out (Petts, 1984; Brierley and Fryiers, 2005). The settling out and deposition of sediments results in trapping a large amount of sediment. In addition, the formation of delta deposits may occur in the upstream channel as a result of deposition of coarse materials at the upstream end of the reservoir. This ultimately will reduce the river channel capacity (Wang and Hu, 2004; Brierley and Fryiers, 2005).
As a result of degradation and aggradations, geomorphological adjustments can take place in channel cross section and capacity, slope, plan form and bed form. Changes in channel cross section and capacity occur through adjustments in width and depth. Erosion of the bed and bank will increase depth and width of the channel, respectively. This leads to enlarging cross section area and capacity of the river (Petts, 1979; Schumm, 2005). In contrast, deposition of material will reduce cross section area and capacity of the river. Julien (2002) describes the slope adjustments in rivers in order to reach equilibrium between water discharge and sediment yield. Degradation lowers and flattens the slope, so the river erosion is reduced. In contrast, aggradation generally increases the slope as the river aims to increase its competence (Julien, 2002; Gordon and Meentemeyer, 2006). Plan form changes may also occur below dams as a result of erosion and depositon processes. It has been stated that erosion and degradation below dams will transform braided rivers to straight or sinuous river. However, meandering river may experience little changes in width, but migration rate will be reduced (Shields et al., 2000; Wang and Hu, 2004). The aggradation of river due to sediment availability that flow power is
unable to transport it; lead to disruption and filling of pools along with the formation of bars, berms and lag deposits. These structures may be destroyed during degradation and erosion (Bierley and Fryiers, 2005).
Despite the range of adjustments that may occur, the implementation of a dam may do not lead to geomorphological changes. For example, if the discharge released is incompetent to erode and redistribute the existing river boundary, then neither erosion nor deposition takes place. So, the flow will accommodated within the pre existing channel and no adjustments observed (Petts, 1979; Knighton, 1998; Gilvear, 2004).
Conclusions
The SL index describes the morphology of a stream network based on the distribution of the slope gradients along rivers. This work has discussed whether it is sensitive enough to detect the impact of different uplift rates on the drainage network. The SL map has provided the following implications: 1- SL values are significantly influenced by bedrock lithology, such as differences in erodibility, 2- Significant variations in SL values are associated with fault zones. This study shows that mapping SL from a DEM, instead of using topographic profiles, helps to understand the geomorphological impacts of differential uplift. This approach may be effective for other areas with potential influence of differential uplift. Base-level analysis has been successfully applied to semi-detail scale morphotectonic studies in the past. In this paper, we presented an example of the applicability of the method to regional-scale investigations. The base-level map constructed with 2nd and 3rd-order valleys was considered to present the best results and used for the interpretation of regional-scale morphostructures. The method provided results consistent with the scale of the data used as topographic base and with the drainage network. Geomorphological changes don not occur immediately, but a lag time exists between changes
to the first order and those of the second order and also between phases of adjustment before reaching quasi-equilibrium. In this case, no geomorphological changes is observed in Maroon River before and after dam construction. But, these changes may occur later in an extended time scale. The prediction of potential geomorphological changes is not a simple process, because multiple adjustments can take place.
References
Andreani, L., Stanek, K. P., Gloaguen, R., Krentz, O., and Domínguez-González, L. , 2014: DEM-based analysis of interactions between tectonics and landscapes in the Ore Mountains and Eger Rift (East Germany and NW Czech Republic), Remote Sensing, 6 (9): 7971–8001, doi:10.3390/rs6097971 Ascione, A., Cinque, A., Miccadei, E., Villani, F., Berti, C., 2008. The Plio-Quaternary uplift of the Apennine chain: new data from the analysis of topography and river valleys in Central Italy. Geomorphology 102 (1): 105–118
Berberian, M. and King, G.C., 1981. Towards a Paleogeography and Tectonic Evolution of Iran. Canadian Journal of Earth Sciences, 18 (2):. 210-265 Berberian, M., 1995. Master “Blind" thrust faults
hidden under the Zagros folds: Active basement tectonics and surface morphotectonics. Tectonophysics 241 (3-4):. 193-224
Brierly, G.J. and Fryiers, K.A. 2005, Geomorphology and River Management: application of the river style framework, Blackwell, Oxford, 415P.
Burbank, D. W. and Anderson, R. S., 2012. Tectonic Geomorphology, Blackwell Science, Cambridge, 316P.
Chen, Y.-C., Sung, Q., and Cheng, K.-Y. , 2003. Along-strike variations of morphotectonic features in the Western Foothills of Taiwan: tectonic implications based on stream-gradient and hypsometric analysis, Geomorphology, 56 (1-2): 109–137
Clark, M. K., M. Schoenbohm, L. H. Royden, K. X. Whipple, B. C. Burchfiel, X. Zhang, W. Tang, E.
Wang, L. Chen, 2004, Surface uplift, tectonics, and erosion of eastern Tibet from large-scale drainage patterns, Tectonics, 23 (1), DOI: 10.1029/ 2002TC001402
Domínguez-González, L., Andreani, L., Stanek, K. P., and Gloaguen, R., 2015. Geomorpho-tectonic evolution of the Jamaican restraining bend, Geomorphology, 228: 320–334
Dury, G. H. 1952: Map Interpretation, Sir Isaac Pitman & Sons, Ltd, London, UK.
Evans, I.S., 1972. General geomorphometry derivatives of altitude and descriptive statistics. In: Chorley, R.J. (Ed.), Spatial Analysis in Geomorphology. Harper and Row, London, pp. 17–90.
Filosofov, V.P., 1960. Brief Guide to Morphometric Methods in Search of Tectonic Features. Saratov University Publishing House, Saratov, Russia (in Russian).
Font, M., Amorese, D., and Lagarde, J. L., 2010. DEM and GIS analysis of the stream gradient index to evaluate effects of tectonics: the Normandy intraplate area (NW France), Geomorphology, 119 (3-4): 172–180
Garrote, J., Heydt, G.G., Cox, R.T., 2008. Multi-stream order analyses in basin asymmetry: a tool to discriminate the influence of neotectonics in fluvial landscape development (Madrid Basin, Central Spain). Geomorphology 102 (1): 130–144. Gilvear, D.J. 2004, Patterns of channel adjustment to impoundment of the upper river Spey, Scotland (1942-2000), River Research and Application, 20 (2): 151-165
Gloaguen, R., Marpu, P.R., Niemeyer, I., 2007. Automatic extraction of faults and fractal analysis from remote sensing data. Nonlinear Processes in Geophysics 14 (2): 131–138.
Gloaguen, R.,Kaessner, A.,Wobbe, F., Shahzad, F.,Mahmood, S.A., 2008. Remote sensing analysis of crustal deformation using river networks. In: Proceedings IEEE Interna- tional Geosciences and Remote Sensing Symposium, Boston, USA, pp. IV-1–IV-4.
Golts, S., Rosenthal, E., 1993. A morphotectonic map of the northern Aravain Israel, derived from isobase lines. Geomorphology 7 (4), 305–315. Gordon, E. and Meentemeyer, R.K. 2006, Effects of
dam operation and landuse on stream channel morphology and riparian vegetation, Geomorphology, 82 (3-4): 412-429
Grohmann, C. H., Riccomini, C., and Chamani, M. A. C., 2011. Regional scale analysis of landform configuration with baselevel (isobase) maps, Hydrol. Earth Syst. Sci., 15, 1493–1504, doi: 10.5194/ hess-15-1493-2011.
Grohmann, C.H., 2004. Morphometric analysis in geographic information systems: applications of free software GRASS and R. Computers & Geosciences 30 (9–10): 1055–1067.
Grohmann, C.H., Riccomini, C., Alves, F.M., 2007. SRTM-based morphotectonic analysis of the Pocos de Caldas Alkaline Massif, southeastern Brazil. Computers & Geosciences 33 (1): 10–19. Hack, J. T., 1973, Stream profile analysis and
streamgradient index, J. Res. U.S. Geol. Surv., 1 (4): 421 –429.
Hogg, J., J.E. McCormack, S.A. Roberts, M.N. Gahegan and B.S, Hoyle, 1997. Automated derivation of stream-channel networks and selected catchment characteristics from digital elevation models. In: P.M. Mather, Editor, Geographical Information Handling: Research and Applications, Wiley, Chichester, pp. 211–235. Howard, A.D., 1994. A Detachment-limited Model
of Drainage Basin Evolution. Water Resources Research 30 (7):. 2261-2285.
Julien, P.Y. 2002, River Mechanics, Cambridge University Press, Cambridge, 434 P.
Keller, E.A., Printer, N., 2002. Active Tectonics: Earthquakes, Uplift and Landscape, 2nd ed. Prentice Hall, Upper Saddle River. 362 P.
Kirby, E., and K. X. Whipple, 2001, Quantifying differential rock-uplift rates via stream profile analysis, Geology, 29 (5): 415 – 418.
Knighton, D. 1998, Fluvial Forms and Processes: a
New Perspective, Arnolds, London, 400 P.
Kurz, T., Gloaguen, R., Ebinger, C., Casey, M., Abebe, B., 2007. Deformation distribution and type in the Main Ethiopian Rift (MER): a remote sensing study. Journal of African Earth Sciences 48 (2–3): 100–114.
Mahmood, S. A. and Gloaguen, R., 2012: Appraisal of active tectonics in Hindu Kush: Insights from DEM derived geomorphic indices and drainage analysis, Geosci. Front., 3 (4): 407–428, doi: 10. 1016/j.gsf.2011.12.002
Maidment, D.R., 1993. GIS and hydrologic modeling. In: Goodchild, M.F., Parks, B.O., Steyaert, L.T. (Eds.), Environmental Modeling with GIS. Oxford University Press, New York, pp. 147–167.
Mobasher, K., 2007. Kinematic and Tectonic Significance of the fold and fault related fracture systems in the Zagris Mountans, Southern Iran, Ph.D. Thesis, Georgia State University, Georgia Pedrera, A., Pérez-Peña, J. V., Galindo-Zaldívar, J.,
Azañón, J. M., and Azor, A. , 2009. Testing the sensitivity of geomorphic indices in areas of low-rate active folding (eastern Betic Cordillera, Spain), Geomorphology, 105 (3-4): 218–231 Pérez-Peña, J. V., Azañón, J. M., Azor, A.,
Booth-Rea, G., Galve, J. P., Roldán, F. J., Mancilla, F., Giaconia, F., Morales, J., and Al-Awabdeh, M. , 2015. Quaternary landscape evolution driven by slabpull mechanisms in the Granada Basin (Central Betics), Tectonophysics, 663: 33–47, doi:10.1016/j.tecto.2015.07.035
Pérez-Peña, J. V., Azañón, J. M., Booth-Rea, G., Azor, A., and Delgado, J., 2009. Differentiating geology and tectonics using a spatial autocorrelation technique for the hypsometric integral, J. Geophys. Res.-Earth, 114, (F2), doi: 10. 1029/ 2008JF001092 Petts, G.E. 1979, Complex response of river channel
morphology subsequent to reservoir construction, Progress in Physical Geography, 3 (3): 329-362 Petts, G.E. 1984, Impounded Rivers, Wiley,
Chichester, 326 P.
Schumm, S. A., 1956. Evolution of drainage systems
and slopes in badlands at Perth Amboy, New Jersey, Geol. Soc. Am. Bull., 67, 597–646
Schumm, S.A. 2005, River Variability and Complexity, Cambridge University Press, Cambrdige
Seidl, M.A., and Dietrich, W.E., 1992. The Problem of Channel Erosion into Bedrock. Catena Supplement 23 (5):. 101-124.
Sepehr, M. and Cosgrove, J.W., 2005. Role of the Kazerun fault in the formation and deformation of the Zagros Fold-Thrust Belt, Iran. Tectonics 24 (2):. 1-13
Shahzad, F., Gloaguen, R., 2011a.TecDEM: A MATLAB based toolbox for tectonic geomorphology, Part 1: Drainage network preprocessing and stream profile analysis. Computers and Geosciences 37 (2): 250– 260.
Shahzad, F., Gloaguen, R., 2011b. TecDEM: A MATLAB based toolbox for Tectonic Geomorphology, Part 2: Surface dynamics and basin analysis. Computers and Geosciences 37 (2): 261 – 271.
Shields, D.F., Simon, A, Steffan, L.J. 2000, Reservoir effects on downstream channel migration, Environmental Conservation, 27 (1): 54-66
Stocklin, J., 1968. Possible Ancient Continental Margins in Iran. The Geology of Continental Margins, p. 873-887
Strahler, A. N., 1952. Hypsometric (area-altitude) analysis of erosional topography, Geol. Soc. Am.
Bull., 63 (11): 1117–1142.
Strahler, A. N., 1957. Quantitative analysis of watershed geomorphology, Transactions of the American Geophysical Union, 8 (6): 913–920 Tsai, H., Sung, Q.C., 2003, Geomorphic evidence for
an active pop-up zone associated with the Chelungpu fault in central Taiwan, Geomorphology, 56 (1-2): 31-47
Wang, Z. and Hu, C. 2004, Interaction between fluvial systems and large scale hydro-projects, Proceeding of 9th international Symposium on river sedimentation, October 2004, Yichang, China, www.irtces.org
Website: http://gis4geomorphology.com/
Whipple, K.X., 2004. Bedrock Rivers and the Geomorphology of Active Orogens. Annual Review of Earth and Planetary Sciences 32: 151-185.
Whittaker, A. C., Attal, M., Cowie, P. A., Tucker, G. E., and Roberts, G., 2008. Decoding temporal and spatial patterns of fault uplift using transient river long profiles, Geomorphology, 100 (3-4): 506–526 Willett, S. and Brandon, M., 2002. On steady states
in mountain belts, Geology, 30 (2): 175–178 Wobus, C., Whipple, K.X., Kirby, E., Snyder, N.,
Johnson,J., Spyropolou, K., Crosby, B., Sheehan, D., 2006.Tectonics from topography: Procedures, promise, and pitfalls. Spec. Pap., Geol. Soc. Am. 398: 55–74.
Mumipour / Geomorphometric Analysis of Maroon River by Digital Elevation Model
Journal of the Persian Gulf (Marine Science)/Vol. 7/No. 23 /March 2016/13/25-38
Journal of the Persian Gulf
(Marine Science)/Vol. 7/No. 23/ March 2016/13/25-38