Optimization of Metal Refinement Process by Selecting the
Optimal Threshold Value
1 Department of Information Science and Technology, Vanung University, Tao-Yuan 32601, Taiwan. 2 Department of Hotel Management, Vanung University, Tao-Yuan 32601, Taiwan.
3 College of Mechanical and Electronic Engineering, Wenzhou University, Wenzhou 325035, Zhejiang, China.
* Corresponding author. Tel.: +86-13676582151; email: [email protected] Manuscript submitted April 18, 2018; accepted July 11, 2018.
Abstract: The purpose of study is to find the optimal threshold value for metal refinement processes based on Taguchi loss function. Taguchi method is a widely employed methodology in many different industries for improving the performance of product/process. In Taguchi’s dynamic systems, if both input and output have only two digital values (0 and 1) with the possibility of committing two types of errors (judging 0 as 1 and 1 as 0), such a problem is called the digital system. Metal refinement processes can be viewed as a digital dynamic problem when the goal is to separate the metal molecules from the impurities. Molten metal stays at the bottom and the impurities float as slag on the top of molten metal. For this purpose, a threshold value R is required to discriminate molten metal from slag. A material is assessed as valuable metal or slag depending on the corresponding the output, which is affected by control factors and noise factors. If output is less than this threshold value R then may be considered slag and if value comes greater than or equal to threshold value R then considered valuable metal. Two types of error rate are occurred, p percent of metal molecules go into slag and q percent of a particular impurity go into the molten metal. This paper views the error rates as random variables with normal distributions and find the setting value of threshold R for the cases of loss coefficients are unequal.
Keywords: Digital dynamic system, error rate, threshold value, loss function.
1.
Introduction
Gaining global competitiveness in terms of innovative product development, satisfying demanding mass customization requirements from customers, high quality assurance, fast time-to-market and cost reductions are becoming critical success factors for many companies. Taguchi [1] method is a widely employed methodology in many different industries for improving the performance of product/process of both static and dynamic systems. A static system is defined as one where the desired output of a system has a fixed target. Problems where the output varies depending on the input are classified as a dynamic system. If both input and output have only two digital values (0 and 1) with the possibility of committing two types of errors, such a problem is called digital dynamic system.
Taguchi used the signal-to-noise (SN) ratio to determine the optimal parameter settings, which is a statistic derived from the quality loss function. A higher SN ratio means a lower loss. In case of the digital dynamic, Taguchi recommended calculating the equalized error rates first by a leveling operation based on doi: 10.17706/ijmse.2018.6.4.133-138
The equalized error rate is denoted by p0 (p0 p q' ') as
1
0 1 1 1 1 1
p p q (1)
Several researchers have studied robust design problem concerning the dynamic systems. Chen [2] developed the SN ratio for four cases of dynamic characteristic problems. They also presented the method to compute SN ratios both equispaced and non-equispaced intervals for levels of signal factors. Miller and Wu [3] pointed out the deficiencies to Taguchi’s dynamic SN ratio approach and then provided two strategies for modeling and analyzing data of dynamic systems. Wasserman [4] illustrated the parameter design of dynamic system with the regression perspective. Lunani, Nair and Wasserman [5] demonstrated the limitations of data analysis methods recommended by Taguchi and then proposed two graphical methods for identifying suitable measures of dispersion and for data analysis. McCaskey and Tsui [6] developed an appropriate two-step procedure for dynamic systems under an additive model. This procedure reduces the dimension of the optimization problem and allows for future changes of the target slope without re-optimization. Su and Hsieh [7] presented an approach based on neural network technique to achieve optimization of dynamic systems. Tsui [8] investigated the response model analysis under an additive model and a linear response-to-signal relationship. Kapur and Li [9] presented three models for the establishment of the optimal parameter conditions by selection of the optimal threshold value for digital system. Chen [10] provided a stochastic optimization modeling procedure to accommodate dynamic characteristics. The advantage of this method is that it does not require any performance measure as the SN ratio. Wu and Yeh [11] presented an approach to optimizing multiple dynamic problems based on quality loss. Wu [12] developed the signal factor contribution as SN ratio to optimize the digital system. Lai, Wu and Chen [13] investigated the correlated loss coefficient between two quality characteristics to optimize the parameter conditions by selection of optimal threshold value for the digital system. Wu [14] used the double-exponential desirability function to optimize the parameter design for the nonlinear multiple dynamic systems. Wu, Wang and Fan [15] proposed a general model for optimizing parameter design and selecting threshold value for the digital systems where the output is classified into four classes.
This paper applies the concept of Taguchi quality loss function to view the error rates as random variables and optimize the digital system and find the setting value of threshold R for the cases of loss coefficients are unequal.
2.
Digital Dynamic System
In digital systems for metal refinement process, both signal (input) and response (output) are classified into two classes: S and M. The ideal function is that whenever an input signal is S, the output should be S, and whenever the input signal is M, the output should be M. Thus, the signal values for testing are x0=S and x1=M. Suppose the output is a continuous random variable affected by control factors Z and noise factors N, the criterion for judging the output is the threshold value R. If output y0 is smaller than threshold R, y0 is set as S when input signal x0 is S. Similarly, if output y1 is larger than threshold R, y1 is set as M when input signal x1 is M. Fig. 1 describes the model of digital system.
Fig.1. Digital system model for metal refinement process.
Table 1. Input/Output Table in Terms of Error Rate Output
Input S M Total
S 1p p 1
M q 1q 1
Total 1 p q 1 p q 2
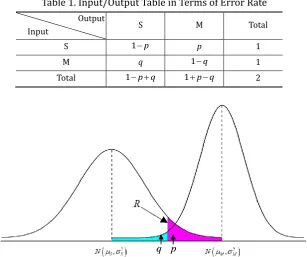
Fig. 2. Error rates p and q are not equal when the threshold is at R.
3.
Quality Loss Model of Metal Refinement Process
Let the random variables X and Y represent the results of a metal refinement process on the slag and valuable metal populations having independent normal distributions ~
, 2
S S
X N , and ~
, 2
M M
Y N
respectively, and assume that M > S. The error rate p for impurities go into the metal and error rate q for
metal molecules go into the slag are presented as
1 S Sp R (2)
M Mq R (3)
where Ф(・) is the standard normal cumulative distribution function.
When the error rate is p for impurities go into the metal, on average, we will manufacture 1 1
p
products to produce one good product. Thus, a loss is equivalent to the cost of processing
1
1 1 1 1 1 1 1 1 S S 1
L K p p K p K R (4)
Similarly, let K2 be the cost of processing one product when the error rate is q for metal molecules go into the slag. The quality loss L2 is given by
1
2 2 1 2 1 1 2 M M 1
L K q q K q K R (5)
The total quality loss of processing 100% S Rp( ) and 100% S Re( ) is represented by
1 1
1 1 S S 1 2 M M 1
L R K R K R (6)
The value of RT that achieves this minimum quality loss will be considered the optimal threshold value
* T R .
1 1 * 1 2min ( ) min 1
T R R S S M M
R L R K R K R (7)
Differentiating L(R) with respect to c and then setting the derivative equal to zero, we can obtain *
T
R . Unfortunately, there is no closed-form solution available for the cumulative normal distribution. Hence, we adopt the logistic approximation function to the cumulative normal distribution proposed by Bowling et al. [16], which is expressed as
z
1 exp 1.702
z
1 (8)Therefore, optimal threshold value *
T
R is given by
*
1 S 2 M
1.702 ln 1.702
T S M M S S M S M
R K K (9)
We can redefine the SN ratio before a leveling operation for the digital dynamic system as
1 1 * * * 1 210log 10log 1 1 1
af L RT K RT S S K RT M M (10)
4.
Conclusion
loss function.
References
[1] Taguchi, G. (1992). Taguchi Methods: Research and Development (1st ed.). Dearborn, MI.: American Suppliers Institute.
[2] Kapur, K. C., & Chen, G. (1988). Signal-to-noise ratio development for quality engineering. Quality and Reliability Engineering International, 4(2), 133-141.
[3] Miller, A., & Wu, C. F. J. (1996). Commentary on Taguchi’s parameter design with dynamic characteristics. Quality and Reliability Engineering International, 12(2), 75-78.
[4] Wasserman, G. S. (1996). Parameter design with dynamic characteristics: A regression perspective. Quality and Reliability Engineering International, 12(2), 113-117.
[5] Lunani, M., Nair, V. N., & Wasserman, G. S. (1997). Graphical methods for robust design with dynamic characteristics. Journal of Quality Technology, 29(3), 327-338.
[6] McCaskey, S. D., & Tsui, K. L. (1997). Analysis of dynamic design experiments. International Journal of Production Research, 35(6), 1561-1574.
[7] Su, C. T., & Hsieh, K.-L. (1998). Appling neural network approach to achieve robust design for dynamic quality characteristics. International Journal of Quality and Reliability Management, 15(5), 509-519. [8] Tsui, K. L. (1999). Modeling and analysis of dynamic robust design experiments. IIE Transactions,
31(12), 1113-1122.
[9] Li, M. H. (2001). Optimising operating conditions by selection of optimal threshold value for digital-digital dynamic characteristic. International Journal of Advanced Manufacturing Technology, 17(3), 210-215.
[10]Chen, S. P. (2003). Robust design with dynamic characteristics using stochastic sequential quadratic programming. Engineering Optimization, 35(1), 79-89.
[11]Wu, F. C., & Yeh, C. H. (2005). Robust design of multiple dynamic quality characteristics. International Journal of Advanced Manufacturing Technology, 25(5-6), 579-588.
[12]Wu, F. C. (2007). Robust design of digital-digital dynamic system. Journal of the Chinese Institute of Industrial Engineers, 24(5), 378-387.
[13]Lai, R. L., Wu, F. C., & Chen, C. H. (2008). Robust Design of Digital Multiple Dynamic Systems. Journal of Information and Optimization Sciences, 29(1), 103-113
[14]Wu, F. C. (2009). Robust design of nonlinear multiple dynamic quality characteristics. Computers & Industrial Engineering, 56(4), 1328-1332.
[15]Wu, F. C., Wang, H. M., & Fan, T. Y. (2010). Quality design of Taguchi’s digital dynamic systems. International Journal of Industrial Engineering: Theory, Applications and Practice, 16(5), 405-416. [16]Bowling, S. R., Khasawneh, M. T., Kaewkuekool, S., & Cho, B. R. (2009). A logistic approximation to the
cumulative normal distribution. Journal of Industrial Engineering and Management, 2(1), 114-127.
Ful-Chiang Wu is a professor in the Department of Hotel Management at Vanung University, Taiwan. He received his B.S. degree in industrial engineering from Chung-Yuan Christian University and M.S. degree and Ph.D.degree in industrial engineering and management from Yuan-Ze University in Taiwan. His current research activities include robust design, quality management, hotel management and statistics in industrial applications.
Dr. Lee is an assistant professor at Vanung University, Taiwan, in the Department of Hotel Management. She received a M.S degree in Urban Planning from National Taipei University, and her Ph.D. degree in the College of Management at Yuan Ze University, Taiwan. Her current research interests include tourism management, international business, quality management and organizational behavior.