Effects of Wood Properties and Chipping
Length on the Operational Efficiency
of a 30 kW Electric Disc Chipper
Fulvio Di Fulvio, Gunnar Eriksson, Dan Bergström
Abstract
The development of efficient woody biomass comminuting processes and systems is of great importance for establishing bio-refineries. Using hybrid systems, which store excess energy from a diesel engine during periods of low loading for use during peak loading times, may yield higher energy efficiency compared to direct diesel-powered comminuting systems. In order to design hybrid chippers, a series of data are required on the load variations, in order to estimate the amount of energy that needs to be stored, and the peak power required. As a consequence, a detailed knowledge of the effects of wood properties on the direct power con -sumption during chipping is relevant. Therefore, the objectives of this work were to study the effects of wood properties (size and density) of pine, spruce and birch trees from early thinnings in the north of Sweden on the specific power and energy demand and time consumption of a 30 kW electric chipper while producing chips of two sizes. The study has generated models that replicate the processes, which can be used when designing efficient hybrid systems. The butt area had a significant effect on the power requirements when chipping and, along with chip length, had a significant effect on the energy requirements. Butt area and chip length also had a significant effect on the chipping productivity. There were small effects caused by the OD densities and by different species. These findings agree with previous studies and can be used for designing future hybrid chippers.
Keywords: chipper, energy consumption, productivity, efficiency, hybrid systems
1. Introduction
Forest biomass is increasingly utilized worldwide for different markets, such as construction, pulp and paper, chemicals and fuels. Before being used for in -dustrial chemical and thermo-chemical processes, the wood must be comminuted. This is mainly carried out using mechanical processes such as chipping or crush-ing. For most processes, the quality of chips is defined by their homogeneity i.e. their particle size distribu-tion. Thus, chipping is preferable to crushing since it produces particles with more predictable properties. For many processes, such as combustion of solids, a wide range of fuel particle sizes may significantly re -duce the efficiency of the conversion process. Thus, the development of efficient woody biomass comminut -ing processes and systems is of great importance in order to achieve these targets.
po-tential energy, for instance from braking and from crane movements. Such systems may give higher en-ergy efficiency compared to a direct diesel-powered system. For forest machines, potential savings from hybridization of 15–30% have been predicted (Swed -ish Forest Agency 2012). When designing a hybrid system for chipping, it is essential to understand the variations in the power required over time. Work to develop such systems is currently being undertaken in many different markets (Larsson 2012).
In order to design hybrid chippers, an understand -ing of the operational conditions is necessary. Data on load variations, to estimate the amount of energy that needs to be stored, and on the power that is required during peaks, are required. Direct measurements of the torque and rotation speed (Nurmi 1986, Liss 1987, Van Belle 2006, Spinelli et al. 2012) make it possible to focus on the chipping process and to eliminate the in-fluence of other factors such as operator skill, the log loading system and engine efficiency. The exclusion of these factors was necessary in order to increase the accuracy in this study, but factors such as the loading system may increase the chipper idling time, usually accounting for approximately 10% of the productive work time (c.f. Röser et al. 2012), and could generate energy for charging an electrical accumulator.
The measurement of the operational fuel consump-tion as a measure of energy consumpconsump-tion for chipping is commonly carried out (e.g. Aman 2011, Yoshioka 2006). Magagnotti and Spinelli (2011) found that the energy used for chipping represents only about 3% of the energy return (solid fuel wood) for an industrial diesel drum chipper. However, diesel consumption makes up 36% of the operational costs for roadside chipping (Marchi et al. 2011) and the use of it signifi -cantly contributes to greenhouse gas emissions (Van Belle 2006).
There are many factors influencing the efficiency of chipping processes. The influence of chipper geom -etry (parameters such as knife sharpness, spouting angle, side angle and the number of knives) on disc chipping has been studied by Hartler (1986), Uhmeier (1995), Hellström (2008, 2009) and Abdallah (2011). Among the wood parameters, density, temperature (especially if the wood is frozen) and moisture content are known to influence the process (Kivimaa and Mur -to 1949, Papworth and Erickson 1966, Liss 1991). Kivi -maa and Murto (1949) showed that an increase in chip length from 2.5 to 50 mm resulted in a reduction of energy requirement per produced energy by about 88%. The production of larger chips can decrease the required energy per tonne, per oven dry-tonne (OD t) and per cubic metre (m3) significantly (cf. Nurmi 1986).
However, Spinelli et al. (2012) showed that a novel knife design for disc chippers can significantly im -prove the quality of chips for small boilers, without reducing the machine energy efficiency. Wood piece size has a significant effect on productivity and energy demand, as efficiency was found to be proportional to the size of wood used (Liss 1987; 1991, Van Belle 2006, Ghaffariyan et al. 2013). Different tree species have dif -ferent wood properties, e.g. depending on the growth rate of trees and species, the resultant wood has a dif-ferent density/hardness, which also affects the chip -ping efficiency (Liss 1991).
Small diameter trees from early thinnings repre-sent a great resource of biomass for refinery purposes in Finland and Sweden, where, respectively, 2.5 and 1.3 million m3 of forest chips are produced annually from small trees, that is around 33% and 20% of the respective total potential resource (Routa et al. 2012). The main tree species in the region are Scots pine (Pinus sylvestris L.), Norway spruce (Picea abies (L.) Karst) and birch (Betula spp.), all of which have differ -ent wood properties.
Knowledge about the influence of factors such as wood properties on direct power consumption during chipping is of relevance to the development of efficient comminuting systems.
Knowledge of the specific electricity consumption is of importance for designing hybrid systems i.e. de-scribing the variation and peaks in workload that the electricity generator (diesel engine) must handle.
The objectives of this work were to study the effects of wood properties (size and density) of pine, spruce and birch on the specific power energy demands and time consumption of a 30 kW electric chipper when producing chips in two sizes, in order to create models which can be used when designing efficient hybrid systems based on similar chippers.
2. Material and methods
Delimbed stemwood logs from pine, spruce and birch were sampled from a thinning site in the coastal area of Västerbotten (64°06’ N, 20°37’ E and 60 m.a.s.l.), northern Sweden. The sampled stand had a density of 3200 trees/ha, an average tree size diameter of 8.1 cm at breast height (dbh) and an average height of 8.3 m. In total, about 30 m3 of solid round-wood were
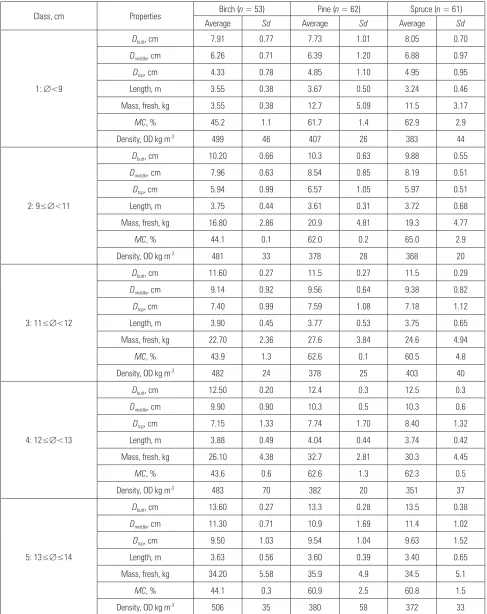
-Table 1 Properties of trees per species and diameter size class (1–5) used in experiments using average and standard deviation (Sd) values. Diameter at butt end = Dbutt, diameter at half length = Dmiddle, diameter at top = Dtop, moisture content, wet basis = MC
Class, cm Properties Birch (n = 53) Pine (n = 62) Spruce (n = 61)
Average Sd Average Sd Average Sd
1: <9
Dbutt, cm 7.91 0.77 7.73 1.01 8.05 0.70
Dmiddle, cm 6.26 0.71 6.39 1.20 6.88 0.97
Dtop, cm 4.33 0.78 4.85 1.10 4.95 0.95
Length, m 3.55 0.38 3.67 0.50 3.24 0.46
Mass, fresh, kg 3.55 0.38 12.7 5.09 11.5 3.17
MC, % 45.2 1.1 61.7 1.4 62.9 2.9
Density, OD kg m-3 499 46 407 26 383 44
2: 9<11
Dbutt, cm 10.20 0.66 10.3 0.63 9.88 0.55
Dmiddle, cm 7.96 0.63 8.54 0.85 8.19 0.51
Dtop, cm 5.94 0.99 6.57 1.05 5.97 0.51
Length, m 3.75 0.44 3.61 0.31 3.72 0.68
Mass, fresh, kg 16.80 2.86 20.9 4.81 19.3 4.77
MC, % 44.1 0.1 62.0 0.2 65.0 2.9
Density, OD kg m-3 481 33 378 28 368 20
3: 11<12
Dbutt, cm 11.60 0.27 11.5 0.27 11.5 0.29
Dmiddle, cm 9.14 0.92 9.56 0.64 9.38 0.82
Dtop, cm 7.40 0.99 7.59 1.08 7.18 1.12
Length, m 3.90 0.45 3.77 0.53 3.75 0.65
Mass, fresh, kg 22.70 2.36 27.6 3.84 24.6 4.94
MC, % 43.9 1.3 62.6 0.1 60.5 4.8
Density, OD kg m-3 482 24 378 25 403 40
4: 12<13
Dbutt, cm 12.50 0.20 12.4 0.3 12.5 0.3
Dmiddle, cm 9.90 0.90 10.3 0.5 10.3 0.6
Dtop, cm 7.15 1.33 7.74 1.70 8.40 1.32
Length, m 3.88 0.49 4.04 0.44 3.74 0.42
Mass, fresh, kg 26.10 4.38 32.7 2.81 30.3 4.45
MC, % 43.6 0.6 62.6 1.3 62.3 0.5
Density, OD kg m-3 483 70 382 20 351 37
5: 1314
Dbutt, cm 13.60 0.27 13.3 0.28 13.5 0.38
Dmiddle, cm 11.30 0.71 10.9 1.69 11.4 1.02
Dtop, cm 9.50 1.03 9.54 1.04 9.63 1.52
Length, m 3.63 0.56 3.60 0.39 3.40 0.65
Mass, fresh, kg 34.20 5.58 35.9 4.9 34.5 5.1
MC, % 44.1 0.3 60.9 2.5 60.8 1.5
tal of 185 logs (63 pine, 61 spruce, 52 birch) were ran -domly sampled from the piles. Their lengths fell in the range 2.6–5.1 m, the diameters of their butt ends (dbutt) ranged from 5.6 to 14.4 cm and their mass (fresh weight) ranged from 3.5 to 43.5 kg. The total mass was 4189 kg. The diameter was measured for each log at the butt end (dbutt) at half length (dmiddle) and at the top (dtop).
The length and mass of each tree log were also meas-ured. The logs were sorted by species and dbutt into five classes: 1) Ø < 9 cm, 2) 9 ≤ Ø < 11 cm, 3) 11 ≤ Ø < 12 cm, 4) 12 ≤ Ø < 13 cm and 5) 13 ≤ Ø ≤ 14 cm (Table 1). Each combination of species (n = 3) and diameter class (n = 5) (15 treatment combinations) was repeated three times. Each treatment combination was carried out using two different disc chipper knife settings (nominal lengths of 8 mm (»short«) and 12 mm (»long«)).
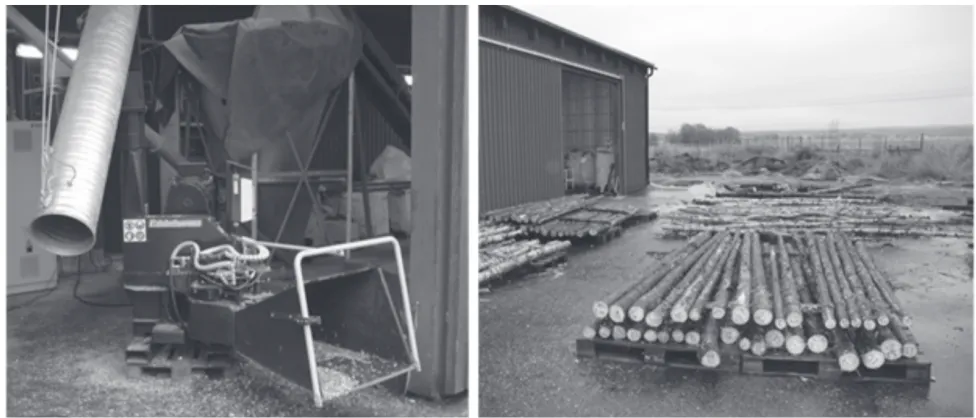
The chipper used was an Edsbyhuggen 250H (Edsbyhuggen AB, Sweden, year of manufacture 2011) with a 30 kW electric motor (Busck T1C 200L-4), which had an efficiency of 91.2–93.5% at full load (Swedish Energy Agency 2010) (Fig. 1). It had a hy -draulic system (15 l) that drove a vertical pair of feed-rollers with an in-feed opening of 250×250 mm. The speed of the feed rollers was constant over the whole experiment. The chipper was equipped with a steel disc 825 mm in diameter and 38 mm thick, with 4 knives, giving a total mass of 205 kg. The disc formed an angle of 45° with the feed direction and rotated at 540 rpm. The 4 knives were adjustable to produce chips from 5 to 12 mm in target length. The chips produced were blown for 2.0 m into an expulsion tube by means of a fan and then collected in 1.5 m3
plastic bags.
The first batch of logs was chipped to a length of 12 mm and the second to 8 mm. The electricity supply to the chipper was connected to a Fluke Power Log data logger during the experiment, giving instantane-ous measurements of the electricity used by the en-gine. These data were logged at a sampling frequency of 2 Hz (1 observation every 0.5 seconds). The instru -ment was calibrated before starting the experi-ments. The chipping output was defined as the scaled mass of each log and its solid volume, which was calculated using the butt and top diameters with the length in the formula for the volume of a truncated cone. The dry density of each log was determined as the ratio be-tween its dry mass and volume. Individual logs were manually fed into the chipper, butt end first.
To determine the moisture content (MC, wet basis), 30, five litre buckets of chips were collected (150 litres in total); the chips were collected from the output stream. Each bucket was filled by merging together sub-samples from three trees per diameter class (for each species and treatment combination). It was as -sumed that all trees in each diameter class had ap-proximately the same MC. The MC was determined in accordance with CEN/TS 14774-2. The same oven-dried samples used for determining MC were used for the determination of particle size distribution in ac-cordance with CEN/TS 15149-1. The sieves used were suitable for length classes 31.5 mm, 16 mm, 8 mm and 3.15 mm.
The time taken to chip each individual log (»chip -ping time«) was determined from the power measure-ments (the time was also manually recorded with a stopwatch for comparison). Chipping took place from
the moment that 1) the power had reached a threshold of at least 6.0–9.2 kW above the idle power of the chip -per (in the absence of logs) and 2) the power consump -tion increased at a rate of 1 kW s-1. The end of each
repetition occurred when the power consumption
had dropped below 5.5 kW at a rate of 0.6–0.7 kW s-1
(Fig. 2).
The absolute maximum power (kW) demand reached over the chipping time for each run repre-sented the »maximum power demand«. The »energy
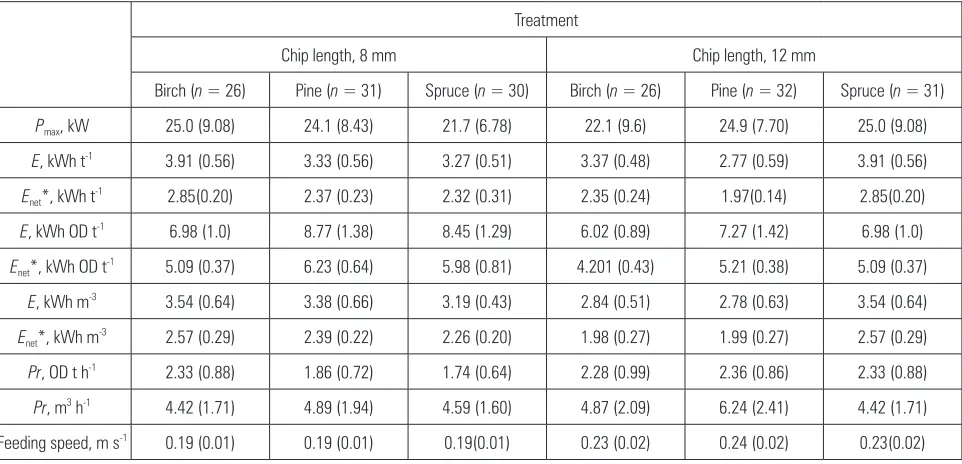
Table 2 Average results of the chipping experiments (standard deviation in parentheses). Required maximum power = P, energy demand = E, productivity = Pr
Treatment
Chip length, 8 mm Chip length, 12 mm
Birch (n = 26) Pine (n = 31) Spruce (n = 30) Birch (n = 26) Pine (n = 32) Spruce (n = 31)
Pmax, kW 25.0 (9.08) 24.1 (8.43) 21.7 (6.78) 22.1 (9.6) 24.9 (7.70) 25.0 (9.08)
E, kWh t-1 3.91 (0.56) 3.33 (0.56) 3.27 (0.51) 3.37 (0.48) 2.77 (0.59) 3.91 (0.56)
Enet*, kWh t-1 2.85(0.20) 2.37 (0.23) 2.32 (0.31) 2.35 (0.24) 1.97(0.14) 2.85(0.20)
E, kWh OD t-1 6.98 (1.0) 8.77 (1.38) 8.45 (1.29) 6.02 (0.89) 7.27 (1.42) 6.98 (1.0)
Enet*, kWh OD t-1 5.09 (0.37) 6.23 (0.64) 5.98 (0.81) 4.201 (0.43) 5.21 (0.38) 5.09 (0.37)
E, kWh m-3 3.54 (0.64) 3.38 (0.66) 3.19 (0.43) 2.84 (0.51) 2.78 (0.63) 3.54 (0.64)
Enet*, kWh m-3 2.57 (0.29) 2.39 (0.22) 2.26 (0.20) 1.98 (0.27) 1.99 (0.27) 2.57 (0.29)
Pr, OD t h-1 2.33 (0.88) 1.86 (0.72) 1.74 (0.64) 2.28 (0.99) 2.36 (0.86) 2.33 (0.88)
Pr, m3 h-1 4.42 (1.71) 4.89 (1.94) 4.59 (1.60) 4.87 (2.09) 6.24 (2.41) 4.42 (1.71)
Feeding speed, m s-1 0.19 (0.01) 0.19 (0.01) 0.19(0.01) 0.23 (0.02) 0.24 (0.02) 0.23(0.02)
*The power used when the machine was idling has been deducted from the total power
demand« (kWh ODt-1; kWh m-3) was obtained by
in-tegration of the total power demand over the chipping time for each run divided by the mass/volume of each log. The mechanical energy required for the direct in-teraction between the knives and the wood, henceforth referred to as »net energy demand«, was calculated by integrating the difference between the total power over chipping time and the power used running the chipper in the absence of logs (estimated as the aver-age power over at least 4 s immediately before or after the chipping). The »chipping productivity« (ODt h-1;
m3 h-1) was obtained as the ratio between the OD mass/
solid volume of each log (output) and its chipping time.
Statistical analyses of data were carried out using the software Minitab 16 (Minitab Ltd). General Regres -sion Models (GLM) were used to detect significant factors and differences (p < 0.05) between chipping treatments and to model the results in the experiment. For the analysis of required maximum power (P = kW), energy demand (E = kWh ODt-1; kWh m-3) and
produc-tivity (Pr = ODt h-1; m3 h-1), the following hypothetic
linear models were used:
(L)
i 1 2 i
, ( ) ( )
P E= +m a +b A +b r +e (1)
(L)
i 1(ln( )) 2(ln( )) i
ln(Pr)= +m a +b A + b r +e (2)
Where μ = overall mean, α = factor fixed effect, β1, β2 = constants and ε = random error. »L« is the length class (»short« and »long«) of the chips, »A« is the butt area (cm2) and »ρ« is the wood density (OD kg m–3). These factors were selected based on the work of Liss (1987, 1991) and the specific experimental factors. A cor -relation test was used to exclude collinearity among factors. The original data were transformed to the natu-ral logarithmic scale for the productivity models in or-der to obtain linear relationships. Only the significant factors (p ≤ 0.05) were included into the final models.
The dataset contained 52, 63 and 61 observations, respectively, for birch, pine and spruce; 10% of the original observations for each of the species were ran-domly extracted and reserved as witness samples for model validation by using paired t-tests with a 5% sig -nificance level.
3. Results
The observed time for chipping each log varied between 11.5 and 24.9 s. There were obvious differ -ences in required power (P) and energy demand (E) and in productivities (Pr) between the different tested chip sizes (Table 2).
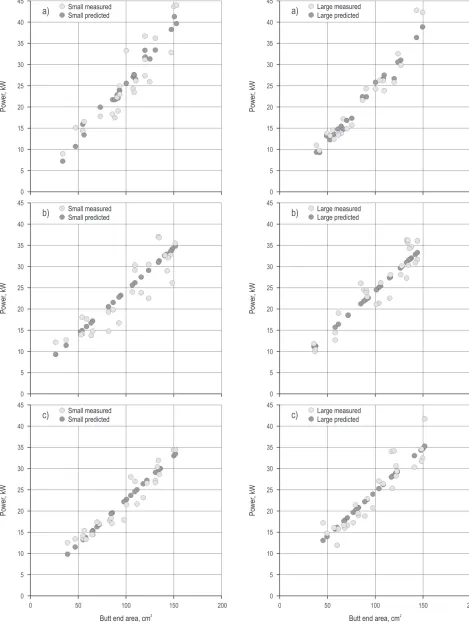
The power required for chipping consisted of two parts: one part was proportional to the mass flow through the chipper (for a given chip size), with the other being constant, regardless of chip production (including friction and powering of the hydraulic pump for the feed-rolls). The maximum power re-quired for chipping (Pmax) was roughly proportional
to the butt cross-sectional area of the stems, which ex -plained most of the variability; it was almost indepen-dent of the chip length, which accounted for only slight variation (1%) (Fig. 3, Table 3). However, longer chips required significantly higher peak power than the shorter ones in the case of spruce (Eq. 5). In the case of birch, the maximum power absorbed was also di-rectly correlated to the density, which accounted for a small part of the variability (2%) (Table 3, Eq. 3).
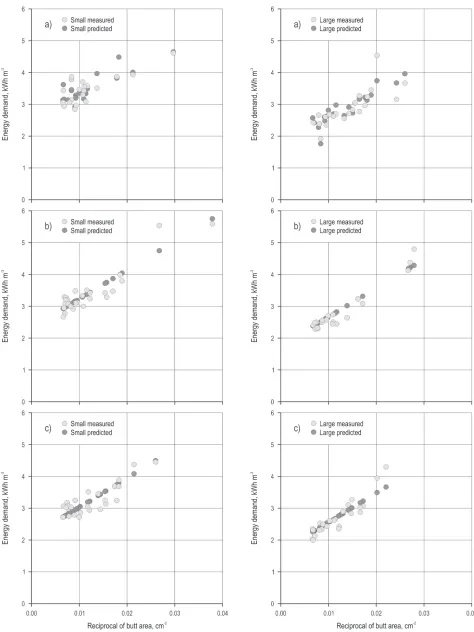
The higher mass flow through the chipper for
thicker logs meant that the chipping energy per m3
increased linearly with the reciprocal cross-sectional area (Fig. 4, Eqs. 9–11); the relationship was statisti -cally significant in all cases (Table 3). This means that the chipping energy per m3 decreased with increasing
stem diameter. When the energy required for running the chipper whilst not chipping was subtracted (Enet),
the dependence on stem diameter became less evident. The chip size also had a significant effect for all species (Table 3), since longer chips reduced the energy re -quirements (Eqs. 6–11), due to the minor refinement. The chipping energy per m3 was about 20% less for a nominal chip size of 12 mm, compared to 8 mm. At the same time, an increase of OD density significantly in -creased the energy demand per m3, while the density was inversely proportional to the energy per OD t, since density and output (OD t) are directly related. The wood density effect was generally less than the stem size and the chipping length, becoming signifi -cant only in some of the cases (Eqs. 8–9), (Table 3).
The significant relationships shown in Table 3 are described by the following equations:
max birch 14.6240 0.2651 0.0272 ; kW
P = − + ⋅ +A ⋅r (3)
R2 (adj) = 89.18%, F = 190.499, p < 0.001
max pine 3.7002 0.2040 ; kW
P = + ⋅A (4)
R2 (adj) = 83.93%, F = 293.425, p < 0.001
max spruce 1.6388 1.7673 0.2089 ; kW
P = + ⋅ +L ⋅A (5)
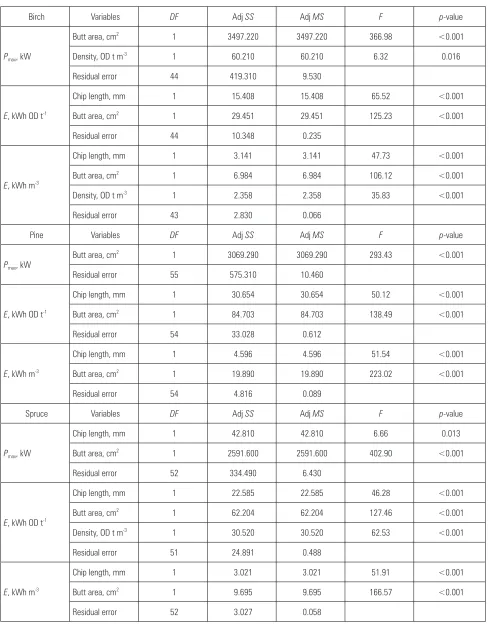
Table 3 Analysis of variance table for maximum power (Pmax) and energy demand (E) as a function of significant factors and variables in-cluded in the models
Birch Variables DF Adj SS Adj MS F p-value
Pmax, kW
Butt area, cm2 1 3497.220 3497.220 366.98 <0.001
Density, OD t m-3 1 60.210 60.210 6.32 0.016
Residual error 44 419.310 9.530
E, kWh OD t-1
Chip length, mm 1 15.408 15.408 65.52 <0.001
Butt area, cm2 1 29.451 29.451 125.23 <0.001
Residual error 44 10.348 0.235
E, kWh m-3
Chip length, mm 1 3.141 3.141 47.73 <0.001
Butt area, cm2 1 6.984 6.984 106.12 <0.001
Density, OD t m-3 1 2.358 2.358 35.83 <0.001
Residual error 43 2.830 0.066
Pine Variables DF Adj SS Adj MS F p-value
Pmax, kW
Butt area, cm2 1 3069.290 3069.290 293.43 <0.001
Residual error 55 575.310 10.460
E, kWh OD t-1
Chip length, mm 1 30.654 30.654 50.12 <0.001
Butt area, cm2 1 84.703 84.703 138.49 <0.001
Residual error 54 33.028 0.612
E, kWh m-3
Chip length, mm 1 4.596 4.596 51.54 <0.001
Butt area, cm2 1 19.890 19.890 223.02 <0.001
Residual error 54 4.816 0.089
Spruce Variables DF Adj SS Adj MS F p-value
Pmax, kW
Chip length, mm 1 42.810 42.810 6.66 0.013
Butt area, cm2 1 2591.600 2591.600 402.90 <0.001
Residual error 52 334.490 6.430
E, kWh OD t-1
Chip length, mm 1 22.585 22.585 46.28 <0.001
Butt area, cm2 1 62.204 62.204 127.46 <0.001
Density, OD t m-3 1 30.520 30.520 62.53 <0.001
Residual error 51 24.891 0.488
E, kWh m-3
Chip length, mm 1 3.021 3.021 51.91 <0.001
Butt area, cm2 1 9.695 9.695 166.57 <0.001
1 –1
tot birch 5.2067 1.1704 149.088 ; kWh ODt
E = − ⋅ +L ⋅A− (6)
R2 (adj) = 77.48%, F = 80.127, p < 0.001
1 –1
tot pine 6.5568 1.4683 186.598 ; kWh ODt
E = − ⋅ +L ⋅A− (7)
R2 (adj) = 77.61%, F = 98.057, p < 0.001
1 tot spruce
–1
13.8361 1.3218 236.837 0.02154 ;
kWh ODt
E = − ⋅ +L ⋅A− − ⋅r
(8)
R2 (adj) = 77.99%, F = 64.788, p < 0.001
1 tot birch
–3
0.3146 0.5782 72.7758 0.0059 ;
kWh m
E = − − ⋅ +L ⋅A− + ⋅r
(9)
R2 (adj) = 82.39%, F = 72.731, p < 0.001
1 –3
tot pine 2.3135 0.5697 90.4222 ; kWh m
E = − ⋅ +L ⋅A− (10)
R2 (adj) = 83.45%, F = 142.135, p < 0.001
1 –3
tot spruce 2.1027 0.4704 91.3848 ; kWh m
E = − ⋅ +L ⋅A− (11)
R2 (adj) = 81.18%, F = 117.475, p < 0.001
where L = 0 for the chip length »8 mm« and 1 for the chip length »12 mm«.
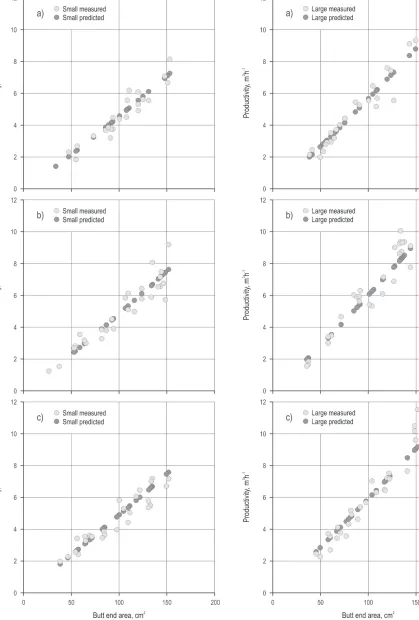
The productivities (m3 h-1), based on effective chip
-ping work time (excluding all waiting times), were strongly correlated to the stem diameter (Fig. 5, Table 4).The productivities were roughly proportional to the cross-sectional area of the logs fed into the chipper, while the feeding speed difference was small (0.04 m/s) almost constant with a little reduction in feeding rate seen for thicker logs (Fig. 5). As the chip length was increased from 8 to 12 mm, the productivity increased, and the difference between the two sizes was 22% at a cross-sectional area of 80 cm2 (Fig. 5). The OD density became significant, in the case of spruce (Eq. 14), and it was directly correlated with the productivity in terms of OD t, due to the fact that the mass fed to the machine increased with log density. Based on the sig -nificant relationships found in the analyses (Table 4), the following two models were created:
4.2031 0.1521 L 1.0866 –1 birch
Pr =e− + ⋅ ⋅A ; ODt h (12)
R2 (adj) = 92.91%, F = 201.835, p < 0.001
4.1708 0.2150 L 1.0372 –1 pine
Pr =e− + ⋅ ⋅A ; ODt h
(13)
R2 (adj) = 91.03%, F = 285.275, p < 0.001
11.5447 0.2011 L 1.0713 1.2157 –1 spruce
Pr =e− + ⋅ ⋅A ⋅r ; ODt h (14)
R2 (adj) = 92.03%, F = 208.781, p < 0.001
3.5721 0.2166 L 1.1030 3 –1 birch
Pr =e− + ⋅ ⋅A ; m h (15)
R2 (adj) = 92.68%, F = 292.080, p < 0.001
3.5059 0.2170×L 1.1032 3 –1 pine
Pr =e− + ⋅A ; m h (16)
R2 (adj) = 92.26%, F = 334.658, p < 0.001
3.3025 0.1921 L 1.0596 3 –1 spruce
Pr =e− + ⋅ ⋅A ; m h (17) R2 (adj) = 92.27%, F = 323.116, p < 0.001
where L = 0 for the chip length »8 mm« and 1 for the chip length »12 mm«.
The t-tests for validation showed, in all cases, p -values > 0.05. The smallest p-value was 0.124 in the case of Eq. 12 for birch productivity (m3 h-1).
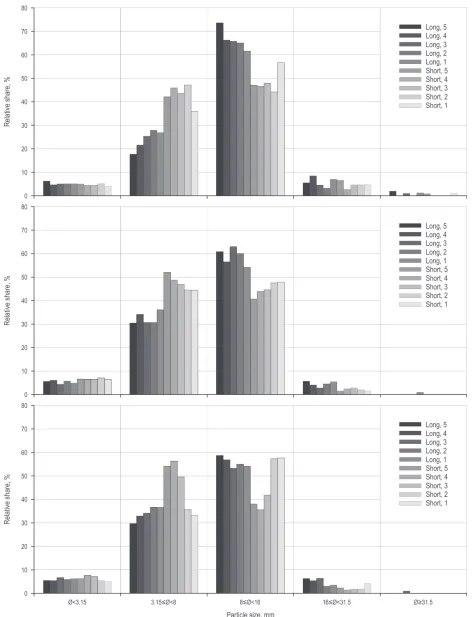
When the 12 mm chipper knife setting was used (long), birch logs with smaller diameters tended to result in finer chips than those with larger diameters (Fig. 6), with a similar trend for spruce but not for pine. When the 8 mm chipper knife setting was used (short) on pine and spruce, there was an opposite trend with smaller diameter stems resulting in coarser chips than the larger diameters. There were very few particles (< 0.5%) that did not pass through the 31.5 mm sieve, which means that the chip quality should be adequate for combustion in small-scale generators, even with the chipper set for 12 mm.
In general, if chipper settings (i.e. short and long) are considered together, a significantly higher mass fraction of the birch chips was in the size interval l8–16 mm, compared to spruce (p = 0.037). As a consequence, com -pared to the two softwoods, significantly (p = 0.015) fewer birch chips fell into the size interval 3.15–8 mm. Thus, birch chips tend to be slightly larger than soft -woods in general; however the combination of species and chipping length masked those differences to a cer -tain extent (Table 5).
4. Discussion
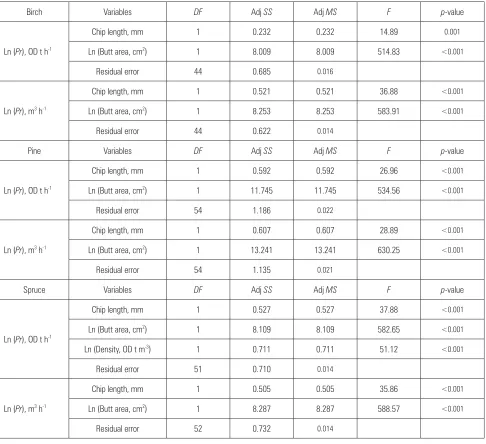
Table 4 Analyses of variance table for the productivity (Pr) as a function of significant factors and variables included in the models
Birch Variables DF Adj SS Adj MS F p-value
Ln (Pr), OD t h-1
Chip length, mm 1 0.232 0.232 14.89 0.001
Ln (Butt area, cm2) 1 8.009 8.009 514.83 <0.001
Residual error 44 0.685 0.016
Ln (Pr), m3 h-1
Chip length, mm 1 0.521 0.521 36.88 <0.001
Ln (Butt area, cm2) 1 8.253 8.253 583.91 <0.001
Residual error 44 0.622 0.014
Pine Variables DF Adj SS Adj MS F p-value
Ln (Pr), OD t h-1
Chip length, mm 1 0.592 0.592 26.96 <0.001
Ln (Butt area, cm2) 1 11.745 11.745 534.56 <0.001
Residual error 54 1.186 0.022
Ln (Pr), m3 h-1
Chip length, mm 1 0.607 0.607 28.89 <0.001
Ln (Butt area, cm2) 1 13.241 13.241 630.25 <0.001
Residual error 54 1.135 0.021
Spruce Variables DF Adj SS Adj MS F p-value
Ln (Pr), OD t h-1
Chip length, mm 1 0.527 0.527 37.88 <0.001
Ln (Butt area, cm2) 1 8.109 8.109 582.65 <0.001
Ln (Density, OD t m-3) 1 0.711 0.711 51.12 <0.001
Residual error 51 0.710 0.014
Ln (Pr), m3 h-1
Chip length, mm 1 0.505 0.505 35.86 <0.001
Ln (Butt area, cm2) 1 8.287 8.287 588.57 <0.001
Residual error 52 0.732 0.014
Table 5 Influence of species and chipper knife settings on the particle size distribution as percentage of total sieved mass
Particle size interval, mm
Birch Pine Spruce
Long (n = 5) Short (n = 5) Long (n = 5) Short (n = 5) Long (n = 5) Short (n = 5)
<3.15 4.8 bc* 4.5 c 4.9 bc 6.2 a 5.7 ab 6.1 a
3.15–8 23.4 c 42.7 ab 32.1 bc 47.3 a 33.9 bc 45.7 a
8–16 65.9 a 48.4 bc 58.9 ab 44.8 c 55.5 abc 46.2 c
16–31.5 5.5 a 4.3 ab 4.0 abc 1.6 c 4.8 a 2.0 bc
>31.5 0.4 a 0.1 a 0.1 a 0.0 a 0.1 a 0.0 a
maximum power required for chipping is not strong-ly affected by the chip length, but is moststrong-ly related to the diameter of a log’s butt end. One explanation for this is that the butt end of a log causes the maximum »absorption« of power during the chipping process; the peak chipping power was 24–125% higher than the average absorbed when chipping the rest of the log. If the power required to run the chipper empty was re-moved from the total (i.e. when the chipper was idling), the net power for chipping was proportional to the butt area. This is in agreement with the results of Nurmi (1986) and Liss (1987), while Van Belle (2006) found an exponential relationship with the diameters of wood parts when chipping logging residues.
The productivity was significantly lower when pro -ducing shorter chips and more energy was used. This is due to the increased number of required cuts per wood piece, which slows down the process. These find -ings agree with Liss (1987, 1991), Nurmi (1986), Facello et al. (2013) and Spinelli and Magagnotti (2012). The energy consumption for the production of small chips (8 mm; 1.3–4.5 kWh m-3) was in line with results found by Liss (1987), who studied tree species, similar stem sizes and similar feeding inclination angle (50°). How -ever, Liss’ (1987) measurements were made directly on the shaft connecting the tractor and the chipper, which means that it did not include additional energy losses in the process. In the present study, these losses amount -ed to 8.1% of the total energy requirements.
The energy requirements for chipping in this study corresponded, on average, to 0.085% of the produced fuel energy content (lower heating value). In most other studies, losses in the diesel engine are included in the measured values, which change the results con-siderably. For example, Liss (1987) estimated that the amount of energy produced by the diesel fuel was a factor of 3.3 larger than the resulting power on the tractor PTO shaft. He also considered that the fuel con -sumption under operational conditions would be doubled when the waiting time is included.
In this study, the productivity (ODt h–1) increased with butt end area by up to a power of 1.04–1.09, whereas Van Belle (2006) found it to be 1.05. It seems that the productivity increase is almost proportional to the volume feeding rate and that the specific energy requirements can be reduced with more efficient feed -ing. Thus, an efficient use of the feed opening and available chipping time are both important. For very small trees and logging residues, feeding of many stems at a time should increase the efficiency. One way to reduce the waiting time could also be to have a larger feeding board. Nurmi (1986) found that, for a given cross-sectional area, bunches required less
pow-er when compared to single stems. This fact indicates that there are advantages to having the biomass com-pressed/bundled to diameter sizes that match the feed-ing inlet of the chipper in comparison to loose mate-rial (cf. Nurmi 1986).
As birch wood had a lower MC than the softwoods in this study, only the combined influence of OD den -sity and MC could be estimated. However, for the studied three species, the experiment was representa-tive for chipping fresh wood.
Although wood logs were all sampled from one stand, different levels of variability in wood densities were observed for the three species due to their differ -ent growth characteristics. This study made it possible to observe some of the effects due to this variability, but a larger sampling could have made it easier to investi-gate the effect of densities to a larger extent. Tree species seems to have some effect on the energy demand, due to the higher density of hardwood (birch), which cor-responded to a 3–4% higher energy demand per m3 than for softwood (i.e. pine and spruce) at a butt diam -eter of 10 cm (a butt-end area of 80 cm2).
The feed to the chipper used in the present study had a disc side angle of about 45° and should be rather energy efficient compared to feeding the logs in perpen -dicular (90°) to the plane of rotation of the disc. Pap -worth and Erickson (1966) found that an increasing side angle decreased the specific energy consumption. In addition to reducing the waiting time for the chipper, the energy efficiency of the process can be improved, if it is possible to reduce the energy demands of the hy-draulic system and the fan when no chipping takes place. Compared to a tractor-driven »Farmi« chipper of similar size studied by Van Belle (2006), the chipper used in the present study required about 3.5 kW when no feeding took place, below the 4.6–4.9 kW measured by Spinelli et al. (2013), but above the mechanically re -quired minimum of 1.4 kW as measured by Van Belle (2006). Thus, it seems that the Edsby chipper could be improved. For example, Liss (1987) suggested using a conveyor instead of a fan for removing the chips and suggested that the waiting periods during crane move-ments could be used for emptying the chips as a way to reduce the power requirement.
idea of how much energy is wasted when starting or turning off a similar machine. In addition, it was ob -served that the idling power decreased when the chip-per had warmed up. This was not expected for an electric engine and was probably due to the warming of the hydraulic oil, which affected the results (on av -erage 1.3% of the maximum power demand).
During the experiments, some wood pieces about 10 cm long, from previous chipped logs, remained in the chipper in each run (i.e. wood pieces stayed between the feed rollers and the disc). This could also have gen-erated some errors in the recording of absolute power; however, the error was almost constant between repeti-tions. Nevertheless, this could have had some influence on the quality of the chips. For this reason, we avoided sampling chips immediately at the starting of a new run. Different bouncing disturbances were observed in case of different species and chip lengths, thus a vari -able threshold was used to identify the starting of chip-ping process, and this could have also introduced some marginal uncertainty in the analyses.
With regard to the prospects of using hybrid pow-er systems for chipping and grinding equipment, sev-eral basic decisions have to be made. The system may consist of only a chipper/grinder, or be a more com-plex system including other components such as a crane used for loading. Depending on the actual sys-tem, the engine load pattern will be different. The amount of energy to be stored and the required pow-er will have to be estimated. When optimizing such a system, the cost of additional components such as an electric motor and a battery must be compared to the efficiency gains.
5. Conclusions
This study provides models which could be used for estimating the power and energy requirements, along with the chipping productivity, of a 30 kW elec -tric disc chipper for chipping small diameter pine, spruce and birch trees from early thinnings in the north of Sweden.
The following factors have a significant effect on the power requirements and productivity when chip-ping small logs from thinnings: chip length, butt area and density.
The maximum power required for chipping was roughly proportional to the butt cross-sectional area of the stems, which explained most of the variability; it was almost independent of the chip length.
The energy needed per m3 decreased by 4% for
each centimetre increase in stem butt diameter. The
chip size also had a significant effect, and the chipping energy per m3 was about 20% less for a nominal chip size of 12 mm, compared to 8 mm. Increases in OD density increased the energy demand per m3.
The productivities were roughly proportional to the cross-sectional area of the logs fed into the chipper. As the chip length increased from 8 to 12 mm, the productivity increased, and the difference between the two sizes was 20% at a cross-sectional area of 80 cm2.
The chipping of hardwood (birch) corresponded to a slightly higher (3–4%) energy demand per m3 than for softwood (i.e. pine and spruce).
These findings are in line with previous studies and the results could be used for designing small hy-brid chippers.
Acknowledgements
The research program Botnia–Atlantica – the project Forest Refine – is gratefully acknowledged for finan -cial support. We espe-cially acknowledge Otto Läspä and Raul Fernandez Lacruz for their assistance in the chipping test. The forest company Sveaskog is ac-knowledged for providing biomass for the experi-ments.
6. References
Abdallah, R., 2011: Experimental study about the effects of disc chipper settings on the distribution of wood chip size. Biomass and Bioenergy 35: 843–852.
Aman, A.L., Baker, S.A., Greene, W.D., 2011: Productivity and
product quality measures for chippers and grinders on
op-erational southern US timber harvests. International Journal of Forest Engineering 22(2): 7–14.
Facello, A., Cavallo, E., Magagnotti, N., Paletto, G., Spinelli, R., 2013: The effect of chipper cut length on wood fuel process
-ing performance. Fuel Process-ing technology 116: 228–233. Hartler, N., 1986: Chipper design and operation for optimum chip quality. Tappi Journal 69(10): 62–66.
Ghaffariyan, M., Spinelli, R., Brown, M., 2013: A model to predict productivity of different chipping operations. South
-ern Forests: a Journal of Forest Science 75(3): 129–136. Hellström, L.M., Gradin, P.A.,Carlberg, T., 2008: A method for
experimental investigation of the wood chipping process.
Nordic Pulp and Paper Research Journal 23(3): 339–342. Hellström, L.M., Isaksson, P., Gradin, P.A., Eriksson, K., 2009: An analytical and numerical study of some aspects of the wood chipping process. Nordic Pulp and Paper Research Journal 24(2): 225–230.
Larsson, G., 2012; Hybridization of off-road mobile machinery (Hybridiseringavmobilamaskiner, in Swedish). Swedish Uni
-versity of Agricultural Sciences, Department of Energy and
Technology.
Liss, J. E., 1987: Power requirement and energy consumption
in fuel-chip production using a tractor-mounted chipper.
Swedish University of Agricultural Sciences, Department of Operational Efficiency, Report No 173, Garpenberg, Sweden. Liss, J. E., 1991: Bränsleflisensfraktionsfördelning – Enstudie
-avnågramaskin- ochvedparametrarsinverkanpåfliskvaliteten. Fractional distribution on fuel chips – Machine and wood pa
-rameters influence on chip quality. UppsatserochResultat nr 208. Department of Operational Efficiency, Swedish Univer
-sity of Agricultural Sciences, Garpenberg.
Nurmi, J., 1986: Chunking and chipping with conescrew chip
-per. Folia Forestalia 659(12): 22 p.
Papworth, R.L., Erickson, J.R., 1966: Power requirements for producing wood chips. Forest Products Journal 16(10): 31–36. Röser, D., Mola-Yudego, B., Prinz, R., Emer, B., Sikanen,L., 2012: Chipping operations and efficiency in different opera
-tional environments. Silva Fennica 46(2): 275–286.
Routa, J., Asikainen, A., Björheden, R., Laitila, J., Röser,D., 2012: Forest energy procurement: state of the art in Finland and Sweden. WIREs Energy Environ 2012. doi: 10.1002/ wene.24.
Spinelli, R., Magagnotti, N., Paletto, G., Preti, C., 2011: Deter -mining the impact of some wood characteristics on the
per-formance of a mobile chipper. Silva Fennica 45(1): 85–95.
Spinelli, R., Cavallo, E., Facello, A., 2012: A new comminution device for high-quality chip production. Fuel Processing Tech
-nology 99: 69–74.
Spinelli, R., Magagnotti, N., 2012: The Effect of Raw Material, Cut Length, and Chip Discharge on the Performance of an Industrial Chipper. Forest Products Journal 62(7–8): 584–589. Spinelli, R., Cavallo, E., Eliasson, L., Facello, A., 2013: Compar
-ing the efficiency of drum and disc chipper. Silva Fennica 2013(2), article id. 930, 11 p.
Sun, H., Yang, L., Jing, J., 2010: Hydraulic/electric synergy system (HESS) design for heavy hybrid vehicles. Energy 35(12): 5328–5335.
Swedish Energy Agency, 2010: Motor data, IE2 and IE3 motors (Motordata, IE2- och IE3-motorer (50 Hz, 400 V), in Swedish),
available at www.energimyndigheten.se, downloaded on
15/03/2013.
Swedish Transport Administration, 2012: Climatic impact of
working machines and possible reductions. Data from the
Swedish Forest Agency, 2012.
Uhmaier, A., 1995: Some fundamental aspects on wood chip
-ping. Tappi Journal 78(10): 79–86.
Van Belle, J.-F., 2006: A model to estimate fossil CO2 emissions during the harvesting of forest residues for energy – with an application on the case of chipping. Biomass and Bioenergy 30(12): 1067–1075.
Yoshioka, T., Aruga, K., Nitami, T., Sakai, H., Kobayashi, H., 2006: A case study on the costs and the fuel consumption of
harvesting, transporting, and chipping chains for logging
residues in Japan. Biomass and Bioenergy 30(4): 342–348.
Received: December 20, 2013 Accepted: July 28, 2014
Authors’ address: Fulvio Di Fulvio, PhD.* e-mail: [email protected] Gunnar Eriksson, PhD. e-mail: [email protected] Dan Bergström, PhD.
e-mail: [email protected]
SLU, Swedish University of Agricultural Sciences Department of Forest Biomaterials and Technology Skogsmarksgränd, SE-901 83 Umeå
SWEDEN