Journal of Multidisciplinary Research in Healthcare Vol-2, No-2, April 2016 pp. 133–148
DOI: 10.15415/jmrh.2016.22009
Progress in Demographic and Other Factors and
Its Influence on Nutritional Status of Mothers and
Children in India
RAJARAM YADAV 1 KALOSONA PAUL2 ANDSHRESTHA SAHA 3
1Doctoral Fellow, International Institute for Population Sciences, Govandi station road, Deonar, Mumbai-400088, India,
2Doctoral Fellow, Tata Institute of Social Sciences, Govandi station road, Deonar, Mumbai-400088, India
3Doctoral Fellow, Jawaharlal Nehru University, New Delhi-400088, India,
Email:raja.smile85@gmail.com
Received: January 07, 2016| Revised: January 24, 2016| Accepted: February 18, 2016 Published online: April 04, 2016
The Author(s) 2016. This article is published with open access at www.chitkara.edu.in/ publications
Abstract
Background: It is well known that child nutrition is affected by many factors like socio-cultural, economic and demographic, etc. Studies found that
maternal education, wealth index, and ethnicity have an influence on child
nutrition. In this paper, comparative study of malnutrition among children and mothers between 1992-93 and 2005-06 has been done.
Objective: The main objective of the paper is to study how progress in
demographic and other socioeconomic factors influence nutritional status of
mother and children.
Data and Methods: First round (1992-93) and third round (2005-06) of National Family Health Survey has been used to reach the objective of the study. To show the progress in nutritional status, percentage change in prevalence of malnutrition in different background characteristics from 1992-93 to 2005-06 has been calculated. To show the progress in different background characteristics and its effect on child malnutrition decomposition analysis has been done.
Yadav, R Paul, K Saha, S
education and timing to initiate breastfeeding are found to be contributing
significantly to the reduction of underweight among children between
1992-93 and 2005-06.
Conclusion: This study shows that improvement in mother’s education contributed the most in improving the nutritional status of children. Thus by increasing the educational in female under-nutrition can be reduced to a larger extent.
Keywords: Nutrition, Stunting, Underweight, wasted, BMI, Oaxaca Decomposition Model,
1.
INTRODUCTION:Nutrition is the energy available to the body cells to fulfill the energy
requirement of the body and malnutrition is the state when a body doesn’t get required level of energy through food intake. Malnutrition among children is caused by inadequate or improper food intake or repeated attack of parasitic or other childhood diseases like diarrhea [11, 13]. NFHS – 1 has calculated percentage of malnourished children below age four as stunted(52%), underweight(54%) and wasted(17%) [8]. According to NFHS-3, 48% children
below five years were stunted, 42.5% underweight and 19.8% wasted. Mean
BMI of women in India was found to be 20.5 kg/m2 in 2005-06 and prevalence
of anemia among women was 55.3% [4]. The adolescent pregnancy wastage is considerably higher (15–20%) specially in case of teenage pregnancy [12]. The prevalence of overweight and obesity is higher among rural women than their tribal counterparts. Three standard indices of physical growth that describe the nutritional status of children are: height-for-age (stunting), weight-for-height (wasting) and weight-for-age (underweight), each of these three indicators is expressed in standard deviation units (Z-scores) from the median of the reference population [4]. Malnourishment or undernutrition is another common factor found among the children born to adolescent mothers. It has been categorized as acute and chronic considering the duration over which it occurred. The acute form of malnutrition mainly affects the weight of the body than height whereas in chronic malnutrition both weight and height of the body are affected. India has the highest percentage of malnourished children along with Ethiopia, Bangladesh and Nepal. Irrespective of state’s level of development, widespread diversity is found in the level of malnourishment of children in the country. [8].
Progress in Demographic and Other Factors and Its Influence on Nutritional Status of Mothers and Children in India
chronic malnutrition in children [1]. Malnutrition in developing countries is due to poor diet and exposure to repeated illness[10]. Better child nutrition is an important part of child health since nutrition during childhood makes a major contribution to child development, growth, and survival, ultimately
influencing the human and social capital of a society. The breastfeeding plays
a very important role in the post-neonatal period. The mother’s milk not only provides the complete nutritional requirements of the child but also provides protection against infections [5].
Socioeconomic well being of a family determines the nutritional intake of the children which affects the nutritional status of children to a large extent.
The main reason for steep rise in child malnutrition during first two years of
life is poor infant feeding practices [8]. The government of India promotes exclusive breast feeding up to six months of life and other supplementary foods after that. The modern science and technology has not been able to produce a better food for young infants that can replace mother’s milk. It is well known that child nutrition is affected by many factors like socio-cultural-economic and demographic etc. studies found that maternal education, wealth
index and ethnicity have influence on child nutrition [2]. The prevalence and severity of underweight children varied significantly by age. the prevalence
of stunting both moderate and severe form increases up to the age three and decline marginally thereafter, the rate of growth is maximum up to 36 month of life and lowers thereafter henace the prevalence is maximum at this age.
The stunting among children is lower among the first born children and higher
among children with birth order above three [7].
Malnutrition is costing poor countries up to 3 percent of their yearly GDP, malnourished in children decreases their life time earnings by about 10 percent. Malnourished children are more likely to join school late and drop
out early and also they are less likely to benefit from schooling and eventually
Yadav, R Paul, K Saha, S
states like Uttar Pradesh and Bihar this percentage is very high 76% and 70% respectively (estimated from NFHS-3).
Child malnutrition is highly associated with maternal education. The children whose mother has the only primary education or no education tend to have lower nutritional status in comparison to children whose mothers are more educated [9]. The age of the child, birth order, and household’s economic status all have independent effects on child nutritional status. Considering the
strong influence of maternal education on child nutritional status, the women’s
education and literacy program could play an important role in improving child
nutritional status [2]. The prevalence of malnutrition is high and diversification
of dietary intake is low in India. In 1999-2000 for average caloric intakes India was ranked at 67th among 167 countries, it means more than half of the
developing countries have a lower prevalence of under-nutrition than those of India. The states which are growing faster can improve literacy rates and reduce infant mortality rates and proportion of children severely malnourished [15]
2. DATA SOURCES
The main sources of the data which are used for this study are NFHS-1 and NFHS-3 which is available on Demographic Health Survey (DHS). The National Family Health Surveys (NFHS), initiated in the early 1990s, has emerged as a nationally important source of data on population health, and nutrition for India and its states. The third National Family Health Survey (NFHS-3), in 2005-06 was preceded by NFHS-1 in 1992-93 and NFHS-2 in 1998-99. NFHS-1 and NFHS-3 have designed to provide estimates of important indicators of family welfare, maternal, child health, and nutrition. Further, unlike the earlier surveys in which only ever-married women aged 15-49 were eligible for individual interviews, NFHS-3 interviewed all women aged 15-49 and all men aged 15-54. Information on nutritional status, including the prevalence of anemia, is provided in NFHS-3 for women aged 15-49, men aged 15-54, and young children. To assess nutritional status, NFHS-3 included an
anthropometric component, in which all children under five years of age were
weighed and measured. Three standard indices of physical growth that describe the nutritional status of children are stunting, underweight and wasted. NFHS-3 collected information on the height and weight of women aged 15-49 years.
3. METHODOLOGY
Progress in Demographic and Other Factors and Its Influence on Nutritional Status of Mothers and Children in India
of child below 2-SD is coded as stunted and 2-SD or above 2-SD is coded as non-stunted, whereas z-score for weight for age of child below 2-SD is coded as underweight and 2-SD or above 2-SD is coded as non-underweight and similarly z-score for weight for height of child below 2-SD is coded as wasted and 2-SD or above 2-SD is coded as non-wasted. In decomposition table the percentage contribution of selected background characteristics in bringing the change in prevalence of malnutrition among children from 1993 to 2006
has been shown. Almost all variable are significantly associated with child
malnutrition thus more contribution of any variable in bringing the change in prevalence of malnutrition shows the more progress in that variable from 1993 to 2006. The data analysis has been done using STATA version 12.0 and Arc GIS 10.1 software.
4. RANK CORRELATION:
Rank correlation has been calculated between mother’s underweight and children’s underweight by different background conditions or characteristics.
To calculate the rank correlation coefficients, 16 major states are ranked
according to the prevalence of underweight among women and children. Rank
correlation coefficient is calculated as follows
t= n−
− ρ
ρ 2
1 2 (i)
Where di is the difference between the rank of underweight among mothers
and children for the ith state, ρ is the correlation coefficient and n is the number
of states. The value of ρ lies between -1 to +1. If the value of ρ is negative, it
means ranks of both variables are going in opposite directions, and if its value is positive it means rank of both variables are going in the same direction.
If value of ρ is close to –1 or +1 it means there is a high linear correlation
between rank of two variables. If its value is close to 0 it means there is very low linear relationship between rank of two variables, and if its value is 0 then it implies that there is no linear relationship between the rank of two variables.
The significance of ρ values can be tested using:
t= n−
− ρ
ρ 2
1 2 (ii)
Yadav, R Paul, K Saha, S
5. OAXACA DECOMPOSITION MODEL
Decompositions are useful for quantifying the contribution of various factors to a difference or change in outcomes. If there are two groups A and B and an outcome variable y and a set of predictors ; for example let children surveyed in NFHS-1 and children surveyed in NFHS-3 from the two groups, and underweight among children and the demographic and socio-economic variables such as birth order of child, education of mother and economic status as the predictors. Then what we want to know is that how much of the mean difference outcome
R = E(YA) − E(YB) (iii)
Where E(Y) denotes the expected value of the outcome variable, is explained by a change in predictors. Based on the linear model.
6. RESULTS
Irrespective of the place of residence, the highest prevalence of under-weight children is recorded by Bihar while lowest prevalence is found in Kerala during both the time periods, i.e., 1993 and 2006. In rural areas, the largest decline in the prevalence of underweight from 1993 to 2006 is recorded by the state of Punjab whereas in urban areas the largest percentage change was noted in West Bengal (a fall of 47 percent).
Among children with birth order less than three, Punjab shows the maximum fall in prevalence of underweight (50.6%) followed by Tamil Nadu, which showed a decline of 42.9 percent. On the contrary, the neighbouring state Haryana shows an increase in the prevalence by 8.4 percent. Among children with birth order three and above, 33.7% decrease in prevalence of underweight was revealed by Andhra Pradesh followed by Punjab (31.8%). The Haryana and two EAG states Madhya Pradesh and Rajasthan have seen a positive increase in the prevalence of underweight from 1993 to 2006 by 6.2, 4.2 and 9.1 percent respectively.
Among children with preceding birth interval less than 36 months, the highest percentage of decline (39.7%) in the prevalence of underweight was reported by Andhra Pradesh. Two major states Haryana and Madhya Pradesh have revealed an increase in the prevalence of underweight of 6.4 and 1.6 percent respectively from 1993 to 2006.
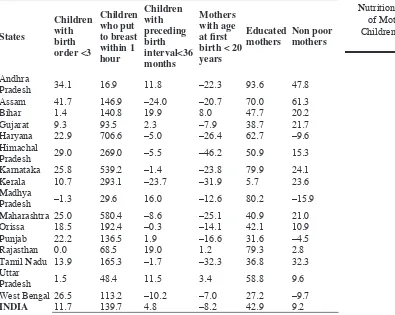
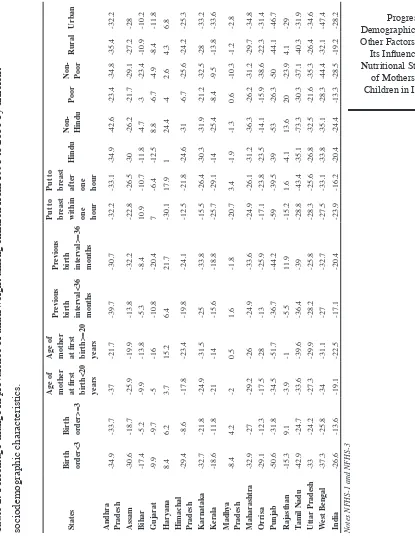
Progress in Demographic and Other Factors and Its Influence on Nutritional Status of Mothers and Children in India Table 1: Percentage change in proportion of children and mother s by
different demographic characteristics from 1993 to 2006.
States
Children with birth order <3
Children who put to breast within 1 hour
Children with preceding birth interval<36 months
Mothers with age at first birth < 20 years
Educated
mothers Non poor mothers
Andhra
Pradesh 34.1 16.9 11.8 –22.3 93.6 47.8
Assam 41.7 146.9 –24.0 –20.7 70.0 61.3
Bihar 1.4 140.8 19.9 8.0 47.7 20.2
Gujarat 9.3 93.5 2.3 –7.9 38.7 21.7
Haryana 22.9 706.6 –5.0 –26.4 62.7 –9.6
Himachal
Pradesh 29.0 269.0 –5.5 –46.2 50.9 15.3
Karnataka 25.8 539.2 –1.4 –23.8 79.9 24.1
Kerala 10.7 293.1 –23.7 –31.9 5.7 23.6
Madhya
Pradesh –1.3 29.6 16.0 –12.6 80.2 –15.9
Maharashtra 25.0 580.4 –8.6 –25.1 40.9 21.0
Orissa 18.5 192.4 –0.3 –14.1 42.1 10.9
Punjab 22.2 136.5 1.9 –16.6 31.6 –4.5
Rajasthan 0.0 68.5 19.0 1.2 79.3 2.8
Tamil Nadu 13.9 165.3 –1.7 –32.3 36.8 32.3
Uttar
Pradesh 1.5 48.4 11.5 3.4 58.8 9.6
West Bengal 26.5 113.2 –10.2 –7.0 27.2 –9.7
INDIA 11.7 139.7 4.8 –8.2 42.9 9.2
Notes NFHS-1 and NFHS-3
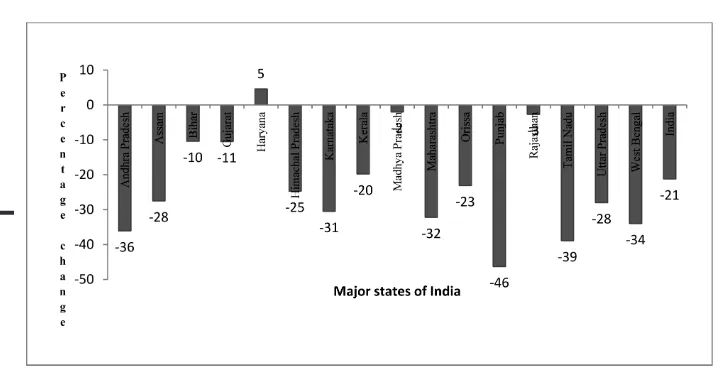
The highest decline (46%) was found in Punjab followed by Tamil Nadu whereas in Haryana the prevalence of underweight has been increased by 4.6 percent. At the national level, the percentage decline in the prevalence of underweight is revealed at 21.2 percent (Fig1).
In 1993, Kerala followed by Tamil Nadu has the highest percentage of
children with birth order less than three. In 2006 Kerala sustained its first
Yadav, R Paul, K Saha, S
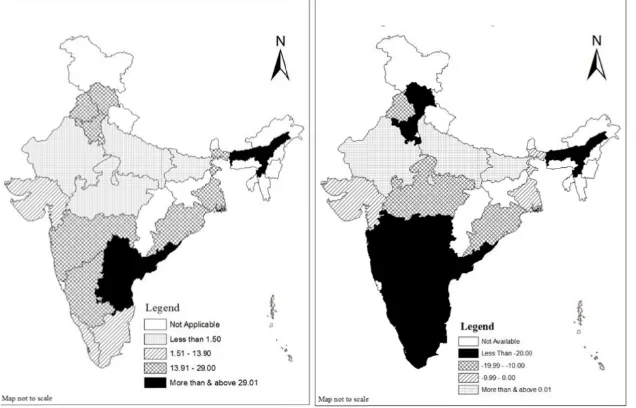
change in proportion of children with birth order less than three. In 2006, Uttar Pradesh was the state where proportion of children with birth order less than three was lowest. In 1993, the highest percentage of mothers with age
at first birth less than twenty years was shown by Andhra Pradesh followed
by West Bengal and lowest percentage was reported by Kerala. In 2006, the
highest percentage of mothers with age at first birth less than twenty years
was shown by West Bengal followed by Uttar Pradesh and lowest percentage was shown by Himachal Pradesh followed by Kerala. Himachal Pradesh has shown highest percentage change (-46.2% ) in the proportion of mothers with
age at first birth less than twenty years (Fig 2a and 2b).
In 1993 the state which shows the highest percentage of children with preceding birth interval of less than 36 months is Karnataka followed by Haryana and lowest percentage of children with preceding birth interval less than 36 months was shown by Kerala followed by Bihar. In 2006, it was Madhya Pradesh which has the highest percentage of children with preceding birth interval of fewer than 36 months whereas Kerala has the lowest percentage of such children. Kerala has shown highest percentage change (23.7% decrease) among children with preceding birth interval of less than 36 months. In 1993 and in 2006 , it was found that Tamil Nadu has the highest percentage of children who breastfed within one hour after birth whereas Bihar and Uttar Pradesh has the lowest percentage of such children. Highest percentage change among children breastfed within one hour after birth was shown by Haryana where there was 706.6% increase of children breastfeed within one hour after birth from 1993 to 2006 (Fig 3a and 3b).
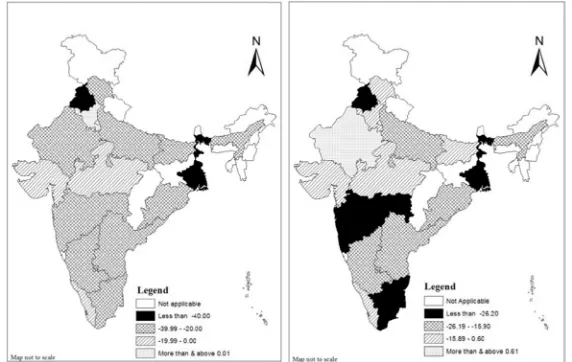
Figure 1:
Percentage change in prevalence of underweight among
Progress in Demographic and Other Factors and Its Influence on Nutritional Status of Mothers and Children in India
Figure 2a: Percentage change in proportion of children with birth order <3 from 1993–2006.
Figure 2b: Percentage change in
proportion of mothers whose age at first
birth is <20 years from 1993–2006..
Figure 3a: Percentage change in proportion of children with preceding birth interval <36 months from 1993–2006.
Yadav, R Paul, K Saha, S
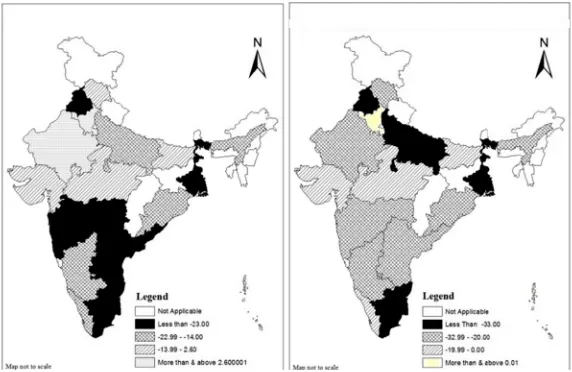
Among children who belong to a poor family, the highest percentage (30.3 %) decline in the prevalence of underweight was shown by Tamil Nadu followed by West Bengal where percentage decline is 28.3 whereas Madhya Pradesh and Rajasthan has experienced an increase in the prevalence of underweight in children by 0.6 and 20.0 percent respectively. Among children who belong to a non-poor family, the highest percentage (50 %) decline in the prevalence of underweight was shown by Punjab followed by West Bengal where percentage decline is 44.4. The state of Haryana has shown an increase in the prevalence of underweight by 2.6 percent in this category of children (Fig 5a and 5b).
Rank correlation coefficients between underweight mother and underweight
children have been calculated for 16 major states. Rank of states, according to the mothers’underweight as well as children underweight in rural areas are
correlated at 5% level of significance. The result indicates that states ranks
in both variables are highly correlated. The analysis was further extended to scheduled caste (SC) and scheduled tribe (ST) population. Rank of states by SCs or STs underweight mothers and SCs/STs underweight children are correlated
at 5% level of significance. Rank of states among mother’s underweight and children underweight are correlated at 1% level of significance this means that
states ranks in both variables are highly correlated (Table 3).
Figure 4a: Percentage change in prevalence of underweight among children whose mother are educated from 1993–2006.
Progress in Demographic and Other Factors and Its Influence on Nutritional Status of Mothers and Children in India
Table 2:
Percentage change in prevalence of underweight among children from 1993 to 2006 by different
sociodemographic characteristics. States Birth order<3 Birth order>=3 Age of mother at first birth<20 years Age of mother at first birth>=20 years
Pr
evious
birth inter
val<36
months
Pr
evious
birth inter
val>=36
months
Put to breast within one hour Put to breast after one hour
Hindu
Non- Hindu
P
oor
Non- Poor
Rural
Urban
Andhra Pradesh
-34.9 -33.7 -37 -21.7 -39.7 -30.7 -32.2 -33.1 -34.9 -42.6 -23.4 -34.8 -35.4 -32.2 Assam -30.6 -18.7 -25.9 -19.9 -13.8 -32.2 -22.8 -26.5 -30 -26.2 -21.7 -29.1 -27.2 -28 Bihar -17.4 -5.2 -9.9 -13.8 -5.3 -8.4 10.9 -10.7 -11.8 -4.7 -3 -23.4 -10.9 -10.2 Gujarat -9.9 -9.7 -5 -16 -10.8 -20.4 7 -6.4 -12.5 8.8 -6.7 -4.9 -8.4 -11.8 Haryana 8.4 6.2 3.7 15.2 6.4 21.7 -30.1 17.9 1 24.4 -4 2.6 4.3 6.8
Himachal Pradesh
-29.4 -8.6 -17.8 -23.4 -19.8 -24.1 -12.5 -21.8 -24.6 -31 -6.7 -25.6 -24.2 -25.3 Kar nataka -32.7 -21.8 -24.9 -31.5 -25 -33.8 -15.5 -26.4 -30.3 -31.9 -21.2 -32.5 -28 -33.2 K erala -18.6 -11.8 -21 -14 -15.6 -18.8 -25.7 -29.1 -14 -25.4 -8.4 -9.5 -13.8 -33.6 Madh ya Pradesh -8.4 4.2 -2 0.5 1.6 -1.8 -20.7 3.4 -1.9 -1.3 0.6 -10.3 -1.2 -2.8 Maharashtra -32.9 -27 -29.2 -26 -24.9 -33.6 -24.9 -26.1 -31.2 -36.3 -26.2 -31.2 -29.7 -34.8 Orrisa -29.1 -12.3 -17.5 -28 -13 -25.9 -17.1 -23.8 -23.5 -14.1 -15.9 -38.6 -22.3 -31.4 Punjab -50.6 -31.8 -34.5 -51.7 -36.7 -44.2 -59 -39.5 -39 -53 -26.3 -50 -44.1 -46.7 Rajasthan -15.3 9.1 -3.9 -1 -5.5 11.9 -15.2 1.6 -4.1 13.6 20 -23.9 4.1 -29 Tamil Nadu -42.9 -24.7 -33.6 -39.6 -36.4 -39 -28.8 -43.4 -35.1 -73.3 -30.3 -37.1 -40.3 -31.9 Uttar Pradesh -33 -24.2 -27.3 -29.9 -28.2 -25.8 -28.3 -25.6 -26.8 -32.5 -21.6 -35.3 -26.4 -34.6 W est Bengal -37.3 -25.8 -34 -31.1 -27 -32.7 -27.5 -33.1 -33.8 -35.1 -28.3 -44.4 -32.1 -47.4 India -26.6 -13.6 -19.1 -22.5 -17.1 -20.4 -23.9 -16.2 -20.4 -24.4 -13.3 -28.5 -19.2 -28.2
Yadav, R Paul, K Saha, S
Figure 5a: Percentage change in prevalence of underweight among children who are Non–poor from 1993–2006.
Figure 5b: Percentage change in prevalence of underweight among children who are poor from 1993– 2006.
Table 3: Rank correlation coefficient between mother underweight and
children underweight among major states of India NFHS-3.
Mother underweight Children
underweight Rural Urban Poor SC/ST Educated Uneducated Total t value cal.
Rural 0.61** 2.85
Urban 0.58** 2.68
Poor 0.43 1.78
SC/ST 0.74*** 4.09
Educated 0.42 1.75
Uneducated 0.59** 2.74
Total 0.71*** 3.79
Authors calculated
Progress in Demographic and Other Factors and Its Influence on Nutritional Status of Mothers and Children in India
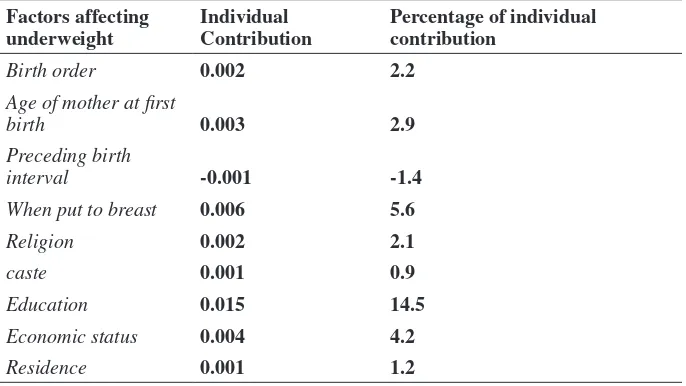
percentage points has been observed. The overall background characteristics taken in the table can explain 32.2 percent of total change in the probability of underweight among children from 1993 to 2006. Mothers education contributed 14.5 % change in the probability of underweight among children from NFHS1 to NFHS3. The other factors like the time when a child put to breast, economic status, birth order, and age of mother has contributed 5.6%,4.2%,2.2% and 2.9 percent respectively.
Table 4:
Oaxaca decomposition Model to show the contribution
of each factor in decreasing the prevalence of underweight among
children from 1993 to 2006.
Total number of observations 41284
Number of observations in 1993 20251
Number of observations in 2006 21033
Probability of underweight in 1993 0.501
Probability of underweight in 2006 0.397
Difference in probability of underweight 0.104
Total difference in probability explained 0.033
Total percentage contribution in explaining
difference 32.2
Contribution of factors in decreasing the prevalence of underweight among children from 1993 to 2006
Factors affecting
underweight Individual Contribution Percentage of individual contribution
Birth order 0.002 2.2
Age of mother at first
birth 0.003 2.9
Preceding birth
interval -0.001 -1.4
When put to breast 0.006 5.6
Religion 0.002 2.1
caste 0.001 0.9
Education 0.015 14.5
Economic status 0.004 4.2
Residence 0.001 1.2
Yadav, R Paul, K Saha, S
DISCUSSION
Kumar and others showed that delay in initiation of breastfeeding and higher birth order of the child increases the risk of underweight [6]. NFHS reports showed that delay in initiation of breastfeeding and proportion of children having higher birth order have decreased between 1993 to 2006 (NFHS-I
report, 1993 and NFHS-III report, 2006). These two findings support our
study that these two factors played a crucial role in lowering the prevalence of underweight in children between the period of 1993 to 2006. Mishra and others studied that education has a strong positive association with child
malnutrition (Mishra and others, 2000), which support the finding of this study that education has contributed significantly to reduce under-nutrition
among children between 1993 and 2006. As seen higher female education,
ANC, institutional delivery, etc plays a significant role in affecting child health
status and all these factors can only be ensured with a higher age of the mother. Higher education of girls leads to higher age at marriage. Furthermore, higher age at marriage along with the higher level of education empowers the women to have her decision-making abilities as well as high autonomy. Thus women having high autonomy may have their own decision power regarding their health seeking behavior like access to reproductive health services, family planning measures etc. All these will lead to better child health status.
This study suggests that any policy formulation to improve the malnutrition status of women and children cannot downplay the role of demographic behavior at the individual level. Otherwise, direct and curative measures to arrest the malnutrition level for any these two important segments (children and mothers) of our population may not yield desired outcomes.
CONCLUSION
As far as nutrition level of children is concerned, Haryana shows the maximum change in percentage of stunted and wasted children, followed by Rajasthan and Jharkhand. Poverty, lack of nutritional food, low breastfeeding of infants due to mother’s employment (mostly daily wage laborers), low mother education are the main causes of under nutrition in children (GOI, 2012). The decomposition analysis clearly shows that the condition of mother’s education
and timing to initiate the breastfeeding are the significantly contributing
factors to the reduction of underweight among children in the period of 1993
to 2006. Mother’s age at first birth and birth order also have played a crucial
role in lowering the prevalence of underweight among children during 1993 and 2006. Finally, the demographic and health dimensions like birth spacing,
Progress in Demographic and Other Factors and Its Influence on Nutritional Status of Mothers and Children in India
of breastfeeding have shown evidence that they play an important role in deciding the nutritional status of children as well as mothers. The results of the rank Correlation analysis clearly shows that states with poor nutritional level among women also lag behind in nutritional level among children. The nutritional health policy in India requires an effective and responsive public health system bat the state/region/district level to provide easy access to health care services. There is a greater need basic education for compulsory to the lower age of marriage girls cohort population. Additionally, in India, several schemes and policies should be launched at the gross root level for particular of adolescent mothers and their child, to ensure their proper health system.
REFERENCES
[1] Gillespie, S., & McNeill, G. (1992). Food, health and survival in India and developing countries. Oxford University Press.
[2] Griffiths, P., Matthews, Z., & Hinde, A. (2002). Gender, family, and the nutritional status of children in three culturally contrasting states of India.Social science & medicine, 55(5), 775–790.
[3] International Institute For Population Sciences (IIPS) and Macro International (2007) National Family Health Survey (1993), 1992-93 India Vol. 1 Mumbai IIPS.
[4] International Institute For Population Sciences (IIPS) and Macro International (1994) National Family Health Survey (2006), 2005-06 India Vol. 1 Mumbai IIPS.
[5] Jelliffe, D. B., & Jelliffe, E. P. (1978). Human milk in the modern world.British medical journal, 2(6151), 1573.
[6] Kumar, D., Goel, N. K., Kalia, M., & Mahajan, V. (2015). Socio-demographic Factors Affecting the Nutritional Status of the Under Three Children in Chandigarh, UT. Healthline, Journal of Indian Association of Preventive and Social Medicine, 6(1), 46–52.
[7] Mendelson, S., & Chaudhuri, S. (2009). Child malnutrition in India: Why does it persist. visto el, 20.
[8] Mishra, V. K., Lahiri, S., & Luther, N. Y. (1999). Child nutrition in India. [9] Mishra, V. K., & Retherford, R. D. (2000). Women’s education can improve
child nutrition in India.
[10] Mosley, W. H., & Chen, L. C. (1984). An analytical framework for the study of child survival in developing countries. Population and development review, 25–45. [11] Pelletier, D. L. (1994). The relationship between child anthropometry and
Yadav, R Paul, K Saha, S
[12] Rao, S. (2001). Nutritional status of the Indian population. Journal of biosciences, 26(4), 481-489.
[13] Ruzicka, L. T., & Kane, P. (1985). Nutrition and child survival in South Asia. [14] Van de Poel, E., Hosseinpoor, A. R., Speybroeck, N., Van Ourti, T., & Vega,
J. (2008). Socioeconomic inequality in malnutrition in developing countries. Bulletin of the World Health Organization, 86(4), 282-291.