AUT J. Elec. Eng., 50(2) (2018) 163-168 DOI: 10.22060/eej.2018.13484.5167
A Multi-objective Transmission Expansion Planning Strategy: A Bilevel Programming Method
S. Zolfaghari-Moghaddam1*, T. Akbari21 Faculty of Electrical Engineering, Urmia University of Technology, Urmia, Iran 2 Department of Electrical Engineering, Pooyesh Institute of Higher Education, Qom, Iran
ABSTRACT: This paper describes a methodology for transmission expansion planning (TEP) within a
deregulated electricity market. Two objective functions including investment cost (IC) and congestion cost (CC) are considered. The proposed model forms a bi-level optimization problem in which upper level problem represents an independent system operator (ISO) making its decisions on investment while in the lower level, the market clearing problem is formulated. ISO tries to minimize the investment cost on new transmission capacity to be installed and to minimize the congestion cost. Minimizing the CC can facilitate the competition between market participants. Locational marginal prices (LMPs) which are necessary to be calculated for the congestion cost are obtained at the lower level. The LMP of buses are dual variables of the corresponding active power balance equation. Lower problem is replaced by its Karush-Kuhn-Tucker (KKT) conditions resulting in a one-level optimization problem which can be efficiently solved by commercial existing solvers. The formulated multi-objective mathematical
programming is solved by augmented ε-constraint method which is able to produce the Pareto-optimal
solutions. The presented framework is applied to a simple 3-bus power system and also IEEE 24-bus reliability test system (RTS). Results from these illustrative examples are reported and thoroughly discussed. The results show the effectiveness of the presented work.
Review History:
Received: 27 September 2017 Revised: 19 September 2018 Accepted: 6 November 2018 Available Online: 11 November 2018
Keywords:
Bi-level Optimization Congestion Cost
Karush-Kuhn-Tucker Conditions Multi-Objective Optimization, Transmission Expansion Planning
1- Introduction
Fundamental changes have been introduced to power system planning and operation due to the liberalization and deregulation of the global power industry [1]. In this new deregulated framework, transmission part of the system plays an important role in order to provide a nondiscriminatory environment to all market participants [2, 3]. Transmission expansion problem (TEP) is a stochastic decision-making problem which determines the time, the location and the type of the transmission lines to be built in the whole power system [4].
An appropriate strategy for TEP guarantees an impartial competition within the market as the system generation capacity and load demand grow. [5]. In this market environment an independent system operator is responsible to expand the network to meet the future growing demand while generation expansion is the task of generating companies competing to maximize their own profit.
Numerous studies have been performed in this area. A flexible transmission planning considering distributed generation (DG) impacts is proposed by [6]. References [7, 8] use alternating current optimal power flow for TEP. The DGs are now expected to play a vital role in the provision of future electricity demand. Also, since the planner will face many uncertainties during the planning process, many researches have been focused on this topic. An internal scenario analysis based on a multi-objective model is proposed by [9] in which three objective functions are considered: Total Social Cost (TSC), maximum regret (robustness criterion), and maximum adjustment cost (flexibility criterion). A multi-period
transmission planning problem considering available transfer capability is presented in [10] that takes load uncertainty into account by considering several scenarios generated by Monte Carlo simulation (MCS). In [11], the transmission network capacity expansion planning is studied by considering the load uncertainty using benders decomposition.
for the augmentation of transmission networks considering strategic behaviors of generating companies. An Integrated generation and transmission expansion planning including power and fuel transportation constraints is investigated in [18]. The requirement of composite expansion planning of generation and transmission lines is recognized for a long time in [19].
In this paper a novel structure and model is presented for transmission expansion planning considering two objective functions: 1- investment cost which is usually considered as one of the main objectives to be minimized in all planning models and 2- Congestion cost. The minimization of the latter objective function will facilitate the competition among all market participants, since the lack of transmission capacity and any bottlenecks in transmission networks will prevent perfect competition. The formulation of the proposed model which is presented in the next section falls into a bi-level optimization model. The bi-level programming problem (BPP) is handled by replacing the lower level by its Karush-Kuhn-Tucker (KKT) conditions and then solving the obtained optimization problem by available software. Also, the multi-objective optimization is addressed using constraint method which will be described briefly in the next section. The presented model to expand the transmission network is novel and has not been presented earlier. It should be highlighted that dealing with uncertainties is not an issue of this paper. 2- Model Representation
In the upper problem, ISO’s decision is made. Decision variables for the ISO is the binary variable of . In objective functions of (1), ISO tries to minimize the investment cost on new transmission capacity to be installed and to minimize the congestion cost. Locational marginal prices (LMPs) are obtained at the lower level. In the lower level problem, market clearing problem of ISO is formulated in which ISO minimizes the system operation cost. The LMP of buses are dual variables of the corresponding active power balance equation. Demand is considered to be inelastic which has to be met accordingly.
2- 1- Problem formulation
The problem formulation considering two objective functions is as follows:
(1) ( )
(
)
( )(
)
,max , , min c ij ij iji j b
ij j i
i j b
IC ic u f
CC f lmp lmp
∈Ψ ∈Ψ = = −
∑
∑
Subject to: (2) e ci i ij ij
j b j b
g d f f i b
∈Ψ ∈Ψ
− =
∑
+∑
∀ ∈ Ψ(3)
( )
( )
,
e e
ij ij ij
f
= −
γ
∆
θ
∀
i j
∈ Ψ
b
(4)
( )
( )
,
c c c
ij ij ij ij
f
=
u
−
γ
∆
θ
∀
i j
∈ Ψ
b
(5)
,
ij i j
i j
b
θ
θ θ
∆
= −
∀
∈ Ψ
(6)
,max ,max
,
e e e
ij ij ij
f
f
f
i j
b
−
≤
≤
∀
∈ Ψ
(7)
,max ,max
,
c c c
ij ij ij
f
f
f
i j
b
−
≤
≤
∀
∈ Ψ
(8)
max
0
≤
g
i≤
g
i∀ ∈ Ψ
i
b
,
arg min
i
i g i i
i b
lmp
i
b
c g
∈Ψ
∀ ∈ Ψ ∈
∑
subject to:
(9)
:
e c
i i ij ij i
j b j b
g d f f lmp i b
∈Ψ ∈Ψ
− =
∑
+∑
∀ ∈ Ψ(10)
( )
( )
:
,
e e e
ij ij ij ij
f
= −
γ
∆
θ
ξ
∀
i j
∈ Ψ
b
(11)
( )
( )
:
,
c c c c
ij ij ij ij ij
f
=
u
−
γ
∆
θ
ξ
∀
i j
∈ Ψ
b
(12)
: ,
ij i j ij i j b
θ
θ θ
υ
∆ = − ∀ ∈ Ψ
(13)
,max ,max : , ,
e e e e e
ij ij ij ij ij
f f f
α α
i j b− ≤ ≤ ∀ ∈ Ψ
(14)
,max ,max : , ,
c c c c c
ij ij ij ij ij
f f f α α i j b
− ≤ ≤ ∀ ∈ Ψ
(15)
}
max
0
≤
g
i≤
g
i: ,
α α
i i∀ ∈ Ψ
i
b
Constraint (2) enforces the power balance at every bus. Constraints (3) and (4) represent the power flow through each existing and candidate line. Equations (6) and (7) establish the thermal limits of lines. Power generation of each generator is limited by (8). Equations (9) to (15) are the constraints of the lower level problem. Note that variables are taken as parameter in the lower level since they are obtained from the first level problem.
2- 2- Solution methodology
The solution is based upon the replacing the lower-level problem by its KKT conditions. It should be highlighted that since the lower-level problem is continuous and linear, KKT conditions are necessary and sufficient to obtain the global optimal solution. It is to be noted that c
ij
u
is not an optimization variable in the second level and it is taken as a parameter by ISO. Therefore, the obtained one-level optimization problem is as follows:(16) ( )
(
)
( )(
)
,max , , min c ij ij iji j b
ij j i
i j b
IC ic u f
CC f lmp lmp
∈Ψ ∈Ψ = = −
∑
∑
subject to: (17)( ) ( )
2 − 8KKT conditions of lower-level problem:
(18)
0 :
i i i i i
(19) 0 : ,
e e e e
i ij ij ij ij
lmp −ξ −α +α = f ∀i j∈ Ψb
(20) 0 : ,
c c c c
i ij ij ij ij
lmp −ξ −α +α = f ∀i j∈ Ψb
(21)
( ), ( ),
0
: ,
e e c c c
ij ij ij ij ij ij i j b i j b
ij
u
i j b
ξ γ
ξ γ
υ
θ
∈Ψ ∈Ψ
+ − =
∆ ∀ ∈ Ψ
∑
∑
(22)
0 :
ij ji i
j
i b
υ υ− = θ ∀ ∈ Ψ
∑
(9)-(15) which is equivalent to (2)-(8)
(23)
(
,max) ( )
0 e e e 0 : ,
ij ij ij
f f α i j b
≤ + ⊥ ≥ ∀ ∈ Ψ
(24)
(
,max) ( )
0 e e e 0 : ,
ij ij ij
f f α i j b
≤ − ⊥ ≥ ∀ ∈ Ψ
(25)
(
,max) ( )
0 c c c 0 : ,
ij ij ij
f f α i j b
≤ + ⊥ ≥ ∀ ∈ Ψ
(26)
(
,max) ( )
0 c c c 0 : ,
ij ij ij
f PL α i j b
≤ − ⊥ ≥ ∀ ∈ Ψ
(27)
0≤gi ⊥αi ≥0 :∀ ∈ Ψi b
(28)
(
max)
0≤ gi −gi ⊥αi ≥0 :∀ ∈ Ψi b
2- 3- Augmented –constraint method
Two of the most widely accepted techniques to solve the MMP (Multi-Objective Mathematical Programming) problems that have been extensively employed by researchers are the weighting method and ε-constraint method. So as to apply the ε-constraint method, the ranges of at least k-1 objective functions are needed to be used as constraints. These ranges can be calculated from the payoff table that has been demonstrated in reference [20]. Since IC is the main objective function, only the ranges of CC should be determined. These ranges are divided by q2. Regarding the minimum and maximum values of the ranges, we have the total of (q2+1) grid points for CC. Hence, it should be solved (q2+1) optimization sub-problems in which sub-problem i is as below:
(29)
( )
( )
( )
( )
( )
2 1
2
2 2 2
2 2
2 2
2
2
:
; 0,1 ,, 2, ,
i
i
s Min F x
r subject to F x s
Max F Min F
Max F i
q
i q
δ
ε
ε
− ×
+ = −
= − ×
= …
3- Simulation results
The model has been applied successfully to a simple 3-bus power system and IEEE 24-bus reliability test systems (RTS). This problem was solved on a PC running windows operating system with Core 2 Duo CPU, clocking at 2.00 GHz and 1 GB of RAM. GAMS (General Algebraic Modeling System) is used to solve the problem [21].
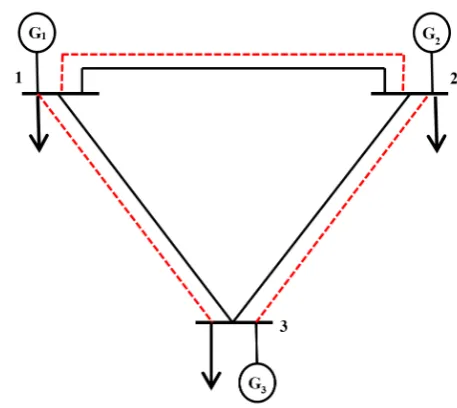
3- 1- Case study A: 3-bus power system
The 3-bus power system is shown in Fig. 1. Existing lines are solid black lines and candidate ones are shown in dash line
with red color.
The existing transmission lines capacity is set to be 25 MW. Susceptance of all existing and candidate lines is assumed to be e c 50 Ù.
ij ij
γ =γ = − icij is set to be 5 10× 3 $/MW. Cost function of generators 1, 2 and 3 are equal 100, 130 and 180 $/MWh. Demand at bus1, 2 and 3 is 0, 100 and 150 MW, respectively. Maximum active power generation of generators 1, 2 and 3 are 80, 250 and 100 MW, respectively.
If objective function is only considered to be investment cost (IC), then no candidate line is selected to be built within the planning horizon. Power flow through existing lines 1-2, 1-3 and 2-3 is 0, 25 and 25 MW. Each of the generators 1, 2 and 3 produces 25, 125 and 100 MW, respectively. LMP at buses 1, 2 and 3 equals 100, 130 and 180 $/MWh. Value of congestion cost in this case will be 3250 $/h. If objective function is only considered to be congestion cost (CC), then all candidate lines are selected to be constructed. Each of the generators 1, 2 and 3 produces 80, 170 and 0 MW, respectively. Since there is no congestion in transmission lines, LMP at buses 1, 2 and 3 is equal (130 $/MWh). This means that in LMP-based electricity markets all customers would pay the same price for electricity, and also all producers will be charged with the same price. On the one hand, the transmission network has prepared a nondiscriminatory and competitive environment for all market players. This can be achieved with regarding the congestion cost as one of the objective function. Congestion cost in this case is 0 $/h.
The payoff table for this illustrative example has been shown in Table 1. Also, the set of Pareto optimal solutions is depicted in Fig. 2. As it can be seen, as the investment in transmission sector is increased, the congestion cost is reduced. The reduction in congestion cost indicates the competition enhancement for generating companies, as discussed earlier. For instance, when the investment cost is considered as the only objective function, generator 1 (the cheapest one) generates 25 MW, whereas it is able to produce 55 MW more
Fig. 1. A simple 3-BUS test system
Table 1. Payoff table for 3-bus power system
IC [$] CC [$/h]
IC [$] 0 3250
additional power. At the same time, generator 3 (the most expensive one) operates with its full capacity. This clearly shows the imperfect competition among market players. On the other hand, when congestion cost is considered as the only objective function, generator 1 works at its full capacity and generator 3 is never dispatched. Solution time for this case is about 0.3 s. The total number of variables and constraints is 655 and 874, respectively.
This simple example clearly shows that there is a conflict between the two objective functions, i.e. investment cost and congestion cost. If the planner minimizes the investment cost, then congestion cost will increase and vice versa. Therefore, using multi-objective optimization is necessary to be employed to handle such a problem.
3- 2- Case study B: IEEE 24-bus RTS
The standard IEEE 24 bus RTS as shown in Fig. 3 is used as the second example. Detailed data can be found in [22]. This power system comprises of 32 generating units (10 plants), 17 loads and 38 transmission lines. Area 1 is the 138 kV sub-network and area 2 is the 230 kV sub-sub-network and 5 tie lines have connected these two areas. The capacity of all existing
transmission lines is 175 MW in 138 kV part and 500 MW in 230 kV part of the power system. Transformer capacity is 400 MW. Admittance of all candidate lines is assumed to be
(
30 Ù.)
e c
ij ij
Y =Y = j − icij is set to be 5 10× 3 $/MW. A linear cost function as defined in Table 1 is considered for units. It is to be noted that in order to put the transmission system under more pressure, the transmission capacity have been multiplied by a factor of 0.8. In the base case, i.e. with original transmission capacities, no new capacities is required.
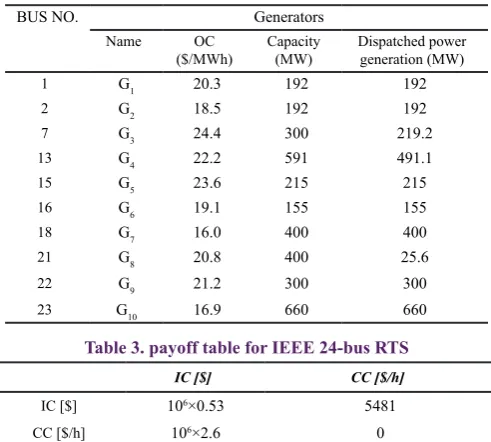
If the IC is considered as the only objective function, candidate lines of corridors 7-10, 9-10 and 14-19 are chosen. The power flow through these lines is 41.65, 28.97 and 107.64 MW, respectively. It is required to construct these lines in order to maintain the security of the power system and to avoid load curtailment throughout the power system. There are two congested lines and three marginal units. Dispatched power generations are shown in Table 2. As it can be seen, generators 3, 4 and 8 are marginal units which will lead to three different values of LMP in the whole power system. Loads and generators will be paid, and they receive different prices. The congestion cost in this case is 5481 $/h. If CC is the only objective function to be minimized, then with investing equal to 2.6 10× 6 $, the CC will be 0 $/h. Table 3 shows the payoff table for IEEE 24 bus RTS.
Considering q2=10 and solving the multi-objective optimization problem using ε-constraint method, a set of Pareto optimal solution is obtained which has been plotted in Fig. 4. As it can be observed form Fig. 4. as the investment cost increases, the congestion cost decreases. Therefore, there is always a trade-off between these two objective functions. To select the best solution among the obtained results, one may use fuzzy satisfying decision-making method as demonstrated in [23].
The solution time for this case is about 6.5 s. The total number of variables and constraints is 194813 and 367953. In order to show the efficiency of the proposed model in increasing competition among all players, we have shown the total production cost versus congestion cost in Fig. 5. As it can be seen from this figure, as the congestion cost reduces, the total
0 0.5 1 1.5 2 2.5
Investment Cost ($) 105
0 2000 4000 6000 8000 10000 12000 14000 16000 18000
Congestion Cost ($)
Fig. 2. Congestion cost versus investment cost for 3-bus power system
22 18
17
21
23
20 19
16
14
15
13
11 12
24
9 10
3
6
5 4
2
1 7
8
Fig. 3. IEEE 24-BUS RTS
Table 2. GEneration data of Ieee 24-bus rts
BUS NO. Generators
Name OC
($/MWh) Capacity (MW) Dispatched powergeneration (MW)
1 G1 20.3 192 192
2 G2 18.5 192 192
7 G3 24.4 300 219.2 13 G4 22.2 591 491.1
15 G5 23.6 215 215
16 G6 19.1 155 155
18 G7 16.0 400 400
21 G8 20.8 400 25.6
22 G9 21.2 300 300
23 G10 16.9 660 660
Table 3. payoff table for IEEE 24-bus RTS IC [$] CC [$/h]
IC [$] 106×0.53 5481
production cost is decreased as well. This means the proposed approach is an efficient way for improving competition among generating companies, since the cheaper generators are committed to meet the demand leading to the less production cost. However, this more competition is achieved at the cost of more investment cost. Indeed, there is always a trade-off between the investment cost and the congestion cost. Note that the decision-maker in the proposed model is able to select the best optimal solution via the proposed multi-objective optimization model.
4- Conclusion
This paper presents a novel structure of transmission planning which improves the competition in wholesale electricity markets and provides nondiscriminatory access to transmission network. Also it enables consumers to seek
the lowest prices for electricity. The problem formulation forms a bi-level optimization problem which is handled by transforming the lower level problem into its KKT conditions. It uses the -constraint method to deal with two objective functions and to solve the multi-objective optimization. The proposed method is applied to two power systems to illustrate the model. Results from the case studies signify the effectiveness and applicability of the presented model. For the planned systems, a lower and flatter locational marginal price (LMP) profile is predicted, and this is observed in cases studied, since minimizing the congestion cost is one of the objective functions as well as the investment cost.
Nomenclature
Sets
i, j Index for buses
b
Ψ
Set of all busesParameters
e ij
y
Susceptance of existing line ijc ij
y
Susceptance of candidate line ijij
i
c
Unitary investment cost of line iji
d Active power demand at bus i
max i
g Maximum capacity of generator i
max e, ij
f
Capacity of existing line ijmax c, ij
f
Capacity of candidate line ijVariables
i
g Power generation at bus i
e ij
f
Power flow in existing line ijc ij
f
Power flow in candidate line ijc ij
u
Binary variables associated to candidate line ij cij
z
An auxiliary variable in order to linear-ize equationsi
θ
Voltage angle at bus ic ij e ij
i
lmp
ξ
ξ
α
α
α
α
α
α
,
,
,
,
,
,
,
,
i i
c ij c ij
e ij e ij
Dual variables/ Lagrangian multipliers
References
[1] A. Andreoni, A. Garcia-Agreda, T. Strada, J. Saraiva, Strategies for power systems expansion planning in a competitive electrical market, Electrical Engineering, 89(5) (2007) 433-441.
[2] A. Orths, A. Schmitt, Z. Styczynski, J. Verstege, Multi-criteria optimization methods for planning and operation of electrical energy systems, Electrical Engineering (Archiv fur Elektrotechnik), 83(5) (2001) 251-258. [3] T. Akbari, S. Zolfaghari Moghaddam, E. Poorghanaat,
F. Azimi, Coordinated planning of generation capacity and transmission network expansion: A game approach with multi‐leader‐follower, International Transactions on Electrical Energy Systems, 27(7) (2017) e2339.
[4] N. Alguacil, A.L. Motto, A.J. Conejo, Transmission
0.5 1 1.5 2 2.5 3
0 0.1 0.2 0.3 0.4 0.5 0.6 0.7
Investment Cost (106$)
C
onge
st
ion C
os
t (
10
4$/h
r)
Fig. 4. Congestion cost versus investment cost for IEEE 24-bus RTS
0 0.1 0.2 0.3 0.4 0.5 0.6
Congestion Cost (10 4$)
5.6 5.65 5.7 5.75
Total Production Cost ($)
104
expansion planning: A mixed-integer LP approach, IEEE Transactions on Power Systems, 18(3) (2003) 1070-1077.
[5] A. Arabali, M. Ghofrani, M. Etezadi-Amoli, M.S. Fadali, M. Moeini-Aghtaie, A multi-objective transmission expansion planning framework in deregulated power systems with wind generation, IEEE Transactions on Power Systems, 29(6) (2014) 3003-3011.
[6] J.H. Zhao, J. Foster, Z.Y. Dong, K.P. Wong, Flexible transmission network planning considering distributed generation impacts, IEEE Transactions on Power Systems, 26(3) (2011) 1434-1443.
[7] R.A. Jabr, Optimization of AC transmission system planning, IEEE Transactions on Power Systems, 28(3) (2013) 2779-2787.
[8] J.A. Taylor, F.S. Hover, Conic AC transmission system planning, IEEE Transactions on Power Systems, 28(2) (2013) 952-959.
[9] P. Maghouli, S.H. Hosseini, M.O. Buygi, M. Shahidehpour, A scenario-based multi-objective model for multi-stage transmission expansion planning, IEEE Transactions on Power Systems, 26(1) (2011) 470-478. [10] T. Akbari, A. Rahimikian, A. Kazemi, A multi-stage
stochastic transmission expansion planning method, Energy Conversion and Management, 52(8-9) (2011) 2844-2853.
[11] T. Akbari, S. Zolfaghari, A. Kazemi, Multi-stage stochastic transmission expansion planning under load uncertainty using benders decomposition, International Review of Electrical Engineering, 4(5) (2009).
[12] M. Moeini-Aghtaie, A. Abbaspour, M. Fotuhi-Firuzabad, Incorporating large-scale distant wind farms in probabilistic transmission expansion planning—Part I: Theory and algorithm, IEEE Transactions on Power Systems, 27(3) (2012) 1585-1593.
[13] J.C. Villumsen, G. Bronmo, A.B. Philpott, Line capacity expansion and transmission switching in power systems with large-scale wind power, IEEE Transactions on Power Systems, 28(2) (2013) 731-739.
[14] G.A. Orfanos, P.S. Georgilakis, N.D. Hatziargyriou, Transmission expansion planning of systems with increasing wind power integration, IEEE Trans. Power Syst, 28(2) (2013) 1355-1362.
[15] Y. Gu, J.D. McCalley, M. Ni, Coordinating large-scale wind integration and transmission planning, IEEE Transactions on Sustainable Energy, 3(4) (2012) 652-659.
[16] T. Kristiansen, J. Rosellon, Merchant electricity transmission expansion: A European case study, Energy, 35(10) (2010) 4107-4115.
[17] M. Hesamzadeh, N. Hosseinzadeh, P.J. Wolfs, A leader– followers model of transmission augmentation for considering strategic behaviours of generating companies in energy markets, International Journal of Electrical Power & Energy Systems, 32(5) (2010) 358-367.
[18] I. Sharan, R. Balasubramanian, Integrated generation and transmission expansion planning including power and fuel transportation constraints, Energy Policy, 43 (2012) 275-284.
[19] G. Liu, H. Sasaki, N. Yorino, Application of network topology to long range composite expansion planning of generation and transmission lines, Electric Power Systems Research, 57(3) (2001) 157-162.
[20] J.L. Cohon, Multiobjective programming and planning, Courier Corporation, 2004.
[21] L.S. Lasdon, Optimization theory for large systems, Courier Corporation, 2002.
[22] C. Grigg, P. Wong, P. Albrecht, R. Allan, M. Bhavaraju, R. Billinton, Q. Chen, C. Fong, S. Haddad, S. Kuruganty, The IEEE reliability test system-1996. A report prepared by the reliability test system task force of the application of probability methods subcommittee, IEEE Transactions on power systems, 14(3) (1999) 1010-1020.
[23] S. Hajri-Gabouj, A fuzzy genetic multiobjective optimization algorithm for a multilevel generalized assignment problem, IEEE Transactions on Systems, Man, and Cybernetics, Part C (Applications and Reviews), 33(2) (2003) 214-224.
Pleasecitethisarticleusing:
S. Zolfaghari-Moghaddam, T. Akbari, A Multi-objective Transmission Expansion Planning Strategy: A Bilevel Programming Method, AUT J. Elec. Eng., 50(2) (2018) 163-168.