Copyright © 2014 by ranian Occupational Health Association (IOHA) I IJOH 6: 81-87, 2014
O
OR
* Corresponding author: Leila Omidi, Email: Omidileila@yahoo.com
RIIGGIINNAALLAARRTTIICCLLEE
O
O
The Influence of Safety Training on Safety Climate
Factors in a Construction Site
The Influence of Safety Training on Safety Climate
Factors in a Construction Site
MOHAMMAD JAVAD JAFARI1, MEHDI GHARARI1, MOHTASHAM GHAFARI2, LEILA OMIDI3*, SABA
KALANTARI4, and GOLAM REZA ASADOLAH FARDI5
MOHAMMAD JAVAD JAFARI1, MEHDI GHARARI1, MOHTASHAM GHAFARI2, LEILA OMIDI3*, SABA
KALANTARI4, and GOLAM REZA ASADOLAH FARDI5
1
Occupational Health Engineering Department, School of Public Health, Shahid Beheshti University of Medical Sciences, Tehran, Iran; 2Public Health Department, School of Public Health, Shahid Beheshti University of Medical Sciences, Tehran, Iran; 3Occupational Health Engineering Department, School of Public Health, Tehran University of
Medical Sciences, Tehran, Iran; 4Occupational Health Department, School of Public Health, Arak University of Medical Sciences, Arak, Iran; 5Civil Engineering Department, School of Engineering, University of Tarbiat Moalem,
Karaj, Iran. 1
Occupational Health Engineering Department, School of Public Health, Shahid Beheshti University of Medical Sciences, Tehran, Iran; 2Public Health Department, School of Public Health, Shahid Beheshti University of Medical Sciences, Tehran, Iran; 3Occupational Health Engineering Department, School of Public Health, Tehran University of
Medical Sciences, Tehran, Iran; 4Occupational Health Department, School of Public Health, Arak University of Medical Sciences, Arak, Iran; 5Civil Engineering Department, School of Engineering, University of Tarbiat Moalem,
Karaj, Iran.
Received January 27, 2014; Revised March 19, 2014; Accepted March 30, 2014 Received January 27, 2014; Revised March 19, 2014; Accepted March 30, 2014
This paper is available on-line at http://ijoh.tums.ac.ir
This paper is available on-line at http://ijoh.tums.ac.ir
ABSTRACT ABSTRACT
Safety issues have always been put forward as one of the major problems and primary concerns in construction industries in many countries. This paper will focus on the impact of safety training on safety climate and its relevant factors in two sites of a construction firm.The Health and Safety Executive (HSE) guide to safety climate tool that had been validated in Iran was used to determine the impacts of safety training on safety climate and its relevant factors. For this purpose, 347 workers filled out the questionnaire before and after safety training. The relationships between demographic features of workers and safety climate factors were considered in the questionnaire. Spearman's rho test was used
to determine the relationship between safety climate factors. In both sites, there were significant
differences (p<0.05) between safety climate factors before and after safety training while, the level of safety climate in both sites was the same before (p=0.416) and after (p=0.547) safety training. The results of Spearman's correlations test indicated that there has been a significant relationship (p<0.05) between safety climate and its relevant factors in both sites. The results showed that some safety climate factors such as pressure for production had been influenced by demographic factors such as age and job category. Safety training can improve the level of safety climate and its relevant factors in a construction industry. Improvement of each safety climate factor can promote the level of safety climate. Demographic features affected safety climate level and its relevant factors.
Keywords:Safety climate, Safety climate factors, Construction firm, Demographic feature
Keywords:Safety climate, Safety climate factors, Construction firm, Demographic feature
INTRODUCTION
INTRODUCTION
Construction industries had high accident rates due to the nature of the work, management system, equipment used in the process, techniques used to perform the tasks, speed of the work and other relevant
factors [ 1]. In spite of improvements in safety conditions at this industry, effective reduction in accident rates in some countries have not been significant [ 2]. Safety issues have always been put forward as one of the major problems and primary concerns in this industry in many countries [ 3]. The U.S. Center for Construction Research and Training in 2005 stated that construction industries had the fourth highest fatality rate after agricultural, mining and Construction industries had high accident rates due
to the nature of the work, management system, equipment used in the process, techniques used to perform the tasks, speed of the work and other relevant
factors [
R
RIIGGIINNAALLAARRTTIICCLLEE
transportation industries [ 4]. The results of domestic studies in recent years indicated that 46% of fatal occupational accidents occurred in the construction industry showing that construction is a high risk industry in Iran [ 5]. Given the costs of occupational injuries and illnesses, the construction industry is considered as one of the most expensive industries. In 2005, 5% of the total employer costs in construction industries were paid for compensation of employees that was three times as high as the average paid by other industries [ 4]. Costs of accidents in these industries (classified according to insured and uninsured workers) showed that as much as 3% of the total project costs and approximately 10% of costs of labor are paid for accidents [ 6]. The fatal accident rates in construction industry were 11.1 accidents per 100,000 workers those approximately 3 times higher than fatal work injuries in other industries (4.2 accidents per 100,000 workers) [ 4]. The results of previous research showed that 85% of accidents were caused by unsafe acts in construction industries [ 7]. Fatal accident investigation reports indicated that safety culture or climate play an importance role in occurrence of accidents [ 8]. The most important issue that can be stated in accident occurrence is inadequate safety training in construction industries [ 9]. The results of Pinto et al study (2011) showed that lack of adequate knowledge concerning safety among senior and project managers and the poor safety culture was the main cause of poor safety performance [ 10]. Occupational health and safety studies revealed that the root of 85-95% of accidents is caused by unsafe acts were poor safety culture [ 11]. A positive safety climate is one of the most important issues at the workplaces [ 12]. Safety climate has an impact on workers belief and behaviors in workplaces [ 13]. Safety climate was composed of several factors that directly involved in the relationship with each other. According to the Health and Safety Executive, these factors include factor 1: management commitment, factor 2: safety training, factor 3: safety communications, factor 4: pressure for production, factor 5: safety improvements, factor 6: employee involvement in safety, factor 7: work permit system, factor 8: safety rules, factor 9: encouraging raising safety issues, factor 10: safety committees and factor 11: safety rule breaking [ 7].
The results of Cooper and Phillips study in 2004 indicated that safety training can promote workers safety behaviors. Their results also showed that safety training has a significant effect on workers safety perception and safety perception has a direct relationship with safety climate [ 14]. Safety climate as a key element largely affects workers' performance. Assessing the workers' performance provides a method by which organizations can examine the safety perception of their employees [ 15]. Accident rates and compensation costs could be suitable measures to
evaluate the safety performance [ 14]. Organizational climate is a multidimensional tool that helps workers to evaluate their workplaces [ 16].
Adequate training of personnel in the construction industry is expected to increase their perception of safety at workplaces. In recent years, there has been interest in improving the safety training in workplaces to increase employee motivation, awareness and safety performance in construction industries. The purpose of this paper is to assess the impact of safety training on safety climate factors in two sites of a construction firm.
MATERIALS AND METHODS Study Population
This cross-sectional study was conducted in two sites of Kayson Construction Company in 2010. The main differences between site No.1 and 2 are the type of contractor companies, contract types and location of sites. The subjects were selected from 1500 workers of the executive management team, technical workers and service workers. According to Morgan table, 347 workers were selected. All selected subjects met the required entering criteria including one year work experience at the sites and consent to participation in this study. Among those selected, 168 subjects worked in site No 1 and 179 workers in site No 2.
Safety Climate Questionnaire
sessions. For example, based on pre-test data only 49 of 100 individuals were agree that “managers encourage personnel for improving safety”, thus in a session with managers this issue was highlighted and they were asked for encouraging and reinforcement of personnel. As another instance, unfortunately only 28 of 100 workers mentioned that this is not related to them that others eliminate safety rules. Thus, negative consequences of this perceptions as well as the responsibility of each individual were explained for workers at a training session. Finally, the content of the training courses was organized. Nine safety training courses each lasting from 0.5-2 hours were carried out during summer 2010. Training persistency was evaluated 45 days after the training.
The present study examined the relationships between the demographic characteristics of workers and the safety climate factors considered in the questionnaire. Age, marital status and education, employment, job category, contractor companies, contract types and job experience were considered in this study. One-way ANOVA, paired t-test and independent t- test were used to statistically analyze the impact of training on safety climate factors. The Spearman's rho test was used to determine the relationship between safety climate factors. To study the relationship between safety climate factors and accident rates before safety training reflected in the questionnaire items, workers based on event rates divided into two groups: workers with low accident rate and workers Table 1. Mean and standard deviation scores for safety climate factors
Before training After training
Factors
Site No 1 Site No 2 Site No 1 Site No 2
Management commitment 3.598± 0.598 3.512± 0.630 3.927± 0.576 4.105± 0.525
Training 3.724± 0.708 3.348± 0.588 4.231± 0.680 3.926± 0.667
Communications 3.305±0.705 3.024± 0.739 3.856± 0.691 3.639± 0.555
Pressure for production 3.522± 0.577 3.369± 0.645 3.762± 0.565 3.386± 0.426
Safety improvements 2.922± 0.616 2.711±0.636 3.081± 0.622 2.876±0.504
Employee involvement 3.426± 0.832 3.254± 0.813 3.951±0.792 3.876± 0.790
Permit to work system 3.108± 0.851 2.827± 0.868 3.470± 0.844 3.310± 0.867
Safety rules 3.038± 0.596 2.970± 0.660 3.628± 0.602 3.482± 0.532
Encouraging to raise safety 3.217± 1.083 2.506± 1.128 3.334± 1.066 2.502± 1.230
Safety committees 3.568± 0.844 3.573± 0.859 3.799± 0.855 3.590± 0.886
Rule breaking 2.615± 0.566 2.547± 0.493 3.216± 0.577 3.150± 0.453
Table 2. The P of comparing the mean scores of safety climate factors
The p-values of paired t-test Before and after training Before and after training
Site No 1 2
Management commitment 0.031 0.022
Training 0.024 0.016
Communications 0.003 0.001
Pressure for production 0.734 0.628
Safety improvements 0.058 0.075
Employee involvement 0.002 0.003
Permit to work system 0.046 0.042
Safety rules 0.015 0.002
Encouraging to raise safety 0.240 0.261
Safety committees 0.216 0.362
Table 3. The relationship between safety climate factors and demographic features
Age group Marital status Job category Contractor companies Contract types
Before After Before After Before After Before After Before After
Factors
(p) (p) (p) (p) (p)
Management
commitment 0.443 0.446 0.359 0.537 0.091 0.005 0.505 0.278 0.138 0.028
Training 0.053 0.031 0.688 0.002 0.130 0.018 0.183 0.210 0.083 0.002
Communications 0.501 0.481 0.219 0.012 0.142 0.148 0.694 0.320
Pressure for production 0.002 0.004 0.649 0.471 0.001 0.001 0.104 0.176 0.734 0.378
Employee involvement 0.074 0.018 0.392 0.428 0.064 0.001 0.661 0.444 0.108 0.003
Permit to work system 0.287 0.606 0.258 0.211 0.786 0.412 0.063 0.029 0.209 0.008
Encouraging to
raise safety < 0.05 <0.05 0.242 0.320 < 0.05 0.002 0.827 0.894 0.124 0.137
Safety committees 0.713 0.615 0.352 0.261 0.013 0.009 0.081 0.007 0.317 0.421
Rule breaking 0.027 0.01 0.432 0.019 0.077 0.058 0.341 < 0.05 0.088 0.189
with high accident rate. Workers with low accident rate have 1 event or no event in 2010 (246 worker) and workers with high accident rates had more than 1 event in 2010 (101 worker). The Spearman's rho test was used to determine the relationship between safety climate factors and accident rates.
RESULTS
Comparison of Safety Climate Factor in Construction Firm
The mean and standard deviation scores of different safety climate factors of each studied sites before and after training are presented in Table 1. In site No 1,
safety training with 3.724±0.708 points had the highest score and safety rule breaking with 2.615±0.566 points got the least score before safety training. After training in this site, safety training with 4.231±0.680 points had the highest score and safety improvement factor with 3.081±0.622 points showed the least score. In site No.2, safety committees with 3.573±0.859 points got the highest score and encouraging raising safety issues with 2.506±1.128 points showed the least score before safety training. After training at site No 2, management commitment with 4.105±0.522 points had the highest score from the total of 5 scores and the lowest score were found for encouraging raising safety issues with
Table 4. The relationship between safety climate and its relevant factors in site No.1
Climate factors 2 3 4 5 6 7 8 9 10 11
Management commitment
**
0.454 **0.403 **0.356 **0.466 **0.312 **0.237 **0.201 *0.175 **0.201 **-0.232
Training **0.404 **0.414 *0.367 **0.477 *0.450 *0.468 0.254 **0.312 **-0.528
Communications **0.351 **0.450 **0.563 0.040 **0.357 0.073 **0.260 **-0.390
Pressure for production **0.227 **0.214 -0.186 0.021 **0.123 0.340 **0.259
Safety improvements 0.036 *0.368 *0.347 -0.066 0.103 0.089
Employee involvement **0.282**0.151 0.458 0.434 **-0.508
Permit to work system **-0.295 0.204 **0.221 **-0.385
Safety rules -0.244 -0.061 **-0.154
Encouraging to raise safety 0.391 **-0.226
Safety committees *-0.331
Rule breaking 1
Table 5. The relationship between safety climate and its relevant factors in site No.2
Climate factors 2 3 4 5 6 7 8 9 10 11
Management commitment
**
0.418 **0.413 **0.381 **0.429 **0.344 **0.237 **0.199 *0.175 **0.299 **-0.238
Training **0.412 **0.420 *0.377 **0.456 *0.444 *0.468 0.245 **0.316 **-0.499
Communications **0.371 **0.499 **0.535 0.040 **0.338 0.084 **0.289 **-0.379
Pressure for production **0.211 **0.221 -0.154 0.276 **0.111 0.331 **0.270
Safety improvements 0.103 *0.345 *0.340 -0.015 0.029 0.098
Employee involvement **0.265**0.144 0.058 0.133 **-0.508
Permit to work system **-0.257 0.319 **0.224 **-0.374
Safety rules -0.244 -0.061 **-0.161
Encouraging to raise safety 0.195 **-0.199
Safety committees *-0.328
Rule breaking 1
*Correlation is significant at the 5% level **Correlation is significant at the 1% level
2.502±1.230 points.
The comparison of mean scores for safety climate factors in site No 1 and No 2 before and after training indicated that there were significant differences between safety climate factors such as management commitment, safety training, safety communications, and employee involvement in safety, safety rules, safety rule breaking and work permit system before and after training. These differences are presented in Table 2. The level of safety climate in both site was the same before (p = 0.416) and after (p = 0.547) training and no significant differences was found.
Safety Climate Factors and Demographic Features The results indicated that there was a significant relationship between some safety climate factors and demographic features before and after the application of safety training (Table 3). Pressure for production has been influenced by demographic factors such as age and job category.
Correlation between Safety Climate and its Relevant Factors after Safety Training
Spearman's correlations test results showed that there has been a significant relationship between safety climate and its relevant factors in site No.1 of construction firm. As can be seen from the Table 4, management commitment has positive correlation at the 1% level with other safety climate factors except rule breaking factor.
In site No.2, the results of Spearman's correlations test indicated that there was a significant relationship between the safety climate and its relevant factors. Table 5 shows that the rule breaking factor has not
positive correlation at the 1% level with management commitment.
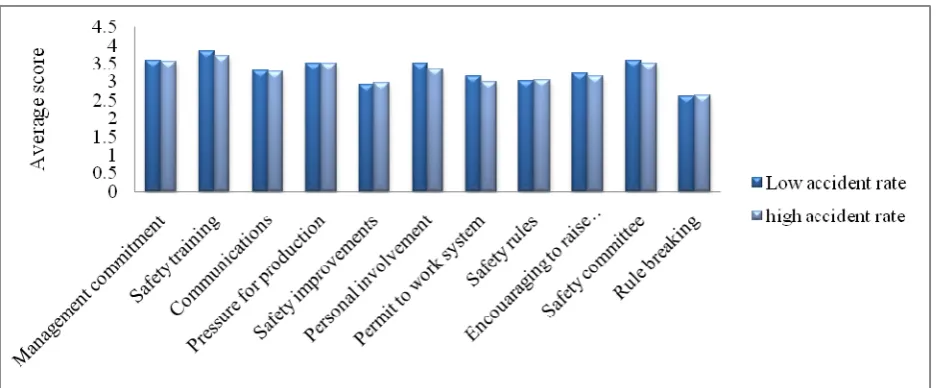
Safety Climate Factors and Accident Rates before Safety Training
As shown in Fig.1, no significant differences were found between safety climate factors and accident rates before safety training in workers with low accident rate (246 worker) and workers with high accident rates in 2010.
DISCUSSION
Fig 1. The relationship between safety climate factors and accident rates
A comparison of mean scores of safety climate factors in both sites showed that the scores of some safety climate factors including management commitment, safety training, and safety communications, employee involvement in safety, permit system, safety rules and rule breaking were increased remarkably after safety training. The result of Glendon et al. (2007) indicated that safety training has an impact on safety climate factors as a special feature of organizational climate and safety climate has an effect on workers' perceptions of job safety [ 19]. The findings of the current study are consistent with those of Kiani et al. (2012) who found that some safety climate factors such as management commitment and safety communications were improved after safety training [ 20].
There was a significant relationship between job category and some safety climate factors including pressure for production, encouraging raising safety issues and safety committees. It is encouraging to compare this figure with that found by Vinodkumar (2009) who reported a significant relationship between job categories and some safety climate factors such as management commitments and priority for safety over production [ 21]. The contractor company had an effect on some safety climate factors including permit system, safety committees and safety rules breaking after safety training. Contract types had an impact on training factor and employee involvement in safety after safety training. The results of the present study are consistent with those of Tharaldsen and et al. [ 24].
The correlation between the safety climate factors and demographic characteristic showed that some safety climate factors such as pressure for production correlate with some demographic characteristics including age and job category before and after safety training. The results also showed that older workers believe that the organization encourage workers to promote the safety rules in work environments. Table 3 indicates that there was a relationship between age and rule breaking factor. It means that older workers have less safety rule breaking than younger workers. Investigating the relationship between age and training factors showed that experienced workers obtained more knowledge from the safety training. Previous studies reported the relationship between age and some safety climate factors [ 21]. The findings also indicated that there was not a significant relationship between marital statuses before safety training although a significant relationship was reported after safety training. Vosoughi (2011) and Heidari (2007) studies also did not report any significant relationship [ 22- 23].
The investigation of the relationship between safety climate factors found a significant positive correlation between most safety climate factors. The observed positive correlation between safety climate factors might be explained by the fact that improvement in safety climate factors can improve the level of safety climate in site No.1 and 2. Also, improvement of one factor may be promoting the other safety climate factors [ 7].
these findings are limited by the use of a cross sectional design and the use of different staff members to conduct the training sessions.
CONCLUSION
Safety climate as a special subject of the safety culture focuses on safety and health issues in work environments. Safety training can improve the level of safety climate and its relevant factors in construction sites. Demographic features had effect on safety climate and its relevant factors in organizations. Improvement in safety climate factors can promote the level of safety climate in the studied sites.
ACKNOWLEDGEMENTS
This article is extracted from M Gharari's thesis supervised by MJ Jafari. The project was supported by Kayson Construction Co. We also, thank the Shahid Beheshti University of Medical Sciences for their support. The authors declare that there is no conflict of interests.
REFERENCES
1. Niskanen T, Saarsalmi O. Accident analysis in the construction of buildings. Saf Sci 1983; 5(2):89-98.
2. Zhang M, Fang D. A continuous Behavior-Based Safety strategy for persistent safety improvement in construction industry. Automat Constr 2013; 34:101-7.
3. Lin ETA, Wen KPT. Singapore's contractors' attitudes towards safety culture. JCR 2005; 6(01):157-78.
4. Dong X, Men Y, Haile E. Work-related fatal and nonfatal injuries among US construction workers, 1992-2003. MD: The center to protect workers' rights. 2005; Available from: http://www.elcosh.org/record/document/1298/d000433.pdf. 5. Parvizpour D. Epidemiology of work accidents in Iran.
Singapore Med J 1977; 18(1):53-6.
6. Levitt E, Parker H, Samuelson N. Improving construction safety performance: the user’s role. Stanford University., Stanford, CA, 1981.
7. Zare S, Shabani N, Sarsangi V, Babaei Heydarabadi A, Aminzadeh R, Parizi V, Abbasai MA. Investigation of the safety climate among workers in sirjan GolGohar mining and industrial company, J Ilam Univ Med Sci 2012;20(4):204-1. [In Persian] 8. Camino López MA, Ritzel DO, Fontaneda I, González Alcantara
OJ. Construction industry accidents in Spain. J Saf Res 2008; 39(5):497-507.
9. Gervais M. Good management practice as a means of preventing back disorders in the construction sector. Saf Sci 2003; 41(1):77-88.
10. Pinto A, Nunes IL, Ribeiro RA. Occupational risk assessment in construction industry–Overview and reflection. Saf Sci 2011; 49(5):616-24.
11. Dilley H, Kleiner BH. Creating a culture of safety. Work study1996; 45(3):5-8.
12. Kath LM, Marks KM, Ranney J. Safety climate dimensions, leader–member exchange, and organizational support as predictors of upward safety communication in a sample of rail industry workers. Saf Sci 2010; 48(5):643-50.
13. Flin R, Mearns K, O'Connor P, Bryden R. Measuring safety climate: identifying the common features. Saf Sci 2000; 34(1):177-92.
14. Cooper MD, Phillips RA. Exploratory analysis of the safety climate and safety behavior relationship. J Saf Res 2004; 35(5):497-512.
15. Evans B, Glendon AI, Creed PA. Development and initial validation of an Aviation Safety Climate Scale. J Saf Res 2007; 38(6):675-82.
16. James LA, James LR. Integrating work environment perceptions: Explorations into the measurement of meaning. J Appl Phys 1989; 74(5):739.
17. Jafari MJ, Sadighzadeh A, Sarsangi V, Zaeri F, Zarei E. Development and psychometrics of "safety climate assessment questionnaire". J Inj Prev Saf Prom 2013;1(3):123-133. [In Persian]
18. DePasquale JP, Geller ES. Critical success factors for behavior-based safety: A study of twenty industry-wide applications. J Saf Res 2000; 30(4):237-49.
19. Glendon AI, Evans B. Safety climate in Australian railways. In: Wilson J, Norris B, Clarke T, and Mills A (Eds). People and rail systems: human Factors at the heart of the railway. Ashgate, Hampshire, UK, 2007; pp. 409–417.
20. Kiani F, Samavtyan H, Poorabdiyan S, Jafari E. How safety trainings decrease perceived job stress: the effects of improvement in employees' attitude toward safety issues. Far East J Psychol Bus 2012; 6(4):46-58.
21. Vinodkumar M, Bhasi M. "Safety climate factors and its relationship with accidents and personal attributes in the chemical industry." Saf Sci 2009; 47(5): 659-667.
22. Vosoughi S, Oostakhan M. An Empirical investigation of safety climate in emergency medical technicians in Iran. IJOH 2011; 3(2):70-5.
23. Heidari M, Farshad A, Arghami S. Astudy on relationship between production link worker's safety attitude and their safe act in of arak metal industry. IOH 2007; 4(3):1-9. [In Persian] 24. Tharaldsen J, Olsen E, Rundmo T. A longitudinal study of safety
climate on the Norwegian continental shelf. Saf Sci 2008; 46(3):427-39.
25. Baeka J, Kangc S, Singhb KP, Bae S. Safety climate perceptions and attitudes of supervisors in the Korean Industry. 19th International Congress on Modelling and Simulation, December 2011; Perth, Australia.