Is Simplicity Within
a Logo the Key to
Increased Consumption
1
Is Simplicity Within a Logo the Key to Increased
Consumption?
Lise Devits
1ABSTRACT
This study aims to identify whether a flat, simple logo increases the amount consumed for the corresponding product due to processing fluency of the logo. An experiment was run to test whether a complex logo and a simple logo had different effects on consumption. The main findings were that there was no significant difference between the two logos, however it was identified that the fluent logo had a higher average consumption weight in comparison to the disfluent. Further, the relationship between logo and consumption was stronger when a consumer was highly design oriented, because they more strongly value the product design and how it matches their visual aesthetics.
1. Introduction
A logo is one of the most salient visual elements of a brand. It allows consumers to identify with the brand and differentiate it from competitors. Since the 1990s, a trend has been rising in which companies have been simplifying the looks of their logos. Prior to the change, the logos used had fancy fonts, and three-dimensional images. They had a much more intricate look to them, which made it more difficult to remember them clearly. However, McDonalds, Pepsi, Walmart, Kraft, and many more are now changing designs to simple flat logos. The logos now have higher contrast with their background and cleaner fonts. What exactly is the reasoning behind this trend to simple logos? And what will the results be of this drastic change? One of the reasons behind this might lie with the idea of processing fluency. It is a topic that has been thoroughly studied throughout the years. Researchers have proven that ease of processing fluency increases judgments of truth, and that it elicits a positive affect towards the stimulus. This may be the main reason behind the change. However, it would be interesting to see if simplicity within a logo would increase the consumption of that specific product. No studies have been done that analyze whether processing fluency of a logo has an effect on how much a person consumes of that specific brand. If findings of this study indicate that an easy to process logo increases consumption rate, it could describe another factor as to why logos are increasing in simplicity.
First, this study uses previous literature to examine what exactly the influence of a logo is on brand perception. This starting point allows us to clarify why the logo may have a salient effect on consumption. Furthermore, the concept of processing fluency will be discussed through which our hypotheses will be developed in light of the previous findings. Afterward, the research method and results follow. Finally, a discussion of the findings' implications for management practice, limitations, and future research develops. It is important to note that the findings of this study can be linked solely to the food industry due to the research design used.
1 Lise Devits received a bachelor degree in International Business with a Major in Marketing at Maastricht
2
Marble
Research
Papers
2. Influence of a Logo on Brand Perception
Derived from the Greek word ‘logos’ a logo has the meaning of being a visual word, one that communicates to the consumers. For this research, it is essential to see what kind of influence a logo has on a brand, so that one can assume that the logo could have an effect on consumption. According to Wallace (2001), a logo is one of the most salient visual elements of a brand. They assist consumers in identifying the brand and help differentiate it from its competitors, since product design can be quite similar amongst competing brands. Companies use logos as the main visual representation of their image and meaning. They are able to shape the brand’s reputation, attitudes towards purchase intentions and their brand loyalty (Henderson & Cote, 1998; Baker & Balmer, 1997; Woo, Chang-Hoan, Hyuck Joon, 2008; Müller, Kocher, & Crettaz, 2011). Moreover, the logo enables faster decision making and easier brand identification. This is essential due to the bombardment of brand imagery toward customers from different marketing messages (Henderson & Cote, 1998).
Is Simplicity Within
a Logo the Key to
Increased Consumption
3
3. Processing Fluency
Processing fluency has been a well-studied matter by many researchers. It defines the way people experience the ease of processing information, whether difficult or easy. Alter and Oppenheimer (2009) summarized all sorts of fluency from linguistic to visual. The main finding is that an easy to process stimuli leads to more positive behaviors, such as positive affect, truth judgments, and confidence judgments towards the stimuli. Prior to discussing the results of all these findings it is essential to clarify what exactly makes something easy to process. An easy to process stimuli is something that is seen as being simple and coherent. When one compares a children book to an encyclopedia the latter will be more difficult to process than the children’s book. It also varies from person, but overall a stimuli that is clear to see, without any complexity will make it easy to process. The studies discussed next elaborate on what makes a stimulus easy to process versus difficult to process.
According to Reber & Schwarz (1999) ease of processing has a great effect in shaping judgments about a product; the actual cognitive content of the product was used less to determine whether the aspect was true. Statements were presented in colors that made them either difficult or easy to read against a white background. Participants were then asked if the statement was true. Easy to process stimuli are seen as more familiar, this then leads to participants feeling as if they have heard or seen it before, suggesting that it should be true (Whittlesea et al., 1990). In conclusion, the fluent sentences were seen as more true. When a logo is easy to process a customer will associate more positive judgments to the brand, regarding them as a more truthful brand. This is due to the fact that they feel as if it is something they are familiar with. Reber et al (1998) also found that when fluency results in a positive experience higher affective ratings would result. This experiment used three different ways to aid in recognizing a stimulus; visual priming, figure-ground contrast, and exposure duration. All of these ways influence the processing fluency of the stimulus. The authors found that ease of perceptual fluency is affectively positive; participants had increased judgments of liking and prettiness regarding the visual. Therefore, this reveals that after consumers view a simple logo they will judge it as more pretty and have a higher liking towards it in comparison to a complex logo.
To link all the previous research to consumption it is important to note the findings of Petrova & Cialdini (2005). The authors state that the use of imagery is important for influencing a consumer’s way of thinking. Throughout this study, a vivid ad and a less vivid ad were utilized. The vividness was determined using nine-point vividness scales with six factors; attention catching, clear, exciting, detailed, concrete, communicating a strong image. The authors defined the vivid ad as the fluent imagery. Participants had more positive emotions after viewing the ad that included a higher rating of these vividness scales. When one is given an easy to imagine stimuli they are able to link more information to it than when it is a hard to process stimuli. It was concluded that imagery appeals have a positive effect on brand attitudes and therefore purchase intention. This relates to the idea that when using a simple logo, people will be able to recall it more easily and thus have a positive brand attitude, increasing purchases.
4
Marble
Research
Papers
The main question that will be answered throughout this research paper is: “Does the difference of processing fluency within a logo design (simple vs. complex) change consumption rates?” Along with this broad overarching question it is also important to look at some sub questions:
Does a simple logo cause individuals to have an overall better image of the product, as to how it tastes, and in general how they feel about it?
Does a simple logo increase the willingness to purchase the product?
When put into a category that requires consumers to guess how they will like the product, does a simple logo get a higher overall rating than the complex logo?
As discussed by previous literature, an easy to process stimuli is seen as more truthful by a consumer. This was due to the familiarity effect; when one believes he/she has seen a certain stimuli before they will regard it as being truer than if they are faced with something that is difficult to process (Reber & Schwarz, 1999). When applying this to logos and the brands connected to them it would mean that consumers view the simple logo as more truthful. This, along with the findings that a simple stimuli increases affective judgments such as prettiness and liking led to the following hypothesis (Reber & al, 1998):
H1: The easy to process (simple) logo will result in individuals giving the product a higher overall rating in comparison to the hard to process (complex) logo.
Ease of fluency has been proven to increase positive emotions, the truth effect, and familiarity. This along with the research findings of Petrova & Cialdini (2005), that an easy to imagine stimulus increases a consumers purchase intention resulted in the development of the second hypothesis.
H2: The easy to process (simple) logo will increase a consumers willingness to purchase a product in comparison to the hard to process (complex) logo.
Furthermore, when consumers are asked to rate how they predict the product will taste, the logo will have an impact on the participant’s affective judgments. As stated above, Reber & al found that a simple stimulus increases the positive emotions a consumer has, specifically those concerning liking of the stimulus. Therefore, hypothesis three was established.
H3: When asked how a consumer expects a product to taste, the display with the easy to process (simple) logo will obtain a higher overall rating in comparison to the hard to process (complex) logo.
Overall, it can be assumed that consumers who are given a product with a simple logo will consume more of the product than people who are faced with a complex logo. This being so because of the previous processing fluency research but also due to the findings of Petrova & Cialdini (2005) who found that when given an easy to imagine stimuli there was a positive increase in brand attitudes as well as purchase intention. The last hypothesis is as follows.
Is Simplicity Within
a Logo the Key to
Increased Consumption
5
4. Pretest
Prior to starting the main research it was essential to determine whether the logos that would be used to test the effect of processing fluency on consumption were actually seen as significantly different regarding complexity. Three surveys were created, each using a logo ranging from simple to complex. The survey was distributed through a social media network, assuring that no same person received more than one questionnaire. The respondent was asked multiple 7-point likert scale questions. However, the focus of this pre-test was purely to identify whether there was a significant difference between the complexities of the three logos used. A one-way between subjects ANOVA was conducted to compare the different levels of complexity on participants rating of simple to complex. It was found that there was no significant difference of the ratings for complexity between the three different logos presented, F(2,27)=.928, p=.407.
Figure 1: Three different levels of Logos used within the pretest.
Easy to Process Normal to Process Difficult to Process
Due to these findings it was decided upon that an image set from a previously conducted study would be utilized. Scarlett Stutznaecker created three different images ranging from simple to complex that were then used to test the effects processing fluency has on liking (2014). These images were found as having a significant difference within their level of processing fluency. For the current study, the simplest and the most complex image of the set were utilized to create the logo for Coquet Chocolates, the brand we would use for the main study. Furthermore, a control logo without visual symbol was included. Once all the logos were decided upon the main research study began, this will be discussed next.
Figure 2: The three logos used within the main research study: control, simple, and complex
Control Easy to Process Difficult to Process
6
Marble
Research
Papers
The main research study was conducted in the BeeLab of the University of Maastricht. In the next subsections of the research design the materials used will be discussed, along with the participants and design of the study, and lastly the procedure used.
5.1 Materials
The stimulus materials that were utilized during the study were the three brand logos for Coquet Chocolates that were created using the image designs from a previous research study. Scarlett Stutznaecker utilized the flat versus skeuomorphic complexity criteria to create 15 brand logos. This was done through the manipulation of the elements of skeuomorphic complexity: bevels, gradients, drop shadows, rotation and reflection. By using one logo in three different complexity levels she was able to identify directly if complexity was the main variable affecting the results. Her findings concluded that a flat logo induces higher liking ratings and a faster processing time (2014). Through her findings, and the previous findings of other research it was decided that the images she had created under the standards of complexity would assist in creating the desired effect of increased consumption. This was due to the fact that an increase in liking of the logo would link to an increase in liking of the product and could therefore increase the consumption rate.
Furthermore, Lotus Speculoos Rolls were utilized as the snack item that consumption would be tested on. They were chosen due to the fact that they are quite unknown in the Netherlands, where the study took place, since it is a Belgian product. This way it was possible to change the brand name to avoid any previous bias associated with Lotus products. For the study, three hundred grams of speculoos rolls were placed inside a bowl covered with plastic wrap. One of the three logos was attached to a cardholder that was clipped onto the bowl. The logo display measured 4.75 cm in height, and 3.80 cm in width. A weighing scale is utilized after the study to identify how many grams of the speculoos rolls the participant had consumed.
5.2 Participants and Design
To attain the desired quantitative information needed to test the hypotheses created within this study, an experiment was conducted in the BeeLab at the University of Maastricht. The BeeLab allows for a completely controlled environment so that there are no external distractions that are apparent within the actual marketplace. This method of testing was chosen due to the fact that processing fluency within a logo has never been directly linked to consumption. By controlling the environment the effect of the different levels of complexity within the logos can be identified more clearly on the dependent variable of consumption. Overall, 152 undergraduate students at the University of Maastricht School of Business took part in this experiment for an extra participation point for their current courses. The students reported to the BeeLab at their requested one-hour time slot varying over a week long period.
Is Simplicity Within
a Logo the Key to
Increased Consumption
7
The expectation version required people to analyze the snack before actually pursuing the taste test. The overall façade of the questionnaire was that the participants would be taking part in a taste test for the new chocolate snack created by Coquet Chocolates. This would allow the results to be unbiased, because the participant would be blinded from the actual research point of the study. The procedure of the experiment and the make-up of the questionnaire will be discussed next.
5.3 Procedure
8
Marble
Research
Papers
5.4 Measures
For the purpose of this study one independent variable, logo design, was used to measure the effect on the multiple dependent variables described within the hypotheses. A between subject ANOVA was utilized to measure hypothesis one, two, and three. The three dependent variables used were overall rating of the snack, willingness to purchase, and expected overall rating. For both overall rating and expectation overall rating the data was collect from two sources. Firstly, from the overarching question on how they would score the snack in general. Secondly, a new variable was created called liking. The variable is the average of how the participant rated tasty, pleasant, hard to resist, and pleasant after taste. This was done to identify if the general score correlated with the liking score, and potentially give us some broader information concerning the dependent variable. These two variables were indeed highly correlated (r(127)=.838, p<.01). The dependent variable of hypothesis two, willingness to purchase, was measured using the likert scale asking whether the participant would continue eating the snack. Although these two do not exactly mean the same thing, it can be believed that if someone really feels that they want to continue eating the snack they may be willing to purchase the product if it would be available. Lastly, for hypothesis three the dependent variable of expected overall rating was measured the same way as the normal overall rating as discussed above.
To solve the main question of this research, hypothesis four, the dependent variable of consumption was used. This was measured by weighing the bowl after the participant finished the questionnaire. Every bowl had 300g at the start of the experiment, this was said to be the optimum amount so that participants feel that the researchers will not notice if they eat a lot from the snack item provided. The remaining weight was then subtracted from the initial and this was then used as how much the participant had consumed. A Univariate Analysis of Variance was conducted to determine the relationship between the amount consumed and the different logo the participant was faced with. In the next section, the data analysis will be further discussed and the results will be finalized.
6. Data Analysis
In the following section the preparation of the data will be discussed, as well as the tests run to identify the results found throughout the experiment.
6.1 Preparation of Data
Prior to analyzing the data it was essential to assess the output of the experiment. No changes were made to the data while testing the first three hypotheses. However, for the last hypothesis regarding consumption a few changes had to be made to the data to acquire reliable results. Firstly, outliers in the top 5% of consumption were set at missing values. These participants had consumed two standard deviations above the mean, and they would greatly skew the results. No participants were considered outliers at the lower end of the consumption weight. Second, a value was created that excluded a certain amount of participants that were either fasting at the moment due to lent, or if they believed they were allergic to the snack provided. Basically, whenever a participant answered yes to one or both of these questions within the survey they were excluded. This allowed for a more accurate view of processing fluency because consumption for these participants would be zero grams, so even though the logo may have an effect it will not be noticeable.
Is Simplicity Within
a Logo the Key to
Increased Consumption
9
were fully paying attention to the survey. As stated before, there was a strong correlation between the two values (r(127)=.838, p<.01). These checks allowed for a more accurate analysis of the data. Moreover, new variables were computed to find certain moderating factors between the main relationship of logo fluency and consumption. The first of these was the CVPA as discussed in the Procedure section. The average of nine of the design aspect questions were taken to create the value of
CVPA that is used within the Univariate Analysis of Variance. The outstanding two questions concerning the must buy and urge to buy of a product were not included due to the substantial missing values within the data. Another variable created was named restriction, it was created by adding the values for how often the participant is dieting, how life affecting a weight gain is, how sensibly the eat, whether they give too much time to food, and whether they feel guilty after overeating. After the creation of these two variables a frequency table was made for both values to create a high-low variable. People with a CVPA score of 3.5 out of 5 were considered to be highly design oriented. Furthermore, participants with a restriction score of 12 or higher were seen to be highly restrictive eaters, these may likely bias the results since the snack item is not of the healthy sort. By creating these variables it is easier to identify what type of relationships the two variables have with consumption. Lastly, hunger was also categorized from high to low. Participants who stated they were hungry to some extent or more were considered high in hunger. After the creation of these variables, and the checks for validity the statistical testing commenced.
6.2 Results Hypothesis One
Hypothesis one predicts that when the participant is faced with a simple logo they will give the snack item a higher overall score in comparison to the partakers that view the complex logo. This was predicted as such due to the findings that ease of processing leads to higher affective judgments of the specific stimuli. Reber, Winkielman, and Schwarz found that when a stimuli is easy to process the viewer will have increased judgments of prettiness and liking and decreased judgments of ugliness and disliking of stimuli (1998). To identify whether this applied for the current research a between groups ANOVA test was conducted. For these results, all participants were included within the data. There was no significant difference between the effect the three logo fluency groups had on general score, F(2,114)=.939, p=.394 as can be seen in figure 3. General Score is rated 1-extremely like to 9-extremely dislike.
Figure 3: Bar graph of mean general score for each logo (Hypothesis 1)
G
en
er
al
S
co
10
Marble
Research
Papers
Furthermore, it can be seen that the participants faced with the disfluent logo gave the product a higher average general score (M=2.67, SD=1.108). General score was rated from 1, like extremely, to 9, dislike extremely. The control and fluent logos had a mean rating of 3.00 (SD=1.619) and 3.05 (SD=1.509), respectively. A Tukey post-hoc test further identifies that there was no significant difference between the separate logos. Overall, the participants who were faced with the complex logo gave the snack item a higher general score in comparison to the simple logo, although this difference was not significant either. Further, a between group ANOVA test was conducted with the liking variable, discussed earlier, however this did not differ from the results of general score. Consequently, it can be concluded that there is no main difference between the effects the two main logos (fluent and disfluent) have on the general score given. These findings do not align with the expectations that were created through previous research. Hypothesis one is rejected.
6.3 Results Hypothesis 2
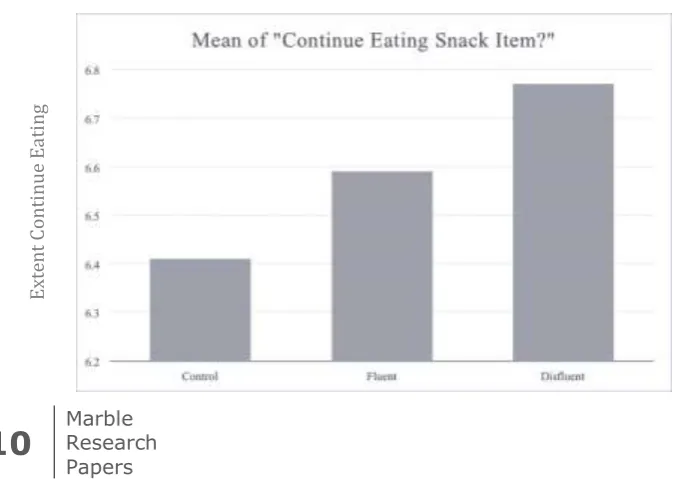
As found by Reber and Schwarz (1999), ease of processing makes a participant view a stimulus as more truthful. When linking this to the findings of Petrova & Cialdini (2005), that an easy to imagine stimulus increases purchase intentions, it was believed that when the participants within this study viewed the easy to process logo they would have a higher willingness to purchase the product. However, this was not directly asked within the survey. Therefore, the question on the extent the participant wanted to continue eating the product was utilized as the dependent variable. It was believed that if a participant really wants to continue eating the product they will go out and purchase it. Again, a between groups ANOVA test was conducted. No significant differences were found between the three logos and their effect on the extent to which the participant wants to continue eating, F(2,142)=.432, p=.650. The reasoning behind this may be that the snack could be seen as highly addictive since it is a chocolate snack, therefore the affective judgments relating to the chocolate may minimize the effects the logos have. One can see in figure 4 below that the again the disfluent category has a higher want to continue eating the snack item, the average of the rating for participants was that they wanted to continue eating the snack (M=6.59, SD=1.913). Again, this is very different from what would be expected regarding the previous studies mentioned above by Petrova and Cialdini (2005). Hypothesis 2 is rejected as well.
Figure 4: Bar graph of mean score of participants want continue eating the snack item for each logo (Hypothesis 2)
Ex
te
nt
C
on
ti
nu
e
Ea
ti
Is Simplicity Within
a Logo the Key to
Increased Consumption
11
6.4 Results Hypothesis 3
As mentioned prior, the survey had two versions, as of now the focus has been on the version where no expectation questions were asked. It could be believed that when a participant is given a simple logo they will give that snack a higher general score even prior to tasting it. The reasoning behind this is that when asked to expect how something will taste the partaker will pay more attention towards the product by examining it inside the bowl. Therefore, the logo will become more apparent and have a greater impact. A between-group ANOVA test concluded that there was no significant difference between the logos and the effect they have on general score within the expectation version, F(2,70)=.393, p=.676. Hypothesis three is rejected. Figure 5 below again illustrates that the disfluent condition actually has a higher general expectation score than the other two conditions. The findings of this study contradict current findings regarding processing fluency
Figure 5: Bar graph of expectation version general score for snack item
Note: General Score is rated 1-extremely like to 9-extremely dislike.
6.5 Results Hypothesis 4
The main goal of this study was to identify whether simplicity within a logo would induce a higher consumption rate in comparison to a complex, difficult to process logo. First, a between-group ANOVA test was run to identify if there was a direct relationship between the logo the partaker is faced with and the amount they consume from the snack item provided. There was no significant difference between the logo conditions, F(2,124)=1.674, p=.192. However, the mean spread does identify that the fluent group (M=18.958, SD=16.353) did consume more of the snack item in comparison to the disfluent group (M=13.028, SD=14.324). This can also be seen in figure 6.
G
en
er
al
S
co
re
E
xp
ec
ta
ti
12
Marble
Research
Papers
Figure 6: Bar graph of different logo and effect on consumption
Although the differences of consumption between the logos were not significant, the participants faced with the easy to process logo did consume more. Further tests were run to identify whether there were moderating variables between the direct relationships. Three covariates were tested within a univariate analysis of variance with grams consumed as dependent variable and logo as the fixed factor so that the main relationship between the two was established. The first covariate used was the split CVPA into participants that were highly design oriented and those who valued design less. A person high in CVPA may perceive the logo design to be more present and therefore the effect of processing fluency is potentially enhanced. Second, the restriction variable split into high and low as discussed prior under preparation of data, was added to identify if participants who were less restricted in their diet were more effected by the logo they received. Lastly, the two categories of hunger (high/low) were also used as one variable. Results of the univariate indicated no significant main relationship between the logo and the grams consumed, F(2,121)=2.184, p=.117). However, CVPA (high/low) did have a significant moderating effect between the main relationship, F(1, 121)=4.748,p=.031. This means that when a participant is highly design oriented the logo they receive highly effects consumption, this will be further elaborated on in the discussion section. Furthermore, hunger had a highly significant explanatory effect, F(1,121)=9.028, p=.003. Since there was no significant difference between hunger and the logo groups (p=.399) it can be concluded that hunger does have a moderating effect on the main relationship. Lastly, restriction, or the way people are effected by their diet, did not have a significant interacting effect, F(1,121)=.058, p=.810. The model shown in figure 7 illustrates the findings.
Co
nsu
mp
ti
on
W
ei
gh
t (
gr
am
Is Simplicity Within
a Logo the Key to
Increased Consumption
13
Figure 7: Conceptual model of the relationship between logo group and consumption7. General Discussion
In regard to the first three hypotheses, the results tend to contradict with findings discussed within previous research articles. First, it was identified that a simple logo does not lead to a higher overall liking of the snack in comparison to a complex logo, both in the expectation and the no expectation version. This highly contradicts the findings of Reber et al., who identify that perceptual fluency increases positive judgments such as liking of the stimulus presented (1998). However, their procedure did include three different types of manipulation to the stimulus presented; visual priming, figure-ground contrast, and exposure duration. Whereas, within this study the participants had no specific exposure time to the logo, nor was visual priming present, this may be the reason as to why the results did not align for both studies. Additionally, it was found that ease of processing has no significant effect on the extent the participant wants to continue eating the snack item. This was linked to willingness to purchase the product. Petrova & Cialdini found that when an advertisement uses vivid images that cause a viewer to easily imagine the situation (2005). They concluded that these imagery appeals have a positive effect on brand attitudes, leading to a higher purchase intention. These findings were not found in the current research.
14
Marble
Research
Papers
the stimuli applies (Reber & Schwarz, 1999). The participant may therefore consume more of that specific product because the simple logo seems more truthful, creates a higher liking, and tends to surpass cognitive thought processes, leaning more on the affective judgments (Alter & Oppenheimer, 2009). Additionally, hunger had a significant moderating effect on the main relationship studied. A participant that indicated a high hunger score caused the relationship between logo fluency and consumption to be stronger. The reasoning behind this may be that the participant pays greater attention to snack item provided to them, more likely to notice the logo. Lastly, whether a person restricts their diet or not does not have an effect on the effect logo fluency has on consumption. To conclude, although there was no significant difference between the logos, the fluent logo did result in a higher consumption weight.
8. Research Limitations
Two main limitations were identified within the current research. First, although the logos used are correctly classified as easy and difficult to process they might not have been present enough throughout the experiment. Participants unwrapped the plastic wrap from the bowl and then immediately started with the survey on the computer. From this moment onwards it could be assumed that the participants did not pay much attention to the 4.75 x 3.80 centimeter logo attached to the bowl. Furthermore, throughout the survey participants were not asked to specifically focus on the logo. The effect of processing fluency could not be attained due to this lack of attention towards the logo, leading to insignificant results. It would be beneficial in future research to include the specific logo within the survey the participant is taking to increase its presence throughout the entire experiment. Also, questions could be included within the ‘taste test’ concerning whether the logo seems fitting to the specific product they are tasting. The second limitation within the research is the specific snack item used. Since the Lotus Speculoos Rolls are covered with chocolate they could be considered an addictive snack, the affective judgments towards the chocolate may minimize the effects the logos have on the participant. A healthy snack item, such as grapes, may be considered for future research. It is much less addictive, and since there is not a great variety between the ways grapes taste the logo may have a higher effect between the relationship of simplicity and increased consumption. These limitations should be taken into consideration in future research.
9. Managerial Implications
Is Simplicity Within
a Logo the Key to
Increased Consumption
15
discussed prior the logo is a key part of this. A further reason behind this trend is that a consumer high in CVPA places a greater importance on product aesthetics in the formation of purchase intentions in comparison to those with low CVPA (Bloch, Brunel, & Arnold, 2003). The highly design oriented consumer that notices the aesthetically appealing logo will more likely purchase the product because they set a high importance on the visual appearance.
10. Future Research
Regarding theoretical contributions, this study builds on the idea of processing fluency, which has been studied quite extensively throughout history. However, a link is built between simplicity within a logo and whether this increases consumption of a certain snack item, which has never been done before. The findings of this study could be the start of a new branch of research.
16
Marble
Research
Papers
References
Alter A. L. & Oppenheimer D. M. (2008), Easy on the Mind, Easy on the Wallet: The Roles of Familiarity and Processing Fluency in Valuation Judgments, Psychonomic Bulletin & Review, 15 (October), 985-90
Alter A. L. & Oppenheimer D. M. (2009). Uniting the Tribes of Fluency to Form a Metacognitive Nation.
Society for Personality and Social Psychology, 13 (3), 219-235.
Baker, M. J., & Balmer, J. M. T. (1997). Visual identity: Trappings or substance? European Journal of Marketing, 31(5/6), 366–383.
Bloch, P. H., Brunel, F. F. & Arnold T. J. (2003). Individual Differences in the Centrality of Visual Product Aesthetics: Concept and Measurement. Journal of Consumer Research, 29(4), 551-565
Foroudi P., Melewar T.C., & Gupta S. (2014). Linking corporate logo, corporate image, and reputation: An examination of consumer perceptions in the financial setting. Journal of Business Research, 67, 2269-2281
Henderson, P. W., & Cote, A. (1998). Guidelines for selecting or modifying logos. Journal of Marketing,
62, 14–30.
Herman, C. P., & Polivy, J. (1980). Retrained eating. In A. J. Stunkard (Ed.), Obesity (pp. 208–225). Philadelphia: Saunders.
Müller, B., Kocher, B., & Crettaz, A. (2011). The effects of visual rejuvenation through brand logos.
Journal of Business Research.66 (1) 82–88 http://dx.doi.org/10.1016/j.jbusres.2011.07.026. Park C. W., Eisingerich A. B., Pol G., Park J. W. (2013). The role of brand logos in firm performance.
Journal of Business Research 66, 180-187.
Petrova K. P. & Cialdini B. R. (2005), Fluency of Consumption Imagery and the Backfire Effects of Imagery Appeals, Journal of Consumer Research, 32 (December), 442-452
Reber, R., & Schwarz, N. (1999). Effects of perceptual fluency on judgments of truth. Consciousness and Cognition, 8, 338-342.
Reber, R., Winkielman, P., & Schwarz, N. (1998). Effects of perceptual fluency on affective judgments. Psychological Science, 9, 45-48.
Wallace, R. (2001). Proving our value: Measuring package design's return on investment. Design Management Journal, 12(3), 20–27.
Whittlesea, B. W. A., Jacoby, L. L., & Girard, K. (1990). Illusions of immediate memory: Evidence of an attributional basis for feelings of familiarity and perceptual quality. Journal of Memory and Language, 29, 716–732.
Winkielman, P. &. Cacioppo, J. T. (2001). Mind at ease puts a smile on the face: Psychophysiological evidence that processing facilitation elicits positive affect. Journal of Personality and Social Psychology , 81, 989–1000.