Liberty, Equality, Democracy
1
Liberty, Equality, Democracy? The supposed relationship
between democratic institutions and income inequality
Simon Lambert
1ABSTRACT
The democratic process was always praised for it supposedly reduces inequalities. Indeed, the voice given to citizens in the democratic decision-making process, enables the less favoured part of the population to have the political system addressing their demands. Among them, reducing inequalities inherent to any given system is often to be found in politicians’ electoral pledges. The democratisation of an unprecedented number of countries in recent history however, failed to produce expected results in terms of inequality reduction. Indeed, the United Nations find that that globally, income inequality rose steadily in the last two decades, whereas democracy has never been so widespread. This paper thus questions the pre-supposed existence of the role of democratic institutions on income inequalities reduction. A simple panel regression alone, does not seem to detect such an effect, however. The paper thus turns to possible causes of this insignificance, such as the endogeneity of democracy, and the reverse effect in the extreme cases. The resulting evidences do not provide for a consistent pattern either, it is argued. Hence, as a final specification, the sample is divided into regions with common or close history; regional patterns are uncovered, which suggests that although there is no systematic effect, when in specific conditions, the relationship may exist.
1.
Introduction
When he wrote that “if all [men] are equal, some are more equal than others”2, George Orwell shed light
on a relationship that has always been assumed: democracies foster and promote equality among citizens. It is indeed a defining feature of a democratic system, to provide each of its citizens with equal grounds, in order for the democratic process to function. When a country democratises, it necessarily needs to liberalise first, enshrining equal opportunities and freedoms for all. Building on this milestone, the process carries on with representing citizens by installing inclusive political institutions (see Acemoglu & Robinson, 2012). Stable, legitimate political institutions in turn, provide for grounds to inclusive economic institutions stemming the responsiveness of political leaders to the citizenry (ibid). These economic foundations, such as property rights, create markets that provide a level playing field and gives the people freedom of opportunity and creativity, equality before the law and access to education.
Orwell’s remark nonetheless calls for a critical reflexion on the Janus face of democratic systems: is democracy significantly reducing inequalities? In spite of democracy, it appears that some men remain more equal than others. Equality of opportunity is an ex-ante equality; it therefore cannot guarantee actual equality. For this reason, we witness countries with relatively high standards of democracy experiencing serious income inequality. The United States (USA), for instance, have long-established representative democratic institutions, and yet, income distribution is much more unequal than in some ‘young’ democracies, such as Eastern European countries. Brazil also experiences extreme income
1 Simon Lambert received a bachelor degree in Econometrics and Operations Research at Maastricht University in 2016. At the moment, he follows a master in Economic and Financial Research at Maastricht University and a master in Public Policy and Human Development at the United Nations University.
2
Marble
Research
Papers
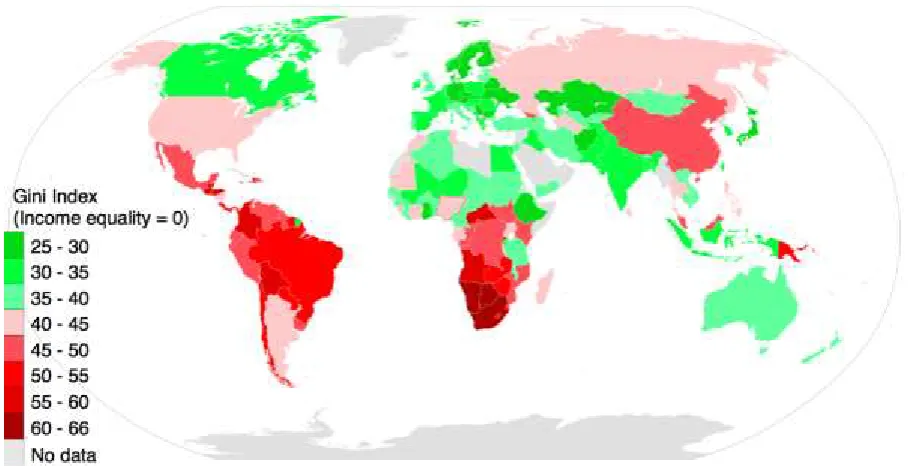
inequality, while China, whose democratic institutions are questionable, faces a much more balanced income distribution – barely more unequal than the USA. In light of this, it seems reasonable to wonder whether the theory of ‘more democracy means more equality’ is not erroneous, or at least, if there is not more to it than simple causality. The aim of this paper is to empirically investigate this assumed relationship, using different techniques; and from different standpoints, to validate or falsify this relation. The paper ultimately questions whether democratic institutions systematically, independently from other factors, pressure income distribution so as to decrease income inequality.
Figure 1.1 World map of income inequality3.
In order to address this uncertainty, a model is built, stemming from existing theories linking inequality to democracy. This model is tested against data in a simple, standard setting. Then, instruments are introduced to investigate the causality – or lack thereof – stemming from the estimations. Subsequently, the model is estimated using a binary variable to disentangle contradicting effects. In the following part, the paper zooms in on different regions experiencing different relationships between inequality and democratic institutions. Finally, results are discussed and a conclusion is provided.
2.
The role of democracy in the income distribution
As noted above, the link between (in)equality and democracy is widely accepted. However, it still needs some more specification since it necessarily conveys varying degrees of causality. This section establishes the theoretical framework on which this paper’s analysis relies, first by restraining the concept of democracy to a certain definition, and then describing possible causality links.
2.1. On defining democracy
Democracy conveys plethora of meanings; In order to come up with a workable definition of democracy, we shall focus on a single approach to democratic institutions. In the context of income inequality, and
Liberty, Equality, Democracy
3
in line with Alesina and Perotti (1994), the most relevant feature of a state is the representation of citizens in the policy-making process, in contrast with autocratic regimes whereby the governing elite is not accountable to the citizenry, and therefore faces few constraints in deciding upon policies. In democracies, however, this representation exists and it is obtained through the process of elections, which make political representatives accountable and responsive to their constituencies. Obviously though, this electoral mechanism unfolds with different degrees of transparency, responsiveness, competition, and freedom in general. For instance, even though Russia’s leadership is subject to elections every once in a while, there is no question whether Mr Putin will lose; whilst American elections often divides the citizenry and entertains suspense until the first Tuesday of November. Therefore, democracy is not modelled as a discrete, binary variable that differentiates between two possible states of affairs, but rather moves on a continuous dimension. Hence, unless specified otherwise, this paper understands democracy as the extent to which electoral process holds policy-makers accountable.The notion of electoral democracy has to be dissected into several components. In this paper, we define these features as those of the ‘electoral democracy’ index developed by the Varieties of Democracy Institute (hereinafter V-Dem). First, the index includes a measure of freedom of association, which is fundamental to the political process as a vector of ideological exchange and formation of preferences. Next, it accounts for freedom of expression in the society, for the same reason as for freedom of association. It also takes into account the scope of suffrage, as a society in which only the members of a certain ‘electoral elite’ vote cannot be fully democratic, in the sense that preferences of all citizens are not represented. Moreover, V-Dem accounts for the extent to which elections are clean, i.e. not rigged in advance, so as to ensure the actual representation of citizen and not only a façade. Finally, it includes a measure of the degree of de jure election of the executive, whose justification is obvious.
Inevitably, this index is flawed. Yet, no index is perfect; Thus, we will prominently use this one as a measure of democracy, but we will also look at how results change when using a different index for democracy. One other index is the Liberal Democracy Index, still computed by V-Dem. It “emphasizes the importance of protecting individual and minority rights against the tyranny of the state and the tyranny of the majority” (Dahlberg et al., 2016). As such, it takes into account the rule of law and the checks and balances that allow for the preservation of such individual freedoms. The third index used is the Voice and Accountability Index, in the World Bank’s Worldwide Governance Indicators (hereinafter WGI). This index aggregates measures of political freedom and the extent to which the people is able to decide upon which politician is in power – it is similar to, but broader than, the Electoral Democracy Index.
2.2. Democracy and inequality: theoretical framework
4
Marble
Research
Papers
Furthermore, democracy paves the way for redistribution. Under a democratic regime, if the gap between rich and poor is very large (i.e. the median income is lower than the mean), the voter with the median income will have a stronger incentive to support redistributive policies (Meltzer and Richards, 1981, Alesina and Rodrik, 1994, Persson and Tabellini, 1994, Mueller, 2003). Thus, according to Acemoglu and Robinson (1998), democracy should lead to a more equal distribution of income. This model, however, assumes that all voters vote, and a one-person-one-vote system; these assumptions might prove to be unrealistic.
Finally, and in part because of this rule of the median voter, competition among politicians is increased in a democracy. They are thus more inclined to invest tax revenues in public services like education and healthcare, which serve as further, indirect channels of redistribution (Saint-Paul and Verdier, 1992), as will be made clear in the next section.
Another prominent line of argument states that the enforcement of property rights that goes along with inclusive political institutions, as characterised by Acemoglu and Robinson (2012), allows the poor to have access to the markets and to enjoy protection of their acquired capital. They also prevent the elites from erecting barriers to entry (Balcazar, 2015, Acemoglu, 2008). This access to credit and entrepreneurial freedom helps individuals to maximize the benefit from their own competences and fosters innovation, thus raising these individuals’ income. Besides property rights, democratic institutions also enshrine the right to political participation, which lowers the costs of labour unions to partake in the policy-making process. They are thus more capable to press for less wage dispersion (Rodrik, 1999). This line of argument does not, however, consider directly the democratic electoral process. It will thus be quickly investigated, via V-Dem’s Liberal Democracy Index, described in the previous paragraph.
Therefore, summing up these arguments, we would expect income inequality to be negatively affected by the level of electoral democracy, and by broader measures of democracy. In other words, the more democratic a country is, the more equal is its income distribution.
2.3. Through the looking glass: Reverse causality
Liberty, Equality, Democracy
5
roughly the end of the Wars of Roses in 1487 to the Representation of the People Act in 1917, the franchise was based on inter alia the income of the citizen. It took more than four centuries to attain universal (men) suffrage, giving substance to the resilience of economic elites to give up power.In a less unequal society, however, where the emergence of a middle class makes possible the strengthening of civil society, and thus imposes more checks and balances on the power of governing elites, the pressure of popular discontent leads to enlargement of the franchise, as a commitment device of the elites to the reduction of income inequality (Acemoglu and Robinson, 2000). Referring to the hypothesis of Moore (1966), the best way to exemplify this is by looking at the contrast between Russia and Western Europe in the nineteenth century. The middle class that had come into being in Europe through the Industrial Revolution forced the hands of the ruling elite in Britain and Sweden, for instance, whilst the failure of bourgeoisie to emerge in Russia led to the communist, authoritarian regime and did not supplant the autocratic rule of the tsars by a democratic process.
3.
Charlemagne knew it: The role of human capital
The most important control variable when discussing inequality and democracy is human capital. In its most common form, educational achievement, it strongly depends on democracy and largely shapes the income distribution. Education is supported by the democratic process because of its important role as a redistribution channel (Saint-Paul & Verdier, 1993). Indeed, public education, the public good through which all – or almost all – citizens have access to knowledge, is funded by taxes levied by the State. It then works as a sort of lump-sum transfer to every citizen of the country, since every one of them has access to the same amount of education, or at least the same opportunity to benefit from it. To the extent that taxation is not regressive, public education then corresponds to the basic Meltzer-Richards (1981) definition of redistribution from the rich to the poor, and thus is subject to the same median-voter mechanic as other redistribution channels. Furthermore, subsidized public education implies a relatively large tax burden on the rich, who are likely to resist (Birdsall, 1999). If the franchise is limited, or if the affluent have more weight in the policy-making process, education policy may wind up being underfunded. Thus, education is conditional on the quality – or even presence – of democracy.
The equal access to opportunity described in the previous paragraph partly explains the effect of education policy on equalisation of the income distribution. Indeed, as the supply for skilled labour meets demand, the wage compression effect enters into play and wage disparities shrink, as shown by Park (1996). This impact is even more striking when reversing it. In a society with a skewed distribution of education, the set of opportunities for a young adult born in a wealthy family, who can thus afford an education, is much larger and much more diverse than that of someone born poor: she can choose to be a lawyer, a doctor, a hedge fund manager or even a farmer. A broader education policy offers this set of opportunities to a larger fraction of the income spectrum, thus allowing prospects of –and actual – upward mobility in the income ladder, reducing the income gap.
6
Marble
Research
Papers
a consequence of education increase. Brought together, these two sides of the causality suggest an inverted-U shape for the relationship (Knight & Sabot, 1983). However, due to the multicollinearity arising from the use of a quadratic functional form for educational achievement, and since it is beyond the scope of this paper to thoroughly investigate the relationship between education and inequality per se, we will only use a linear specification for human capital.
4.
Does it fit? The model against the data
4.1. Specification and data
The model we estimate attempts to explain the level of inequality by democracy, and accounts for human capital, as described in the previous sections. All these variables are expressed in levels, and for the sake of simplicity of the model we assume a linear relationship. Furthermore, the model contains a lagged value of the level of inequality, to capture the inertia present in the variable. Indeed, the level of inequality is a slow-moving variable: it is hardly possible to dramatically change it overnight – even over a year. The relationship described is summarised by Equation 4.1 below, in which INEQ, EDU and DEMO are respectively measures for the level of inequality, educational achievement and the level of democracy in country 𝑖 at time 𝑡, 𝜇𝑖 is a country-specific, time-invariant error and 𝜀𝑖,𝑡 is the random error
term.
INEQ𝑖,𝑡= 𝛼0+ 𝛼1INEQ𝑖,𝑡−1+ 𝛼2EDU𝑖,𝑡+ 𝛼3DEMO𝑖,𝑡+ 𝜇𝑖+ 𝜀𝑖,𝑡 (4.1)
The measure of inequality we use in the estimation is the Gini index as reported by the World Bank. It is the most widely used measure of income inequality, and estimates the area between the Lorenz curve and the 45-degree line, expressed as a percentage. Table 4.1 presents the summary statistics of the index. The strength of this estimator is its availability and simplicity. Indeed, other measures of inequality are somewhat more accurate, like the Zenga index or the 90/10 ratio, but are either computationally burdensome or very scarcely available, and with a limited number of observations. Human capital is approximated by education, as described in Section III. In this equation, we use the average number of years of education at age 25, as reported by Barro & Lee (2013) (hereinafter B&L). The index for democracy, or electoral democracy as described in Section II, is the Electoral Democracy Index as computed by the Varieties of Democracy Institute. The B&L data and the V-Dem index are retrieved from the Quality of Government Institute dataset. All together, our dataset covers 132 countries, over the period 1980-2012.
Table 4.1 Summary statistics of the Gini index
Gini Index (interpolated)
Percentiles 10% 25% 50% 75% 90%
28.7 32.68 39.32 48.18 54.69
Mean 40.179
Std. Dev. 9.781
Liberty, Equality, Democracy
7
obviously, we cannot extrapolate the data, so if the observations only start after 1980, it is impossible to retrieve the missing observations. After this, the democracy series contains 6787 usable observations, there are 2428 data points for the Gini index, and 5692 for education.Furthermore, the presence of unobserved country-specific heterogeneity, such as culture, historical and regional influence, or ideology, biases the estimation. Thus, we use the fixed-effects panel data estimator, which is equivalent to estimating the equation using ordinary least squares, but including a dummy variable for each country, absorbing away the country fixed effects. Technically, for each series, the fixed-effects estimator subtracts the time mean of the country from the observations. This cancels the unobserved heterogeneous term and the estimation bias vanishes, at the cost of degrees of freedom. Given the relatively large sample size, we can afford losing some degrees of freedom in order to achieve more precision. A Hausman specification test, that tests the null hypothesis that the random-effects estimator is appropriate (i.e. consistent), confirms the need for a fixed-random-effects estimator: with a
𝜒(3)2 -distributed statistic of 216.65, the null hypothesis is unequivocally rejected.
4.2. Empirical results
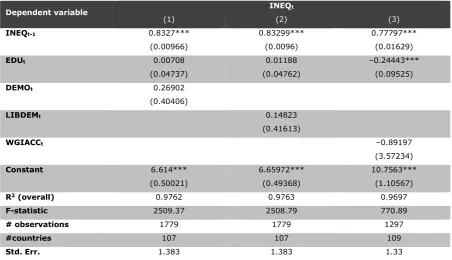
The results of the fixed-effects regression are displayed in Table 4.2. The first column shows the results with the Electoral Democracy Index, the second, with the Liberal Democracy Index, and the third, with the Voice and Accountability Index of the WGI.
These results lead to the following observations. Firstly, our intuition about the inertia in inequality appears to be coherent with the data: the first lag of inequality enters with a highly significant coefficient, not too far from 1. Secondly, in the first two columns, both educational achievement and the two indices for democracy have the wrong sign, although not statistically different from zero. A restriction test allows no rejection of the null that both coefficients are zero, thus the high value of the F-statistic is driven by the inertia present in income inequality.
8
Marble
Research
Papers
Table 4.2 Basic equation estimation results
Dependent variable INEQt
(1) (2) (3)
INEQt-1 0.8327***
(0.00966)
0.83299*** (0.0096)
0.77797*** (0.01629)
EDUt 0.00708
(0.04737)
0.01188 (0.04762)
–0.24443*** (0.09525)
DEMOt 0.26902
(0.40406)
LIBDEMt 0.14823
(0.41613)
WGIACCt –0.89197
(3.57234)
Constant 6.614***
(0.50021)
6.65972*** (0.49368)
10.7563*** (1.10567)
R2 (overall) 0.9762 0.9763 0.9697
F-statistic 2509.37 2508.79 770.89
# observations 1779 1779 1297
#countries 107 107 109
Std. Err. 1.383 1.383 1.33
5.
One way or another: Causality and the instrumentation of democracy
The striking insignificance of the results presented above can be the consequence of one of two causes. The first option is that there is no relationship at all between income inequality and democracy, which contradicts most of the theory presented above. The second option is that two opposite forces are at work, and that their effects cancel each other. Empirically showing that there is no relationship is not only difficult, it is virtually impossible. What is possible, however, is to investigate the causal effect of democracy on inequality. If there is indeed a causal effect, we can argue with somewhat more tangible support that the second option prevails.
Investigating causality in non-experimental econometrics is usually done by instrumenting the variable that is believed to have an effect on the other. The instrumental variable, shortly referred to as instrument, is supposed to be correlated with the instrumented regressor, but not with the dependent variable. The sequel of this section describes several possible instruments for democracy. Once instruments are found, we use a two-stage least-squares fixed-effects estimator to compute coefficients. The idea is to use the instruments to remove the unobservable part of the regressor that is correlated with the error term due to endogeneity, and then estimate the equation with obtained predicted values instead of democracy itself. The results of this regression are presented at the end of this section.
5.1. Incidence of malaria
Liberty, Equality, Democracy
9
has the nice property of being computable for every country, whether zero or not, and the argument underlying its use is similar to that of settler mortality. Threat of malaria was a driver of the decision not to settle and only create extractive institutions in order to send resources to the metropolis. As institutions tend to persist (see e.g. Chaney, 2012, or Acemoglu et al., 2001), one can argue that extractive political institutions today were inherited from the past. Thus, we expect incidence of malaria to be relatively highly correlated with democratic institutions, but much less with income inequality – as it is supposed to affect income inequality only through its impact on the level of democracy. Table 5.1. displays the correlations and confirms this intuition only to some extent.Table 5.1. Correlations with malaria
MALARIAt DEMOt INEQt
MALARIAt 1.00
DEMOt –0.2878 1.00
INEQt 0.1401 –0.0862 1.00
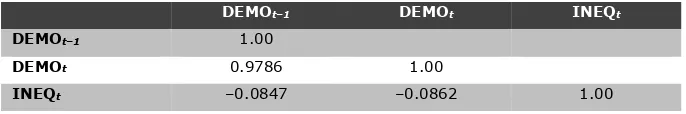
5.2. Lagged democracy
The important inertia that characterises the democracy variable presents one advantage: it causes the variable to have a very high correlation with its own lag. This makes the lag of democracy a good instrument for the level of democracy, as it barely correlates with inequality and highly with democracy, as can be seen from Table 5.2.
Table 5.2 Correlations with lagged democracy.
DEMOt–1 DEMOt INEQt
DEMOt–1 1.00
DEMOt 0.9786 1.00
INEQt –0.0847 –0.0862 1.00
5.3. Child mortality
Child mortality is one of the focuses of health policies. However, we expect to be much less likely to find comprehensive health policies under an extractive, autocratic political regime, than under a democracy. Infant mortality should thus correlate negatively with the level of democracy. Furthermore, even through some particular and unlikely demographic channel, child mortality can hardly have a significant direct influence on the level of inequality. Table 5.3. displays the correlations and gives support to these claims.
Table 5.3 Correlations with infant mortality
CHILDMORTt DEMOt INEQt
CHILDMORTt 1.00
DEMOt –0.5258 1.00
10
Marble
Research
Papers
5.4. Results and discussion
First and foremost, one should keep in mind that relevance of instruments does not necessarily imply a causal relationship between the instrument and the instrumented variable. That is to say, the level of democracy is not directly caused by incidence of malaria or infant mortality rate. Rather, as an instrument is only a variable with some nice properties, we should not make the mistake of interpreting the results as more than a simple correlation, as emphasized in this context by Rodrik et al. (2004). The important feature is whether the instrument has an effect on inequality only through its correlation with democracy.
Table 5.4 displays the results of various two-stage least-squares regressions. The first column recalls the outcome of the fixed-effects regression without instruments. The next three columns show the estimations using each instrument separately. The last three display regressions using combinations of the three instruments. The first and most evident observation is that the inertia in inequality is confirmed by any and all instruments. Education starts with a positive, but not statistically significant coefficient. This result is neither robust nor stable, as the estimate changes signs depending on the instruments used. Nonetheless, only negative values of the coefficient are consistently significant.
12
Marble
Research
Papers
Once again, the results derived in this section allow no conclusive statement about the relationship between the level of democracy and income inequality. The causal effect of democracy is hinted at by the negative coefficient that the level of democracy receives in most IV regressions, but this only makes it plausible; it does not prove this effect: the result is not robust to other specifications and is not significant anyway. Other indicators of democracy, such as the Liberal Democracy Index and the WGI Voice and Accountability index, discussed in the previous section, give the same inconclusive results.
6.
Investigating the cross-sectional relationship
A pitfall of the methodology presented so far is the difficulty to exploit the cross-sectional variation. The information contained in this variation is discarded by the fixed-effects estimator to the profit of the time variation. In order to exploit this aspect of the data as well, we use yet another instrument that allows for comparison across countries and that, due to data limitations, would not be usable in a time-series context.
6.1. Visa liberalisation as an instrument
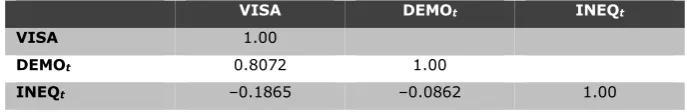
On the roadmap to democracy of the European Union, stands the process of visa liberalisation. In other words, in order to become a democracy in the eyes of the EU, a state needs to negotiate a waver of the visa requirements for nationals of the EU member states, and the other way around. This gives birth to the idea that the more democratic a country is, and the more the rule of law and the civil liberties are respected and enforced, the more visa-waving agreements it should have with other countries. Indeed, intuitively, democratic regimes are less keen to negotiate this kind of agreement with authoritarian regimes, and same goes for autocratic regimes amongst themselves. Thus, we expect the liberalisation of visa requirements to be positively correlated with the level of democracy. However, there is no direct way in which the visa-free travel opportunities of nationals influence the level and the structure of inequality, thus we expect a low correlation between these. As a proxy for visa liberalisation, we use the number of destination countries to which a national can travel without the need for a visa, or where the visas are delivered upon arrival, in 2015. Table 6.1 displays the correlations and substantiates the intuition described above.
Table 6.1 Correlations with visa-free destinations
VISA DEMOt INEQt
VISA 1.00
DEMOt 0.8072 1.00
INEQt –0.1865 –0.0862 1.00
6.2. Cross-sectional results
Liberty, Equality, Democracy
13
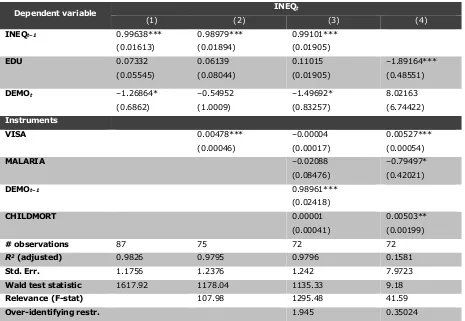
Table 6.2 Results of cross-sectional 2SLS regressionsDependent variable INEQt
(1) (2) (3) (4)
INEQt–1 0.99638***
(0.01613) 0.98979*** (0.01894) 0.99101*** (0.01905) EDU 0.07332 (0.05545) 0.06139 (0.08044) 0.11015 (0.01905) –1.89164*** (0.48551)
DEMOt –1.26864*
(0.6862) –0.54952 (1.0009) –1.49692* (0.83257) 8.02163 (6.74422) Instruments
VISA 0.00478***
(0.00046)
–0.00004 (0.00017)
0.00527*** (0.00054)
MALARIA –0.02088
(0.08476)
–0.79497* (0.42021)
DEMOt–1 0.98961***
(0.02418)
CHILDMORT 0.00001
(0.00041)
0.00503** (0.00199)
# observations 87 75 72 72
R2 (adjusted) 0.9826 0.9795 0.9796 0.1581
Std. Err. 1.1756 1.2376 1.242 7.9723
Wald test statistic 1617.92 1178.04 1135.33 9.18
Relevance (F-stat) 107.98 1295.48 41.59
Over-identifying restr. 1.945 0.35024
Column 2 and 3 exhibit the results of two-stage least-squares regressions, using first only VISA as an instrument, then combining it with the three others described in the previous section. The last column shows the results of the estimation of a static specification, i.e. without lagged inequality, which allows to look at the very long run. Indeed, the first three specifications are close to difference equations, given the coefficient of lagged inequality.
The first striking result is the negative, significant coefficient on democracy in the first regression already. However, even if it is reassuring to some extent, the small sample size does not allow for certainty. Next to this observation, the introduction of visa-free travel as an instrument for democratic institutions does not help in any way on its own, despite the relevance of the instrument (stemming from its statistical significance). When it is included along with the other, previous instruments, however, the coefficient of democracy is larger in absolute value, and also significant at the 10% level. The F-statistic for the relevance of the instruments is 1295.48, much higher than the benchmark of 10 usually employed, thus corroborating the relevance of the instruments, and the J-test statistic of the four instruments is 1.945, allowing no rejection of the null – thus confirming the exogeneity of the instruments. Roughly the same results hold for the two other indices.
cross-14
Marble
Research
Papers
sectional regressions for different points in time, with or without instruments, do not consistently yield the same kind of results.
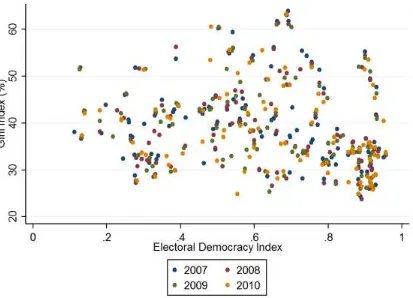
It becomes evident that cross-sectional regressions do not yield any more insight from the plot depicted in Figure 6.1. The scatter plot displays the inequality levels for all sample countries against their democracy score. The mild pattern that appears in the regression for 2010 (values in orange), that is, a slightly decreasing slope, is barely detectable on the graph. As this pattern vanishes in other years, it appears to be only an illusion – in other words, the scatter does not give any hint of a cross-sectional relationship to be uncovered.
Figure 6.1. Scatter plot of the Gini index against democracy in selected years.
7.
Autocracies vs. democracies
Liberty, Equality, Democracy
15
7.1. The world in black and white: the use of binary variables
A binary classification of states, of course, is simplistic and certainly inaccurate. Everyone can agree that there is more to democracy than a ‘yes’ or a ‘no’, and it is also our belief. However, using two different types of classification allows us to somehow reduce the bias – and, to some extent, the inaccuracy – that they may contain. The first way to separate democracies and non-democracies is to use a binary variable constructed by Cheibub et al. (2010). The democracy dummy is based on the definition of a democracy as a regime in which “the executive and the legislature [are] directly or indirectly elected by popular vote, multiple parties are allowed, there is de facto existence of multiple parties outside of regime front, there are multiple parties within the legislature, and there has been no consolidation of incumbent advantage” (Dahlberg et al., 2016). The variable takes value 1 if the regime meets these criteria, and 0 otherwise. The other specification that we use is simply to identify as a non-democratic regime, every regime that scores less than 0.5 in the Electoral Democracy Index of V-Dem. Its score in the index is replaced by zero if it is the case, one if not.
7.2. Results and discussion
Table 7.1 displays the results of fixed-effects regressions using these dummies or interactions between them and the level of democracy. The endogeneity of the dummy variables should not be a problem, and that of interactions is most certainly not, as the correlation between residuals of the equation and the corresponding interaction is virtually zero. Furthermore, as the previous sections showed, instrumentation of democracy does not bring much to the results; therefore, the regressions presented here are simple fixed-effects regressions.
Table 7.1 Results of regressions with dummy variables and interactions
Dependent variable INEQt
(1) (2) (3) (4)
INEQt–1 0.82183***
(0.01031)
0.82212*** (0.01027)
0.83304*** (0.0097)
0.83348*** (0.00967)
EDUt 0.05952
(0.05161)
0.05235 (0.05241)
0.02224 (0.04635)
0.02076 (0.04676)
DUM1t 0.21381
(0.16589)
DUM2t –0.07648
(0.14182)
DUM1t*DEMOt 0.37303
(0.24934)
DUM2t*DEMOt –0.04273
(0.21765)
# observations4 1608 1598 1779 1779
# countries 108 106 109 107
R2 (overall) 0.9742 0.9741 0.9761 0.9762
Wald statistic 2139.66 2164.39 2484.28 2508.63
Std. Err. 1.4124 1.4044 1.38997 1.3833
16
Marble
Research
Papers
As usual, the first lag of inequality is important and has a coefficient close to one. Education does not help much, its coefficient being consistently positive but insignificant. The use of the second dummy, or its interaction with democracy, yields a negative (albeit insignificant) coefficient in both cases. However, this result is not robust to the use of the other dummy or its interaction with democracy, which both enter with a positive, insignificant coefficient. Therefore, as in previous sections, the negative effect of democracy on income inequality is plausible, but neither persistent in the results nor proven. The contradictory effects in a democracy and in an autocracy, if they exist, cannot be disentangled at this stage, thus this specification with two separate groups does not bring any more insight to the analysis conducted so far.
8.
Through the magnifying glass: Regional effects
All of the above was built upon the assumption of country-specific effects; that is, characteristics that are unique to each and every country. It might then be fruitful to somewhat restrict further this assumption and assume regional effects instead, in order to capture the fact that the countries of some regions of the world are subject to the same kind of evolutions and suffer the same consequences of historical events, by allowing for differences in the slope of each region. Moreover, when regressing with country-wise fixed-effects, one tries to derive a relationship independent of the conditions present in each nation. This might fail to acknowledge that some specific context is needed in order to achieve such a relationship, a context that is not necessarily present in every state. This could be history, structure of the economy, ideology, legal framework, religion — who knows. The bottom line is that the relationship might not be independent of exogenous, observable or not, factors. The result of regressions including interactions between dummies for regional groups of countries and the level of democracy, as measured by V-Dem’s Electoral Democracy Index, are presented in Table 8.1.
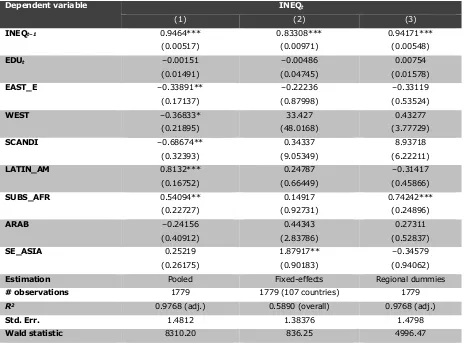
The first column displays the results of a pooled regression with only regional interactions. As always, the inertia in the level of inequality is high. Then, turning to the interactions, significant differences appear in the estimates. Eastern Europe, with its communist past and its recent, rapid and massive democratisation, shows a negative effect of the level of democracy on income inequality. This fully supports the theory laid out in Section II: democratisation equalises the income distribution. Western Europe (and the U.S.A. and Canada) and Scandinavian countries also experience this relationship, albeit less significantly for the Western world. Industrial economies usually being long-established economies, the effect is still somewhat present in their income distributions: more voice given to the people leads to less inequality.
Liberty, Equality, Democracy
17
Table 8.1 Regional interactions regressionsDependent variable INEQt
(1) (2) (3)
INEQt–1 0.9464***
(0.00517)
0.83308*** (0.00971)
0.94171*** (0.00548)
EDUt –0.00151
(0.01491)
–0.00486 (0.04745)
0.00754 (0.01578)
EAST_E –0.33891**
(0.17137)
–0.22236 (0.87998)
–0.33119 (0.53524)
WEST –0.36833*
(0.21895)
33.427 (48.0168)
0.43277 (3.77729)
SCANDI –0.68674**
(0.32393)
0.34337 (9.05349)
8.93718 (6.22211)
LATIN_AM 0.8132***
(0.16752)
0.24787 (0.66449)
–0.31417 (0.45866)
SUBS_AFR 0.54094**
(0.22727)
0.14917 (0.92731)
0.74242*** (0.24896)
ARAB –0.24156
(0.40912)
0.44343 (2.83786)
0.27311 (0.52837)
SE_ASIA 0.25219
(0.26175)
1.87917** (0.90183)
–0.34579 (0.94062)
Estimation Pooled Fixed-effects Regional dummies
# observations 1779 1779 (107 countries) 1779
R2 0.9768 (adj.) 0.5890 (overall) 0.9768 (adj.)
Std. Err. 1.4812 1.38376 1.4798
Wald statistic 8310.20 836.25 4996.47
Those regimes that were in place were installed by military coups after decolonisation and did not serve an ideology about equality – on the contrary. The effect may in fact very well be there, but other forces are at work, that could hide what we are looking for: market liberalisation, openness to trade, limited access to credit, the plague of corruption, which are all characteristics of Latin American countries, may be at least as important as democracy itself. On top of this, these results raise an important point, also made by Alesina & Giuliano (2011): ideology matters. In the former communist, equality-driven Eastern Europe, the effect of democracy is highly significant; whilst in the West, it is less important. The omnipresent liberalism in this part of the world could arguably be a reason for this attenuated effect.
18
Marble
Research
Papers
3, in which, instead of the fixed-effects model, we use regional dummies, restricts this assumption further by allowing for different intercepts for each region, rather than country.
This helps preventing omitted variable bias. The results are similar to the second column, only Sub-Saharan Africa receives a positive, highly significant slope coefficient, confirming the intuition underlined above.
9.
Concluding remarks
The aim of this paper was to investigate the alleged negative relationship between democracy and income inequality. As the simple fixed-effects regression did not yield conclusive results, we tried different models to disentangle the possible counter-effects and to overcome the issue of the endogeneity of democracy. The latter was done by instrumenting democracy, both in panel and cross-sectional settings, which both induced mixed interpretations. The inverse effect that dictatorships induce more equality was tackled by separating the sample into two groups, democracies and autocracies, yet this specification did not yield more consistent results. In a nutshell, the findings presented in this paper allow to conclude that there is no systematic or uniform effect of democracy on the income distribution.
This conclusion might have been very different, had this paper been written twenty or thirty years ago. Income inequality was at an all-time low, democracy was blooming in regions of the world as the third wave of democratisation broke on Latin America and Eastern Europe. Since then, however, income inequality has risen in the Western world, virtually composed only of democracies, whilst it has not been moving much in autocracies. There are of course factors affecting the level of inequality, such as the low voter turnout among the poor, and obstacles standing in the way of equalisation of incomes, such as the well-anchored ideology of free market capitalism. Indeed, as the level of inequality increased and the democratic character of the political process did not decrease, the skew of the income distribution has to be explained by other factors than democracy per se. The financial deregulation that happened through the 1980s and 1990s is a possible explanation, as are the decreasing turnout in elections and the arguably larger share of political power of economic elites. Nonetheless, the fact remains that democratic institutions in themselves do not lead to lower inequality, nor do they prevent it from rising.
Liberty, Equality, Democracy
19
democracy having evolved from a system favouring perfect equality – communism –, this could help explain the lower inequality in spite of relatively high market freedom. These are, of course, hypotheses that have not been investigated in this paper, and we leave this to future research.20
Marble
Research
Papers
References
Acemoglu, D. (2008). Oligarchic vs. democratic societies. Journal of the European Economic Association, 6(1), 1-44.
Acemoglu, D., Johnson, S., & Robinson, J. A. (2001). The colonial origins of comparative development: An empirical investigation. The American Economic Review, 91(5), 1369-1401.
Acemoglu, D., & Robinson, J. A. (1998). Why did the west extend the franchise? Democracy, inequality and growth in historical perspective. Quarterly Journal of Economics, 115(4), 1167-69.
Acemoglu, D. & Robinson, J. A. (2000). Inequality, growth, and development: democratisation or repression. European Economic Review, 44, 683-693.
Acemoglu, D., & Robinson, J. A. (2009). Economic origins of dictatorship and democracy. Cambridge: Cambridge University Press.
Acemoglu, D., & Robinson, J. A. (2012). Why Nations Fail: The origins of power, prosperity and poverty. New York: Crown Publishers.
Alesina, A., & Giuliano, P. (2011). Preferences for redistribution. Handbook of Social Economics, 93-132. doi:10.2139/ssrn.1333762
Alesina, A., & Perotti, R. (1994). The political economy of growth: a survey of recent literature. The World Bank Economic Review, 8(3), 351-371.
Balcázar, C. F. (2015). Long-run effects of democracy on income inequality in Latin America. The Journal of Economic Inequality. doi:10.1007/s10888-016-9329-3
Barro, R. & Lee, J.W. (2013). A new data set of educational attainment in the world, 1950-2010. Journal of Development Economics, 104, 184-198.
Birdsall, N. (1999). Education: The People’s Asset. Center for Social and Economic Dynamics Working Paper.
Bonica, A., McCarty, N., Poole, K. T., & Rosenthal, H. (2013). Why hasn’t democracy slowed rising inequality? Journal of Economic Perspectives, 27(3), 103–124. doi:10.1257/jep.27.3.103
Booth, A. (2000). Poverty and inequality in the Soeharto era: An assessment. Bulletin of Indonesian Economic Studies, 36(1), 73-104.
Bourguignon, F., & Verdier, T. (2000). Oligarchy, democracy, inequality and growth. Journal of Development Economics, 62(2), 285–313. doi:10.1016/s0304-3878(00)00086-9
Chaney, E. (2012). Democratic change in the Arab World, past and present. Brookings Papers on Economic Activity, Spring 2012, 363-414.
Dahlberg, S., Holmberg, S., Rothstein, B., Khomenko, A. & Svensson, R. (2016). The Quality of Government Basic Dataset, version Jan16. University of Gothenburg: The Quality of Government Institute, http://www.qog.pol.gu.se doi:10.18157/QoGBasJan16
Drury, C. A., Krieckhaus, J., & Lusztig, M. (2006). Corruption, democracy, and economic growth. International Political Science Review, 27(2), 121–136. doi:10.1177/0192512106061423
Galor, O. (2000). Income distribution and the process of development. European Economic Review, 44(4), 706-712.
Houle, C. (2014). Inequality, economic development and democratization. SSRN Electronic Journal. doi:10.2139/ssrn.1622439
Liberty, Equality, Democracy
21
Knight, J. B., & Sabot, R. H. (1983). Educational expansion and the Kuznets effect. American EconomicReview, 73(5), 1132-1136.
Meltzer, A. H., & Richards, S. F. (1981). A rational theory of the size of government. Journal of Political Economy, 89(5), 914-927.
Moore, B. (1966). The Social Origins of Dictatorship and Democracy: Lord and Peasant in the Making of the Modern World. Boston: Beacon Press.
Mueller, D. C. (2003). Public Choice III. Cambridge: Cambridge University Press.
Muller, E. N. (1985). Income inequality, regime repressiveness, and political violence. American Sociological Review, 47-61.
Park, K. H. (1996). Educational expansion and educational inequality on income distribution. Economics of Education Review, 15(1), 51-58.
Perotti, R. (1996). Growth, income distribution, and democracy: What the data say. Journal of Economic Growth, 1(2), 149–187. doi:10.1007/bf00138861
Persson, T., & Tabellini, G. (1994). Is inequality harmful for growth? The American Economic Review, 83(3), 600-621.
Rodrik, D. (1999). Democracies pay higher wages. The Quarterly Journal of Economics, 114(3), 707-738.
Rodrik, D., Subramanian, A., & Trebbi, F. (2004). Institutions Rule: The primacy of institutions over geography and integration in economic development. Journal of Economic Growth, 9, 131-165. Ryvkin, D., & Semykina, A. (2013). The chicken or the egg: An experimental study of democracy
survival, income, and inequality (No. wp2013_12_01).
Saint-Paul, G., & Verdier, T. (1993). Education, democracy and growth. Journal of Development Economics, 42(2), 399–407. doi:10.1016/0304-3878(93)90027-k
Savoia, A., Easaw, J., & McKay, A. (2010). Inequality, democracy, and institutions: A critical review of recent research. World Development, 38(2), 142–154. doi:10.1016/j.worlddev.2009.10.009 Thorbecke, E., & Charumilind, C. (2002). Economic inequality and its socioeconomic impact. World