University of New Orleans University of New Orleans
ScholarWorks@UNO
ScholarWorks@UNO
University of New Orleans Theses and
Dissertations Dissertations and Theses
Fall 12-20-2018
Innovation, Ownership and IPO Underpricing
Innovation, Ownership and IPO Underpricing
Roman Bohdan rbohdan@uno.edu
Follow this and additional works at: https://scholarworks.uno.edu/td
Part of the Corporate Finance Commons, and the Finance and Financial Management Commons
Recommended Citation Recommended Citation
Bohdan, Roman, "Innovation, Ownership and IPO Underpricing" (2018). University of New Orleans Theses and Dissertations. 2550.
https://scholarworks.uno.edu/td/2550
This Dissertation is protected by copyright and/or related rights. It has been brought to you by ScholarWorks@UNO with permission from the rights-holder(s). You are free to use this Dissertation in any way that is permitted by the copyright and related rights legislation that applies to your use. For other uses you need to obtain permission from the rights-holder(s) directly, unless additional rights are indicated by a Creative Commons license in the record and/ or on the work itself.
Innovation, Ownership and IPO Underpricing
A Dissertation
Submitted to the Graduate Faculty of the University of New Orleans in partial fulfillment of the requirements for the degree of
Doctor of Philosophy in
Financial Economics
by
Roman Bohdan
B.S. Ivan Franco L’viv National University, 2003
M.S. Ukrainian State University of Economics and Finance, 2007 M.B.A. Eastern Washington University, 2011
M.S. University of New Orleans, 2015
ii
iii Dedication
To
iv
Acknowledgments
v
Table of Contents
List of Tables ... vii
Abstract ... viii
Chapter 1 ... 1
I. Introduction ... 1
II. Hypotheses Development ... 4
II.1. Identifying Targets ... 4
II.2. Strategies to Reduce Control Exercised by Pre-Dual Management ... 4
II.3. Improved Efficiency ... 6
II.4. Focused Acquisitions ... 6
III. Data ... 7
III.1. Sample ... 7
III. 2. Variables ... 8
IV. Results ... 12
IV.1. Testing Hypothesis 1: Identification of Targets (Pre-dual Period) ... 13
IV.2. Testing Hypothesis 2: Strategies to Reduce Managerial Control... 21
IV.3. Hypothesis 3: Reducing Internal Capital Problems & Improving Investment Efficiencies ... 24
IV. 4. Testing Hypothesis 4: Focused Acquisitions ... 36
IV. 5. Performance: – DLO Firms vs. Control Firms ... 39
VI. Conclusion ... 49
References ... 51
Chapter 2 ... 53
I. Introduction ... 53
II. Hypothesis Development ... 57
III. Methodology and Data ... 62
3.1. Variable Construction ... 62
3.2. Data Sources ... 65
IV. Empirical Results ... 68
4.1. Innovation strategy and underpricing ... 68
vi
4.3. Innovation strategy, withdrawal, and the timing of the IPO process ... 83
4.4. Post IPO innovation strategy and withdrawn firms. Difference-in-Differences (DiD) framework ... 84
4.5. Innovation portfolio and Multiple Bookrunners ... 86
4.6. Innovation portfolio and Analysts’ Coverage ... 87
4.7. Robustness Checks ... 93
V. Conclusion ... 93
References ... 95
Appendix A. ... 99
Appendix B. ... 105
Appendix C ... 109
Appendix D. ... 111
vii List of Tables Chapter 1
Table 1 ... 8
Table 2 ... 13
Table 3 ... 15
Table 4 ... 18
Table 5 ... 19
Table 6 ... 20
Table 7 ... 22
Table 8 ... 25
Table 9 ... 27
Table 10 ... 30
Table 11.. ... 31
Table 12 ... 32
Table 13 ... 33
Table 14 ... 38
Table 15 ... 40
Table 16. ... 43
Table 17. ... 47
Chapter 2 Table 1 ... 67
Table 2 ... ...70
Table 3 ... 75
Table 4 ... 77
Table 5 ... 80
Table 6 ... 82
Table 7 ... 85
Table 8 ... 87
Table 9 ... 89
Table 10 ... 90
viii Abstract
This dissertation consists of two empirical essays. The first chapter titled: “Hedge Fund Activism and Dual Ownership of U.S. Multinationals”. Harford, Wang & Zhang (2017) conclude that holding high cash balances abroad to avoid US taxes causes internal capital markets and investments distortions. We posit that hedge funds target MNCs with more severe internal capital and agency problems. We demonstrate that upon acquiring dual ownership in these firms, hedge funds reduce internal capital problems and improve investment, especially innovation, efficiencies. To further reduce agency costs of foreign cash holdings, hedge funds engage dual firms in focused acquisitions. These improvements are reflected in superior performances of dual firms relative to non-dual firms. Chapter 2 titled as “Innovation Strategies & IPO Underpricing”. In this chapter, we investigate how a firms’ choice of pre-IPO innovation strategies affect IPO pricing. We differentiate the orientation of the issuing firm’s innovation portfolio in terms of exploitative orientation versus explorative orientation based on citations of patents across technology classes. We introduce a measure of innovation power to generate breakthrough innovations. We show that the issuing firms with greater innovation power, especially firms with exploratory orientation of a patent, significantly decrease underpricing and have the power to bargain a higher offer price. Our results suggest that a higher exploration strategy requires more time to negotiate a higher offer price while more valuable innovation requires less time to bargain at the higher offer price.
1
Chapter 1
Hedge Fund Activism and Dual Ownership of U.S. Multinationals
“BlackRock also engages to understand a company’s priorities for investing for long-term growth, such as research, technology and, critically, employee development and long-term financial well-being…. If tax reform also includes some form of reduced taxation for repatriation of cash trapped overseas, BlackRock will be looking to companies’ strategic frameworks for an explanation of whether they will bring cash back to the U.S., and if so, how they plan to use it. Will it be used simply for more share buybacks? Or is it a part of a capital plan that appropriately balances returning capital to shareholders with prudently investing for future growth?”
–Laurence Fink, CEO, BlackRock, 2017
I. Introduction
Empirical evidence generally supports the view that hedge fund activism creates value for
shareholders by effectively influencing the governance, capital structure decisions, and operating
performance of target firms (Brav et al. 2010). Brav et al. (2016) find that resulting from hedge
fund activism, target firms experience increases in innovation output, measured by both patent
counts and citations. They argue that the reallocation of innovative resources and the redeployment
of human capital contribute to the refocusing of the scope of innovation. Alsan and Kumar (2016)
show that hedge fund activism has negative impact on real and shareholder wealth of target’s rivals
and improves productivity and capital allocation of target.
If hedge funds are able to create long-term value of the target and improve innovation
output (measured by patent counts and citations) by holding shares of the target firm, what
incentive do they have to simultaneously hold debt (dual ownership) of the same company?
2
Rossi, 2016 suggest that dual holders might accept lower premium in merger negotiations when
they stand to gain more from appreciation of their bond stakes in the target. Second, Jiang, Li, and
Shao (2010) argue that dual ownership mitigates shareholder-creditor conflicts and thereby lowers
loan yield spreads. In a similar vein, Yang (2017) propose that institutional dual-holders can curb
excessive risk taking (i.e., wealth transfer) by lowering shareholder-creditor conflicts.
Based on Harford, Wang and Zhang (2017) (hereafter HWZ), we posit in this paper that an
additional motive of dual ownership is to provide capital to firms facing internal capital problems
resulting from situations where MNCs hold a large amount of foreign cash holdings to avoid
(reduce) repatriation tax cost. According to HWZ (2017), investors place a significant discount on
a firm’s foreign cash holdings, leading to disruptions in the internal capital market and resulting
investment distortions (i.e., domestic underinvestment and overseas overinvestment). In this paper,
we demonstrate that an equally important motive why less-regulated funds (hereafter, LRFs)1,
comprised mainly of hedge funds, acquire dual ownership (hereafter, DLOs) is to reduce capital
market as well as investment inefficiencies resulting from foreign cash reserves. US multinational
companies (MNCs) provide a perfect laboratory to test this proposition as these companies are
known to accumulate a large cash balance abroad in order to avoid repatriation tax.
We propose that LRFs’ motive in taking dual positions in the target firm is to bring about
permanent improvements in these firms. In so doing, DLOs would first inject debt capital as a
means to mitigate internal capital and investment distortions. Second, to further improve internal
capital markets and investment efficiencies, DLOs would wrest control from the current
management by adopting strategies (as suggested in the literature on hedge fund activism) that
include a) reducing insider ownership, b) engaging in proxy contests and c) weakening
3
takeover provisions. Third, improved investment efficiencies will likely entail enhanced
innovation efficiency (IE) (see Hirshleifer et al. 2013)2. Fourth, in efficiently addressing the
agency problems associated with foreign cash holdings, DLOs will get affiliated firms involved in
focused acquisitions. Finally, these combined efforts would have a positive impact on
DLO-affiliated firm’s future operating as well as marketing performances.
We hypothesize that 1) hedge funds systematically target those MNCs whose foreign cash
balances are likely to exhibit the severest distortions in the internal capital markets, causing thereby
potentially greater investment distortions; 2) upon acquiring the dual position, hedge funds gain
control from the existing management by taking strategic steps that include reducing insider
ownership, resorting to proxy contest and fighting anti-takeover provisions, 3) successful
implementation of these tactics should lead to more efficient investment decisions, especially the
innovation efficiencies of the dually-owned firms, 4) DLOs would engage dually-owned firms in
acquiring targets that would bring about synergies, and 5) DLO-firms would experience better
operating and market performances.
Our results are consistent with the hypotheses above. The firms in which less regulated
institutions take dual positions are decidedly the ones with more severe internal capital problems.
In the post-dual stage, the DLOs engage in tactics to take away control from the pre-dual
management in their successful efforts to improve the target’s investment as well as innovative
efficiency (both at the parent and the foreign subsidiary level). Dually-owned MNCs are more
likely than their non-dual counterparts to engage in and complete focused acquisitions abroad. We
2 According to Hirshleifer et al. (2013), innovation efficiency, which is positively related to the future operating
4
find that the target’s innovative efficiency is a good predictor of the future operating performance
and the future stock returns. Overall, we show that DLOs mitigate internal capital problems by
mobilizing the internal capital market and improving investment efficiencies of target MNCs.
II. Hypotheses Development
II.1. Identifying Targets
The MNCs are many and almost all of them carry heavy cash balance abroad to avoid
repatriation tax. How do DLOs select their target from this universe? According to HWZ (2017),
the higher the repatriation tax, borrowing costs and agency problems, the higher are the investment
distortions. Thus, we propose the following hypothesis.
Hypothesis 1. DLOs would likely take dual position in MNCs which are more severely
exposed to agency costs of foreign cash holdings.
II.2. Strategies to Reduce Control Exercised by Pre-Dual Management
Undertaking the dual positions is just the first step in the strategic scheme of DLOs. In their
goal to reduce distortions in internal capital markets and investment efficiencies of targets, DLOs
are likely to take actions to consolidate their power in order to forge a long-term investment
efficiencies of target firms. Brav, Jiang and Kim (2010) find that hedge funds create value for
shareholders by effectively influencing the corporate governance of target firms. The pertinent
literature identifies the means adopted by DLOs to influence the governance mechanisms by
gaining control from the existing management via a) elimination of insider trading, b) proxy
5
Insider trading allows corporate insiders to exploit other investors (Porta et al. 2006 and
Djankov et al. 2008). Companies with larger excess control rights of insiders are more financially
constrained (Lin et al. 2011). Constraining corporate insiders by enforcing insider trading laws
may promote innovations (Levine et al. 2017). Additionally, the extant literature suggests that
reducing insider trading increases stock liquidity that incentivize managers to invest in long-run,
value-maximizing projects (for example, Levine et al. 2017). Thus, it is expected that DLOs would
engage in activities that mitigate insiders’ ability to exploit other investors. Our hypothesis appears
below.
Hypothesis 2 A. DLOs will engage in measures that reduce the control of insider owners.
Proxy Fight is an effective mechanism to reduce insiders’ control (Shleifer and Vishny
(1986), Bhattacharya (1997), Maug (1999), Bebchuk and Hart (2001), and Gilson and Schwartz
(2001)). Because of their position as a debtor, DLOs would have an advantage in gaining corporate
control via proxy contests through restrictive covenants or expedited repayment requirement. For
example, creditors may agree to provide lower cost capital for business strategy under the
agreement of “Proxy Put” as a protection from expropriation of their wealth. In this context, the
proxy put provides an incentive to shareholders to vote for the nominees put up by the DLOs.
Thus, we hypothesize:
Hypothesis 2 B. DLOs will engage in proxy contests towards seizing control of the
dual-affiliated firm.
Grossman and Hart (1988) and Harris and Raviv (1988), among others, contend that
anti-takeover provisions (ATPs) serve to entrench firm management and lessen the effectiveness of
equity market discipline on management. It is expected that DLOs would engage in activities to
6
Hypothesis 2 C. DLOs will engage in minimizing anti-takeover provisions.
II.3. Improved Efficiency
According to Brav et al. (2016) firms targeted by hedge fund activists experience
an improvement in innovation efficiency in terms of increased innovation output, measured by
both patent counts and citations. with stronger effects seen among firms with more diversified
innovation portfolios. The authors add that the reallocation of innovative resources and the
redeployment of human capital contribute to the refocusing of the scope of innovation. Consistent
with their goal of reducing internal capital and investment distortions, DLOs are expected to bring
about improved efficiencies in investment and innovation decisions in the post-dual period.
Hypothesis 3. DLO-affiliated firms would exhibit higher investment and innovation
efficiencies in the post-dual period.
II.4. Focused Acquisitions
Foreign cash holdings create similar agency problems as free cash flows do, with the main
difference being that, in the first scenario, free cash flows accumulate abroad. HWZ (2017) report
that investors discount value of foreign cash holdings in anticipation of the misuse of cash by the
management.
Jensen (1986) recommends three main ways to reduce agency costs of free cash flows:
paying dividends, increasing debt, and getting involved in acquisitions. Jensen goes on to suggest
that increasing debt is a better tool than increasing dividends (since debt entails commitments,
while dividends do not) and focused mergers are superior to conglomerate merger (as synergy adds
value). Increasing dividend is not a viable option for the DLO-held firms since the parent firm
7
Issuance of debt is an effective tool for controlling free cash-flow related agency costs but falls
short when controlling agency costs that are related to foreign cash holdings. These limitations
leave only one option open to DLOs which is to use foreign cash holdings to acquire foreign firms,
focusing primarily on mergers that create synergy. In the same vein, HWZ (2017) suggest that, in
a trade-off between cash repatriation and foreign investments, the managers would opt to keep
money abroad if they think the money could be used to make foreign acquisitions with valuable
synergies. Thus, we hypothesize:
Hypothesis 4. DLOs would engage in foreign acquisitions, especially those that create
synergy.
III. Data III.1. Sample
We define U.S. MNCs as corporations incorporated in the U.S. that report foreign sales,
foreign income or foreign taxes in any year in our sample. We exclude firms in finance and utility
industries. Our treatment sample consists of 658 firms in which hedge funds hold dual positions
(DLO firms) during the 2007-2014 period. This period is characterized by US firms holding
increased leverage along with a surge of institutional investor activism.
Appendix A describes issued new bonds and equity held by DLOs by year. Appendix A
also reports average equity held by DLOs as a percentage of total equity. On average DLOs hold
$14.958 billion in newly issued bonds and 6.13 percent of total equity.
III.1.1. Sub-sample
To facilitate hypothesis testing, we form a control group consisting of MNCs in which
8
treated firms in terms of the industry and year using propensity scores (nearest neighbor) on size,
distinct number of foreign subsidiaries and distinct number of subsidiaries in tax haven countries.
The combined sample (treatment and control) comprises 9070 firm-year observations.
Table 1. Firm Characteristics: DLOs vs. Controls
This table reports summary statics for US MNCs with DLOs along with matched control firms. The sample consists of 658 unique U.S. MNCs in which DLOs hold dual positions during the 2007-2014 period. The control firms are firms matched with treated firms in the same industry and year using propensity scores (nearest neighbor) on size, distinct number of foreign subsidiaries and distinct number of subsidiaries in the tax haven country. The combined sample comprises 9070 firm (both DLO and control)-year observations. We compute foreign and domestic assets and profit margins using the Compustat geographic segment file. Upper-asterisks such as *, **, and *** denote significance at the 10%, 5%, and 1% level, respectively.
(1) (2) (3)
DLOs Control DLOs-Control
Size 8.406 5.952 2.455***
Domestic Assets/Total Assets 0.804 0.910 -0.106***
Foreign Assets/Total Assets 0.196 0.090 0.106***
Cash (in $mil) 1630.107 712.470 917.637***
Cash/Total Assets 0.338 0.976 -0.638***
Leverage 0.318 0.237 0.081***
Domestic Profit Margin 0.010 0.014 -0.004**
Foreign Profit Margin 0.033 0.020 0.013***
Dividend-paying firms /total # of firms 0.718 0.461 0.257***
Table 1 provides summary statistics of the DLO firms as well as the control group. The
treatment group is significantly larger in size than the control group. As a percentage of total assets,
the treatment group invests significantly more in foreign assets and significantly less in domestic
assets than their control counterpart, providing preliminary evidence of more severe internal
capital distortions of the treatment group. A significantly larger number of DLO firms are dividend
payers and carry more debt. Finally, the control group carries more cash (as a percentage of total
assets) than the treatment group.
III. 2. Variables
9
We identify dual ownership by adopting “brand matching” approach developed by
Bodnaruk & Rossi (2016) and measure dual ownership at the financial conglomerate level. The
financial conglomerate holding is aggregated holdings from the subsidiary to the parent level. We
follow our matching procedure with manual check for accuracy. Finally, we exclude firms, which
have dual ownership by highly regulated institutional investors such as mutual funds, pension
funds and insurance companies from our main sample. We determine bond ownership by using
several SEC filings such as:
a) Schedule 13D which makes it mandatory to file for anyone acquires beneficial
ownership of more than 5% of any security class of publicly traded;
b) Schedule 13F and Proxy Statements for owners with beneficial ownership of less than
5% in bonds.
III.2.2. Governance variables
Insider Trading: Insiders’ stock purchases (sales), denoted as ISP (ISS), are measured as
the amount of stock purchased (sold) by insiders scaled by total assets at time t. Insider
ownership (IS) is measured as percentage of shares held by insiders relative to total shares
outstanding. The Insider trading data are collected from the Bloomberg.
Covenants violations: This is an indicator variable (CV) that takes on a value of 1 if
information about a firm’s covenant violation is available in the dataset of Roberts and Sufi
(2009). The dataset contains all covenants violation filed with the SEC during 1996 to
2012.
Proxy contest: Information about victory of a dissident in a proxy contest (Vict) is measured
10
(Settle). The information about results of proxy contests is retrieved from the SDC
Platinum.
Anti-takeover provisions: The proxy variables representing anti-takeover provisions take
on a value of one if a firm has the following anti-takeover provision: Classified board
(CBoard), Bylaw, poison pills and golden parachute. Bylaw is charter or amendments
designed to guard against a hostile takeover. The Bylaw restricts shareholders’ ability to
change the board of directors or reject an undesirable takeover bid. The relevant data have
been obtained from Institutional Shareholder Services.
III.2.3. Innovation measures
Innovation quantity: To construct the innovation variables, we use patent applications filed
with the USPTO 3. We measure innovation output by the total number of patent counts.
Following Bena and Li (2014), we compute the patent count as follows. First, we calculate
the total number of awarded patents to firm i in each technology class k and each
application year t and scaled it by the average number of awarded patents in corresponding
technology class k and application year t across all firms that were granted at least one
patent. Second, for each firm in each year we calculate total scaled number of awarded
patents across all technology class k in year t: it is the total number of awarded patents to
firm i in year t in technology class k scaled by the median4 number of granted applications
in this firm’s technology class k in year t.
3 The existing innovation literature discusses truncation problems associated with the NBER database. The truncation
problem occurs because many patent applications filed during 2005 and 2006 had not been granted by 2006. We used the patent database retrieved in May 2017, which provides us with about two-years safety lag. Therefore, our study is less subject to the truncation problem pointed out by Hall et al. (2001).
11
Innovation quantity. Following the innovation literature, we measure a firm’s innovation
in the year of application. Griliches et al. (1986) argue that the application year better
captures the actual time of innovation than the grant year. We set the number of patents to
zero for companies that have no patent information available from the patent database.5 To
measure the quality of innovation: we use two proxies: Citation and Patent Scope.
Innovation quality 1: Citation
The citation is calculated as the total quantity of forward citations received during
the latest five years since granting of a patent. According to the innovation
literature, the number of forward citations measures the technological importance
of the patent for the development of subsequent technologies and reflects the
economic value of inventions. In contrast, the backward citations are citations that
assess the degree of novelty of invention and investigate the knowledge transfers
in terms of citations networks.
Innovation quality 2: Scope
We measure technological and economic value of patent by patent scope. The
patent scope was first discussed by Lerner (1994) who argues that technological
scope of a firm portfolio significantly affects the valuation of the firm. Following
Lerner (1994), we construct patent scope as the number of unique four digits classes
of International Patent Classification (IPC) in a given patent documentation relative
12
to the maximum scope in the same IPC class and application year. The higher the
patent scope, the higher is the market value of a patent.
Innovation efficiency: We measure innovative efficiency in terms of patent efficiency
(IE_pat) and citation efficiency (IE_cite) by following Hirshleifer et al (2013). We also
measure scope efficiency (IE_scope) in a similar manner. For example, IE_pat is
constructed as patents count scaled by cumulative R&D over past five years with 20%
depreciation rate:
IEpat𝑖,𝑡 = 𝑃𝑎𝑡𝑒𝑛𝑡𝑠𝑖,𝑡
(𝑅&𝐷𝑖,𝑡−2+ 0.8 ∗ 𝑅&𝐷𝑖,𝑡−3+ 0.6 ∗ 𝑅&𝐷𝑖,𝑡−4+ 0.4 ∗ 𝑅&𝐷𝑖,𝑡−5+ 0.2 ∗ 𝑅&𝐷𝑖,𝑡−6)
The efficiency of innovation quality is the sum of citation received during last five years
scaled by cumulative R&D expenditure over past five years as follows:
IE_cite𝑖,𝑡 =
∑𝑡−5𝑡 𝐶𝑖𝑡𝑎𝑡𝑖𝑜𝑛𝑠
(𝑅&𝐷𝑖,𝑡−3+ 𝑅&𝐷𝑖,𝑡−4+ 𝑅&𝐷𝑖,𝑡−5+ 𝑅&𝐷𝑖,𝑡−6+ 𝑅&𝐷𝑖,𝑡−7)
The efficiency of patent scope is computed in the same way as IE_cite:
IE_scope𝑖,𝑡 = #𝑃𝑎𝑡𝑒𝑛𝑡 𝑆𝑐𝑜𝑝𝑒𝑖,𝑡
(𝑅&𝐷𝑖,𝑡−3+ 𝑅&𝐷𝑖,𝑡−4+ 𝑅&𝐷𝑖,𝑡−5+ 𝑅&𝐷𝑖,𝑡−6+ 𝑅&𝐷𝑖,𝑡−7)
IV. Results
In this section, we test the hypothesis that DLO-firms have greater internal capital and
investment distortions than non-target firms. HWZ (2017) conclude that the repatriation costs of
foreign cash cause a significant discount that investors place on a firm’s foreign cash holdings,
leading to disruptions in the internal capital market and resulting investment distortion (i.e.,
13
borrowing costs and agency problems, the higher are the investment distortions. We measure the
severity of the repatriation tax problems by the following measures: foreign pre-tax income as a
percentage of the total income,ratio of the number oftax-heaven subsidiaries to the total number
of foreign subsidiaries, 3-year average of free cash flows divided by 3-year average total assets
(Free CF/TA), dividend payout ratios (Div/E), and leverage (total debt divided by total assets).In
this section, we also compare the dual firms and non-dual funds in terms of a) corporate
governance issues, b) innovation efficiency, as well as c) performance during the pre-dual period.
IV.1. Testing Hypothesis 1: Identification of Targets (Pre-dual Period)
IV.1.1. Repatriation tax cost
Table 2, Panel A compares the DLO-group and the control group based on the extent of
their exposure to repatriation costs.
Table 2. Panel A: Exposure to repatriation costs
Pre-tax Income foreign (FPI) and total income (TI) comes from COMPUSTAT. # of foreign subsidiaries (TFS) and # tax haven subsidiaries (THS) comes from 10-k, where if no information is reported we set # of subsidiaries in tax haven countries to zero. Free cash flow, dividend, total debt and assets derived from COMPUSTAT. The ratio of dividends (Div) to the total assets (TA) denoted as Div/TA. The ratio of dividends (Div) to earnings (E) is denoted as a Div/E. This table contains of 3686 firm-year observations of the three years, pre-event window. The control firms are firms matched with treated firms in the same industry and year using propensity scores (nearest neighbor) on size, distinct number of foreign subsidiaries and distinct number of subsidiaries in the tax haven country. Industry classification based on the Fama and French (1997) 49 industries. All variables are defined at Appendix B. To dilute the influence of outliers, all continuous variables are winsorized at the 1st and 99th percentiles. Upper-asterisks such as *, **, and *** denote significance at the 10%, 5%, and 1% level, respectively.
DLOs Control Diff (DLOs-Control)
(1) (2) (3)
FPI/TI 0.240 0.128 0.112***
THS/TFS 0.163 0.108 0.055***
FCF/TA 0.015 -0.017 0.032***
Debt Ratio 0.319 0.242 0.077***
Div/E 0.211 0.179 0.032
14
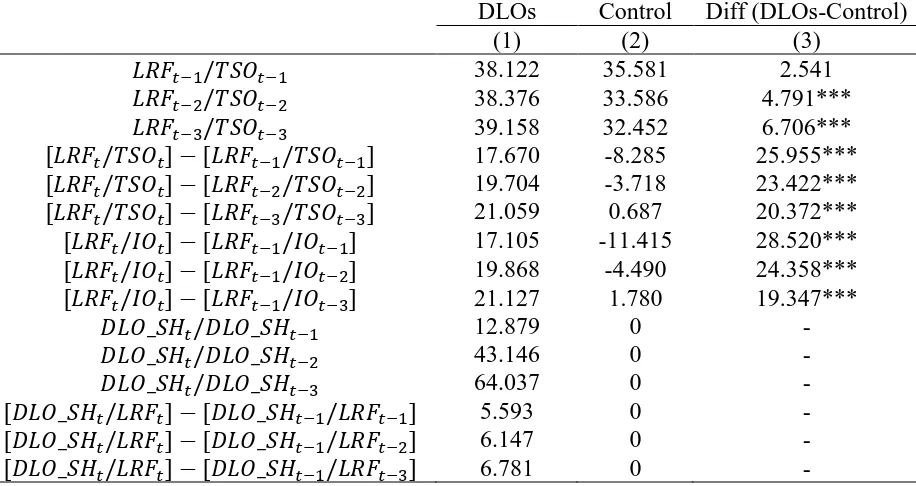
Table 2. Panel B: Shareholdings by Less Regulated Funds (LRFs) - DLOs vs. Control
This table summarize institutional ownership in pre-dual ownership period. The institutional ownership computed from 13-F filings. The shares held by less regulated funds (LRF) as the percent of total shares outstanding (TSO) is denoted as LRF/TSO. The sharers held by LRF as percent of shares held by all institutional owners denoted as LRF/TIO. The percentage of shares outstanding held by DLOs denoted as DLO_SH. The percentage of DLO_SH in LRF is denoted as DLO_SH /LRF. The DLO_SH at time t relative to the legged DLO_SH is measured as a ratio. This table contains of 3686 firm-year observations of the three years, pre-event window. The control firms are firms matched with treated firms in the same industry and year using propensity scores (nearest neighbor) on size, distinct number of foreign subsidiaries and distinct number of subsidiaries in the tax haven country. Industry classification based on the Fama and French (1997) 49 industries. All variables are defined at Appendix B. To dilute the influence of outliers, all continuous variables are winsorized at the 1st and 99th percentiles. Upper-asterisks such as *, **, and *** denote significance at the 10%, 5%, and 1% level, respectively.
DLOs Control Diff (DLOs-Control)
(1) (2) (3)
𝐿𝑅𝐹𝑡−1/𝑇𝑆𝑂𝑡−1 38.122 35.581 2.541
𝐿𝑅𝐹𝑡−2/𝑇𝑆𝑂𝑡−2 38.376 33.586 4.791***
𝐿𝑅𝐹𝑡−3/𝑇𝑆𝑂𝑡−3 39.158 32.452 6.706***
[𝐿𝑅𝐹𝑡/𝑇𝑆𝑂𝑡] − [𝐿𝑅𝐹𝑡−1/𝑇𝑆𝑂𝑡−1] 17.670 -8.285 25.955***
[𝐿𝑅𝐹𝑡/𝑇𝑆𝑂𝑡] − [𝐿𝑅𝐹𝑡−2/𝑇𝑆𝑂𝑡−2] 19.704 -3.718 23.422*** [𝐿𝑅𝐹𝑡/𝑇𝑆𝑂𝑡] − [𝐿𝑅𝐹𝑡−3/𝑇𝑆𝑂𝑡−3] 21.059 0.687 20.372*** [𝐿𝑅𝐹𝑡/𝐼𝑂𝑡] − [𝐿𝑅𝐹𝑡−1/𝐼𝑂𝑡−1] 17.105 -11.415 28.520*** [𝐿𝑅𝐹𝑡/𝐼𝑂𝑡] − [𝐿𝑅𝐹𝑡−1/𝐼𝑂𝑡−2] 19.868 -4.490 24.358***
[𝐿𝑅𝐹𝑡/𝐼𝑂𝑡] − [𝐿𝑅𝐹𝑡−1/𝐼𝑂𝑡−3] 21.127 1.780 19.347***
𝐷𝐿𝑂_𝑆𝐻𝑡/𝐷𝐿𝑂_𝑆𝐻𝑡−1 12.879 0 -
𝐷𝐿𝑂_𝑆𝐻𝑡/𝐷𝐿𝑂_𝑆𝐻𝑡−2 43.146 0 -
𝐷𝐿𝑂_𝑆𝐻𝑡/𝐷𝐿𝑂_𝑆𝐻𝑡−3 64.037 0 -
[𝐷𝐿𝑂_𝑆𝐻𝑡/𝐿𝑅𝐹𝑡] − [𝐷𝐿𝑂_𝑆𝐻𝑡−1/𝐿𝑅𝐹𝑡−1] 5.593 0 -
[𝐷𝐿𝑂_𝑆𝐻𝑡/𝐿𝑅𝐹𝑡] − [𝐷𝐿𝑂_𝑆𝐻𝑡−1/𝐿𝑅𝐹𝑡−2] 6.147 0 -
[𝐷𝐿𝑂_𝑆𝐻𝑡/𝐿𝑅𝐹𝑡] − [𝐷𝐿𝑂_𝑆𝐻𝑡−1/𝐿𝑅𝐹𝑡−3] 6.781 0 -
It shows that DLO firms have a significantly larger proportion of foreign pre-tax income
in total income and significantly higher ratio of subsidiaries in the tax haven countries relative to
all foreign subsidiaries than control firms, with both variables being significant at the 1% level.
This confirms our expectation that the target firms might face more inflexibility of internal capital
markets due to the immobility or trap of foreign income overseas. Panel A also shows that targets
15
due to a higher portion of cash flows being trapped abroad. These findings suggest that DLOs
choose their targets based on the severity of their exposure to repatriation taxes.
Panel B of Table 2 shows that hedge funds begin to increase their shareholdings starting at
least three years before they take dual ownerships in the targets, while decreasing their holdings
in the control firms. This evidence might imply that dual ownerships involve a long-term planning.
IV.1.2. Managerial control
The management has the incentive to maintain control of the firm it manages. Three major
ways the management would like to retain its control are via a) performing insider trading, b)
maintaining anti-takeover provisions (ATPs), and c) combatting proxy fights. In this subsection,
we compare Dual firms with control firms in terms of managerial efforts to entrench themselves.
Table 3. Panel A: Insider Trading and Covenants Violation – Pre-Dual Period
This table contains of 1770 (3686) firm-years observations of insider trading (covenant violations) during the three years, pre-event window. All variables are defined at Appendix B. The insider trading data comes from Bloomberg and is from 2010. Insider Ownership (IS) measured as stock held by insiders relative to total shares outstanding, in per cent ages. Insiders stock purchases (sales) denoted as ISP (ISS) measured as the amount of stock purchased (sold) by insiders scaled by total assets at time t. CV is an indicator variable, which takes value of 1 if information about a firm covenant violation is available in the dataset of Roberts and Sufi, (2009). The dataset contains all covenants violation filed with SEC during 1996 to 2012. The control firms are firms matched with treated firms in the same industry and year using propensity scores (nearest neighbor) on size, distinct number of foreign subsidiaries and distinct number of subsidiaries in the tax haven country. Industry classification based on the Fama and French (1997) 49 industries. To dilute the influence of outliers, all continuous variables are winsorized at the 1st and 99th percentiles. Upper-asterisks such as *, **, and *** denote significance at the 10%, 5%, and 1% level, respectively.
DLOs Control Diff (DLOs-Control)
(1) (2) (3)
IS 2.69 10.15 -7.46***
ISP 7.15 10.11 -2.96
ISS 0.01 0.02 -0.01**
CV 0.01 0.02 -0.01***
Table 3, Panel A compares 3-year average of insider trading and covenants violations
16
that insider ownership as well as insider activities are actually lower for the target group than the
control group. This phenomenon might be explained in the following manner: as the DLOs acquire
more shares of the target group (than the control group) preceding the acquisition of dual
ownerships (Table 2, Panel B), their activism (i.e., reducing the insider trading) might have begun
years before they take on dual ownership.
Table 3. Panel B: Proxy Fight --Pre-event period.
This table compares the means of proxy fights between the DLO group and the control group during the pre-event window. Appendix B describes all variables. The victory of a dissident in proxy contest (Vict) is measured as sum of its full victory (Vict Full), partial victory (Vict Part) and settlement (Settle). The control firms are firms matched with treated firms in the same industry and year using propensity scores (nearest neighbor) on size, distinct number of foreign subsidiaries and distinct number of subsidiaries in the tax haven country. We use proportion two-tailed z-test to examine the significance of difference in proportion between groups. Upper-asterisks *, **, and *** denote significance at the 10%, 5%, and 1% level, respectively.
DLOs Control
Diff (DLOs-Control)
(1) (2) (3)
Vict 0.025 0.031 -0.005
Vict Part 0.020 0.023 -0.003
Vict Full 0.020 0.023 -0.003
Settle 0.024 0.028 -0.004
Table 3, Panel B compares the success rates in proxy contests between DLO firms and the
control group. The success occurs when the three-year average number of victories in proxy fight
after dual ownership exceeds the average number of victories in the three years prior to dual
ownership. Panel A shows that DLO firms do not experience greater success than the control firms.
Perhaps the same explanation as offered in the context of insider trading applies here.
Panel C of Table 3 indicates that DLO firms have more stringent anti-takeover provisions
than the control firms during the pre-dual period. The former group exhibits higher classified board
(0.208), Bylaw amendments (0.384), poison pills (0.108) and golden parachutes (0.287) compared
to 0.137, 0.214, 0.075, and 0.170 respectively for the control group. The presence of a higher
17
sum up the findings of Table 3, managers of DLO firms are more entrenched than their non-DLO
counterparts.
Table 3. Panel C: Antitakeover provision (Pre-Event Period). This table compares the means of antitakeover provisions between the DLO group and the control group during the of pre-event window. Antitakeover provisions are Staggered Board (CBoard), bylaw provision (Bylaw), Poison Pills and Golden Parachute. Appendix B describes all variables. The control firms are firms matched with treated firms in the same industry and year using propensity scores (nearest neighbor) on size, distinct number of foreign subsidiaries and distinct number of subsidiaries in tax haven countries. We use proportion two-tailed z-test to examine the significance of difference in proportion between groups. Upper-asterisks *, **, and *** denote significance at the 10%, 5%, and 1% level, respectively.
DLOs Control Diff (DLOs-Control)
(1) (2) (3)
CBoard 0.208 0.137 0.070***
Bylaw 0.384 0.214 0.171***
Poison Pills 0.108 0.075 0.034***
Golden Parachute 0.287 0.170 0.117***
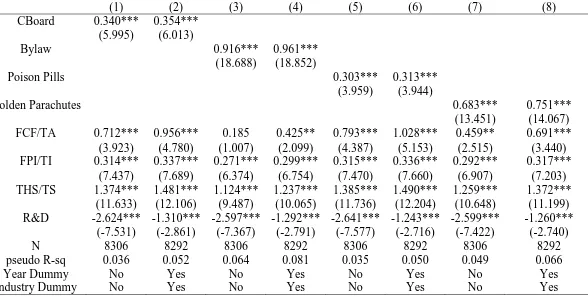
Table 4 employs a logit model to identify the features that differentiate the DLO group
from the control group. The dependent variable is a dummy that takes on a value of 1 for a target
firm, and 0 for a control firm. Overall, Table 4 shows that DLOs are more likely to target MNCs
that have higher anti-takeover provision, higher free cashflow, with higher proportion of foreign
pre-tax income, and higher proportion of subsidiaries in the tax haven countries. In other words,
18 Table 4. Which MNCs are more likely to have DLOs?
This table reports coefficient estimates from logit models. The dependent variable is equal to one for the MNCs with DLOs, and zero for the MNCs without DLOs. Both DLOs and control are MNCs. The control firms are firms matched with treated firms in the same industry and year using propensity scores (nearest neighbor) on size, distinct number of foreign subsidiaries and distinct number of subsidiaries in the tax haven country. Industry classification based on the Fama and French (1997) 49 industries. Specifications include either no fixed effects (columns: 1,3,5 and 7) or industry and year fixed effects (columns: 2,4,6 and 8). All variables are defined in Appendix B. Antitakeover defenses are measured by staggered board (CBoard), Bylaw profession, poison pills and golden parachutes. FPI/TI is a ratio of foreign pre-tax income (FPI) to the total income (TI). The variable THS/TS is the ratio of number of foreign subsidiaries in the tax haven countries (THS) to the total number of subsidiaries (TS). All continuous variables are winsorized at 1% level. Z-statistics are reported in parenthesis. Upper-asterisks *, **, and *** denote significance at the 10%, 5%, and 1% level, respectively.
(1) (2) (3) (4) (5) (6) (7) (8)
CBoard 0.340*** 0.354***
(5.995) (6.013)
Bylaw 0.916*** 0.961***
(18.688) (18.852)
Poison Pills 0.303*** 0.313***
(3.959) (3.944)
Golden Parachutes 0.683*** 0.751***
(13.451) (14.067)
FCF/TA 0.712*** 0.956*** 0.185 0.425** 0.793*** 1.028*** 0.459** 0.691***
(3.923) (4.780) (1.007) (2.099) (4.387) (5.153) (2.515) (3.440)
FPI/TI 0.314*** 0.337*** 0.271*** 0.299*** 0.315*** 0.336*** 0.292*** 0.317***
(7.437) (7.689) (6.374) (6.754) (7.470) (7.660) (6.907) (7.203)
THS/TS 1.374*** 1.481*** 1.124*** 1.237*** 1.385*** 1.490*** 1.259*** 1.372***
(11.633) (12.106) (9.487) (10.065) (11.736) (12.204) (10.648) (11.199)
R&D -2.624*** -1.310*** -2.597*** -1.292*** -2.641*** -1.243*** -2.599*** -1.260***
(-7.531) (-2.861) (-7.367) (-2.791) (-7.577) (-2.716) (-7.422) (-2.740)
N 8306 8292 8306 8292 8306 8292 8306 8292
pseudo R-sq 0.036 0.052 0.064 0.081 0.035 0.050 0.049 0.066
Year Dummy No Yes No Yes No Yes No Yes
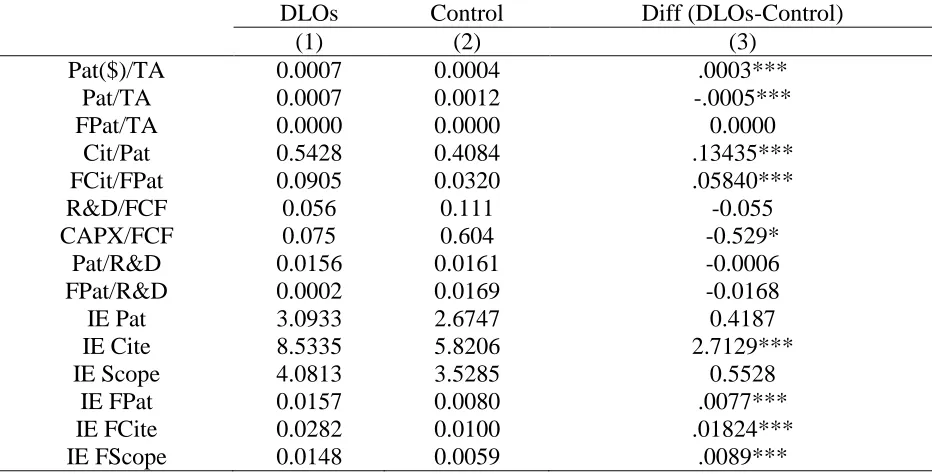
19 IV.1. 3. Innovation
Table 5 provides evidence that indicates that the targets were more efficient in terms of
innovations even before hedge funds took dual positions in these firms.
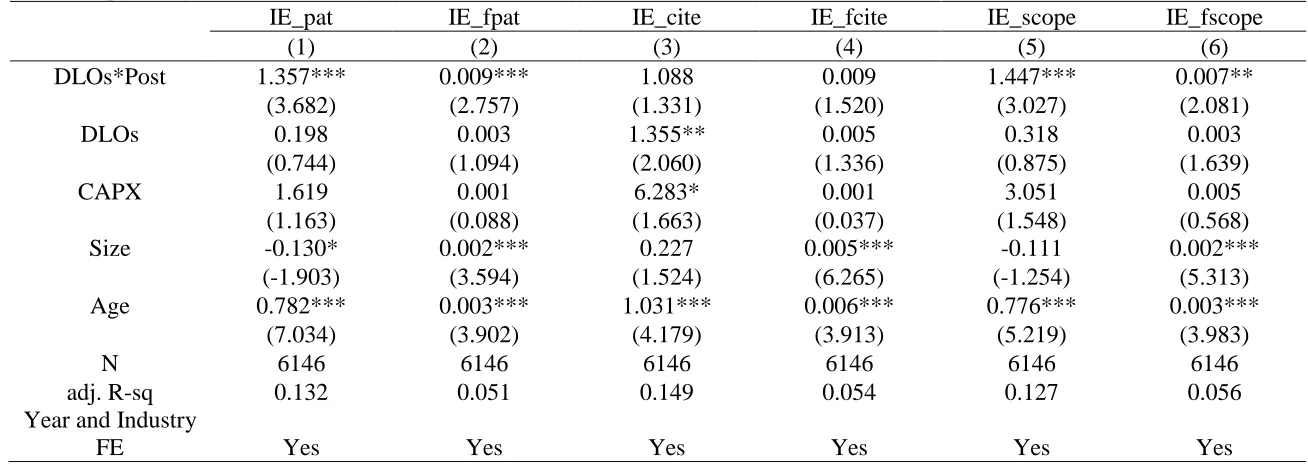
Table 5. Innovation Efficiency in the Pre-Dual Period
This table reports analysis of difference in means (t-test) of innovation performance and capital expenditures of DLO firms and control firms over the three-year pre-event window. (Definitions of all variables are provided in Appendix B.) Patent counts (Pat) and Patent’s forward citations are retrieved from the USPTO. Dollar measure of patents (Pat($)) obtained from Kogan et al. (2017). The number of patents and number of citations normalized by median # of patents (citations) in the corresponding technological class. R&D, CAPEX and assets derived from COMPUSTAT. The measures of innovation efficiency constructed following Hirshleifer et al (2013) and are log transformation one plus innovative efficiency aggregated at the US MNCs (aggregated foreign level) such as: patent counts denoted as IE Pat (IE FPat); efficiency of the recent five years forward citations denoted as IE Cite (IE FCite); and efficiency of patent scope denoted as IE scope (IE FScope). The control firms are firms matched with treated firms in the same industry and year using propensity scores (nearest neighbor) on size, distinct number of foreign subsidiaries and distinct number of subsidiaries in the tax haven country. Industry classification based on the Fama and French (1997) 49 industries. To dilute the influence of outliers, all variables are winsorized at the 1st and 99th percentiles. All variables are defined at Appendix B. To dilute the influence of outliers, all continuous variables are winsorized at the 1st and 99th percentiles. Upper-asterisks *, **, and *** denote significance at the 10%, 5%, and 1% level, respectively.
DLOs Control Diff (DLOs-Control)
(1) (2) (3)
Pat($)/TA 0.0007 0.0004 .0003***
Pat/TA 0.0007 0.0012 -.0005***
FPat/TA 0.0000 0.0000 0.0000
Cit/Pat 0.5428 0.4084 .13435***
FCit/FPat 0.0905 0.0320 .05840***
R&D/FCF 0.056 0.111 -0.055
CAPX/FCF 0.075 0.604 -0.529*
Pat/R&D 0.0156 0.0161 -0.0006
FPat/R&D 0.0002 0.0169 -0.0168
IE Pat 3.0933 2.6747 0.4187
IE Cite 8.5335 5.8206 2.7129***
IE Scope 4.0813 3.5285 0.5528
IE FPat 0.0157 0.0080 .0077***
IE FCite 0.0282 0.0100 .01824***
IE FScope 0.0148 0.0059 .0089***
A possible explanation might lie in DLOs being attracted by superior performance of the
20
firms. Table 2 shows that while hedge funds increase their equity ownership in DLO firms in the
pre-dual period, they decrease their equity holding in the control group actually diminishes during
the same period. On a net basis, DLOs’ equity ownership as a percentage of total number of shares
significantly increases (at the 1% significance level) from t-1, t-2, and t-3 to t by 25.95%, 23.42%,
and 20.37% respectively. Also, during the same period, the DLO equity ownership as a proportion
to total institutional ownerships increases by 28.52%, 24.36%, 19.34% respectively.
IV.1. 4. Performance
Table 6 compares the accounting (ROA, ROE, and EBITDA/SALES) as well as market
performance (P/B) between the target group and the control group during the pre-dual period. The
table shows that accounting performance of the target group is superior to that of the control group.
The results imply that in spite of a greater exposure to repatriation tax costs, target firms exhibit a
better performance record in the pre-dual period.
Table 6. Performance in the Pre-Dual Period: DLOs vs. Control
This table compares the operating performances of DLO firms and their peers over the three-year pre-event window. All variables are defined at Appendix B. The control firms are firms matched with treated firms in the same industry and year using propensity scores (nearest neighbor) on size, distinct number of foreign subsidiaries and distinct number of subsidiaries in the tax haven country. Industry classification based on the Fama and French (1997) 49 industries. To dilute the influence of outliers, all continuous variables are winsorized at the 1st and 99th percentiles. Upper-asterisks *, **, and *** denote significance at the 10%, 5%, and 1% level, respectively.
DLOs Control Diff (DLOs-Control)
(1) (2) (3)
ROA 0.013 -0.020 0.032***
ROE 0.070 0.012 0.058**
M/B 2.268 2.118 0.150
EBITDA/SALES 0.107 -0.070 0.176***
The market performance (M/B) of dual target firms, however, is not significantly different
from that of the control firms. It is possible that the market’s positive reaction to the superior
21
“.... investors will underreact to the information content in innovative efficiency because
of the difficulty evaluating the economic implications of patents and patent citations. If so,
then firms that are more efficient in innovations will be undervalued relative to firms that
are less efficient in innovations.” (page 2)
IV.1.5. Summarizing test results: Hypothesis 1
Before taking dual position, hedge funds seem to solidify their equity holdings in
the MNCs they target;
In terms of innovation activities and overall performance, dual firms are at least as
efficient as non-dual firms: increasing equity ownership by hedge funds in dual
firms might explain this phenomenon;
The main factors that differentiate dual firms from non-duals in the pre-dual period
are that the former group 1) has greater exposure to repatriation tax costs, and 2)
exhibit greater managerial entrenchment problems than the latter group.
IV.2. Testing Hypothesis 2: Strategies to Reduce Managerial Control
IV. 2.1. Reducing inside trading
Table 7, Panel A compares changes in insider trading and covenants violations
between the target and control from the pre-dual period to the post-dual period. The average insider
ownership decreased for both groups following the dual ownership year, but the decrease is
significantly higher for the control firms (by 0.036 points). The average insider purchases and sales
for the DLO firms, however, decrease more than those of the control group (i.e., the former group
experiences a higher decrease in insider purchases (-6.557) and insider sales (-0.023) than the
latter. In terms of covenant violations too, the former group faces a greater decrease in covenant
22
Table 7. Panel A: Insider Trading and Covenants Violation --Pre-Post Periods
This Table compares changes in insider trading activities between the DLO group and the control group from before to after the dual ownerships. The source of the insider trading data is Bloomberg, available starting 2010. The sample includes firms with DLOs firms and their control firms. The control firms are firms matched with treated firms in the same industry and year using propensity scores (nearest neighbor) on size, distinct number of foreign subsidiaries and distinct number of subsidiaries in the tax haven country. ∆ denotes average three-year change between post- and pre-periods in insider purchase (∆InsPurch), insider sales (∆InsSale) and insider share outstanding (∆InsShare). The control firms are firms matched with DLOs firms in the same industry and year using propensity scores (nearest neighbor) without replacement on total assets, number of foreign subsidiaries and number of subsidiaries in the tax haven countries. To dilute the influence of outliers, all variables are winsorized at the 1st and 99th percentiles. All variables are defined at Appendix B. Upper-asterisks such as *, **, and *** denote significance at the 10%, 5%, and 1% level, respectively.
DLOs Control Diff (DLOs-Control)
∆IS -0.040 -0.076 .036***
∆ISP -6.557 -4.157 -2.340***
∆ISS -0.023 -0.013 -.009***
∆CV -0.005 -0.001 -.004**
Overall findings support our prediction that insider trading activities as well as covenant
violations would decrease more for the DLO firms than for control firms.
IV. 2.2. Success rate of proxy fights
Table 7, Panel B compares the success history of proxy contests between the target group
and the control group both in pre-dual and post-dual periods. Table 3, Panel B shows that there is
no significant difference between the two groups in terms of the final outcome of proxy fights (i.e.,
partial victory, full victory, and settlements successes) in the pre-dual period. Panel B of Table 7,
however, shows that proportion of activists’ victories in target firms are higher (0.68) than the
control firms (0.32). Moreover, DLO firms achieve greater proportion of full, partial, settlement
in target firms (0.69, 0.69 and 0.51) than control firms. The test of independence of the contests
success is significant at the 1% significance level for total successes, full successes and partial
23
Thus, successes in proxy contests is contingent on hedge funds taking on dual positions.
The independence test does not find significant difference in settlement successes between the two
groups. Overall, Panel B suggests that affiliation with DLOs has brought greater proxy-contest
success for the stockholders of DLO firms.
Table 7. Panel B: Independence Test of Proxy Contests from DLOs.
This Table compares changes in proxy contests between the DLO group and the control group from before to after the dual ownerships. This table reports proportion of positive changes of a dissident victory in proxy contests (column 1 and 2). The change is computed as average difference between proxy contests frequencies during three succeeding and preceding years on average at year t. The column (3) report total frequencies of the positive change. The victory of proxy contest (Vict) is measured as sum of full victory (Vict Full), partial victory (Vict Part) and settlement (Settle). Column (4) reports p-value from Chi square test of independence of the positive change in proxy fights on DLOs. The control firms are firms matched with treated firms in the same industry and year using propensity scores (nearest neighbor) on size, distinct number of foreign subsidiaries and distinct number of subsidiaries in the tax haven country.
DLOs Control
Total Positive
(∆) P-value
Positive Change (∆) (1) (2) (3) (4)
∆Vict 0.68 0.32 446 0.00
∆Vict Part 0.69 0.31 377 0.00
∆Vict Full 0.69 0.31 399 0.00
∆Settle 0.51 0.49 277 0.76
IV. 2.3. Fighting anti-takeover provisions
Table 7, Panel C reports changes in proportion of ATPs from year average before to
3-year average after the dual ownership. We define success as when the change is negative (i.e.,
ATPs decline). Panel B demonstrates that DLO firms have greater success in removing ATPs than
their non-dual counterparts, especially in removing Classified Board (0.68), in amending bylaw
provision (0.70), removing poison pills (0.69) and removing golden parachutes (0.71). The
independence test is significant at the 1% significance level across all measures of ATPs and
24
Table 7. Panel C: Independence Test of Change in ATPs from DLOs.
The table compares change in ATPs (Cboard, ByLaw, Ppills and Gpapprachute) between the DLO group and the control group from before to after the dual ownerships. The change is computed as average difference between ATP frequencies during three succeeding and preceding years on average at year t. Colum (1) and column (2) report proportion of decrease in ATPs, while column (3) total number of cases where negative changes have occurred. Column (4) reports p-value from Chi square test of independence change in ATP on DLOs. The control firms are firms matched with treated firms in the same industry and year using propensity scores (nearest neighbor) on size, distinct number of foreign subsidiaries and distinct number of subsidiaries in the tax haven country.
(1) (2) (3) (4)
Negative Change (∆) DLOs Control Total Negative (∆) P-value
∆Cboard 0.68 0.32 948 0.00
∆Bylaw 0.70 0.30 1,400 0.00
∆Ppills 0.69 0.31 663 0.00
∆Gparachute 0.71 0.29 1,161 0.00
IV. 2.4. Summarizing test results: Hypothesis 2
In the post-dual period, DLO firms have greater success than non-DLO firms in a) reducing
insider trading activities as well as covenant violations; b) increasing the success rate of proxy
contests; c) removing ATPs.
IV.3. Hypothesis 3: Reducing Internal Capital Problems & Improving Investment Efficiencies
HWZ (2017) report that, stemming from high foreign cash balances, MNCs face internal
capital problems that translate into investment distortions---domestic underinvestment and foreign
overinvestment. Our premise is that less regulated funds would first target those MNCs that are
likely to face greater repatriation costs, then engage in efforts to usurp control from the
management of these firms, and finally, act on reducing internal capital problems and improving
investment efficiencies. In the next few subsections, we assess the extent of success of the DLOs
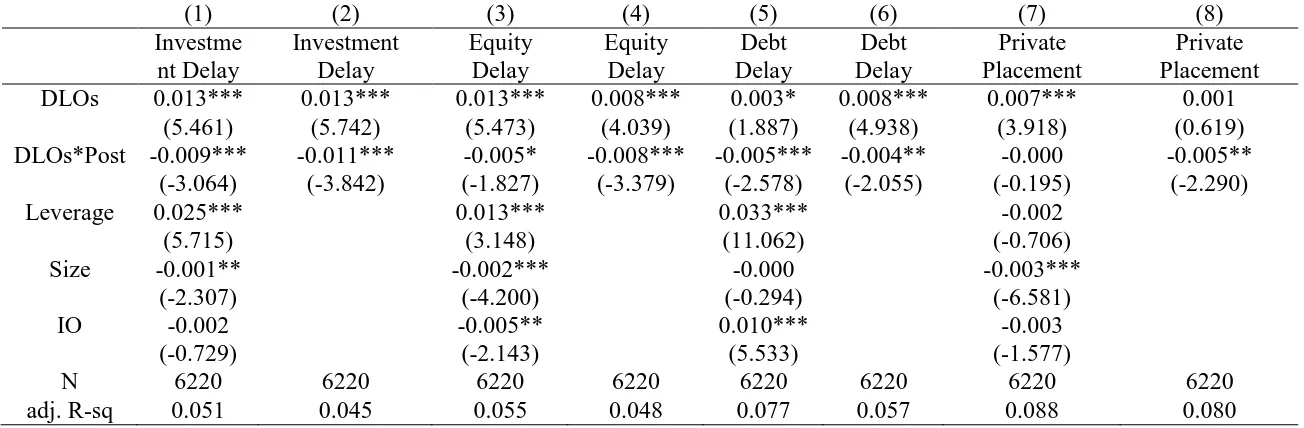
25 Table 8. Analysis of Investment Constraints
This panel shows changes in financial delays around new debt issuance. The dependent variables are text based measures of financial constraints developed by Hoberg and Maksimovic, (2014). The higher value of a dependent variable shows that a firm is more similar to a set of firms known to be at risk of liquidity issues (Investment Delay) and presumes solving this delay by: equity issuance (Equity Delay), issuing debt (Debt Delay) and issuing private placement (Private Placement). We control for Leverage (Total Debt/Total Assets), Size (log transformation of one plus Total Assets) and total share outstanding held by institutional investors (IO). The control firms are firms matched with treated firms in the same industry and year using propensity scores (nearest neighbor) on size, distinct number of foreign subsidiaries and distinct number of subsidiaries in the tax haven country. Industry classification based on the Fama and French (1997) 49 industries. DLOs is a dummy variable, which takes value of one if a firm belongs to DLOs group and zero otherwise. Post is a dummy variable, which indicates the three-year window [+1, +3] after DLOs activism. Post is excluded from the model because it was subsumed by year fixed effects. To dilute the influence of outliers, all variables are winsorized at the 1st and 99th percentiles. All variables are defined at Appendix B. T-statistics are reported in parenthesis (calculated based on robust standard errors). Upper-asterisks *, **, and *** denote significance at the 10%, 5%, and 1% level, respectively.
(1) (2) (3) (4) (5) (6) (7) (8)
Investme nt Delay
Investment Delay
Equity Delay
Equity Delay
Debt Delay
Debt Delay
Private Placement
Private Placement
DLOs 0.013*** 0.013*** 0.013*** 0.008*** 0.003* 0.008*** 0.007*** 0.001
(5.461) (5.742) (5.473) (4.039) (1.887) (4.938) (3.918) (0.619)
DLOs*Post -0.009*** -0.011*** -0.005* -0.008*** -0.005*** -0.004** -0.000 -0.005**
(-3.064) (-3.842) (-1.827) (-3.379) (-2.578) (-2.055) (-0.195) (-2.290)
Leverage 0.025*** 0.013*** 0.033*** -0.002
(5.715) (3.148) (11.062) (-0.706)
Size -0.001** -0.002*** -0.000 -0.003***
(-2.307) (-4.200) (-0.294) (-6.581)
IO -0.002 -0.005** 0.010*** -0.003
(-0.729) (-2.143) (5.533) (-1.577)
N 6220 6220 6220 6220 6220 6220 6220 6220
26 IV.3.1. Reducing internal capital problems
An indirect result of distortions in the internal capital market is illiquidity stemming from
increasing costs of external financing.6 Illiquidity causes the firm to postpone investments
(Investment Delay), delay equity (Equity Delay) and/or debt issues (Debt Delay) and constrain it
to resort to private placement (Private Placement) (Hoberg and Maksimovic, 2014). If DLOs are
successful in mitigating the illiquidity problem, we should find DLO firms to lessen delays in
investments, equity issuance, and/or debt issuance.
The results presented in Table 8 show that DLO firms more effectively mitigate illiquidity
problem than their non-DLO counterparts. It shows a significant decrease (at 1% significance
level) in investments delays in the post dual period relative to non-DLO firms. Similarly, DLO
firms reduce delay in issuing new equity or debt and the reliance on private placement: the results
hold after controlling for a firm’s leverage, size and shares held by institutional investors across
all measures of financial constraints except the private placement.
IV.3. 2. Increasing investment efficiency---domestic and foreign
In this subsection, we answer the following question: Were DLOs able to reduce
investment distortions (domestic underinvestment and foreign overinvestment) in the post-dual
period? In so doing, we modify the HWZ (2017) model to compare DLO firms with control firms
in terms of their domestic, foreign, and R&D investments. To check for robustness, we also use
the HWZ (2017) model to estimate potential domestic underinvestment using domestic and foreign
6 Froot, Scharfstein, Stein (1993) concluded that cost and difficulties of raising external finance my force firms to
27
sales, profit margin and assets in one of the models. The results are presented in Table 9 (Panel A
and Panel B).
Table 9. Underinvestment After Dual Ownership
Panel A of this table presents modeling of domestic underinvestment following Harford, Wang and Zhang (2017). We modeled underinvestment by retaining residuals from regressing domestic investments of US MNCs’ (domestic capital expenses scaled by domestic assets) on US MNC segments’ characteristics such as: domestic sales growth over current period (Domestic Sale Growth), foreign sales growth over current period (Foreign Sale Growth), net domestic income over domestic sales (Domestic Profit Margin), net foreign income over foreign sales (Foreign Profit Margin) and log of one plus domestic as well foreign book assets. Next, we construct Domestic underinvestment as absolute value of negative residuals and zeros otherwise. Panel B. Probit and Difference-in-Difference analysis using regression model of domestic underinvestment. Columns (1) - (4) of this table reports results of probit analysis. While, column (5) reports results from Difference-in-difference analysis. DLOs is a dummy variable, which takes value of one if a firm belongs to a foreign subsidiary of the DLOs group and zero otherwise. Post is a dummy variable, which indicates the three-year window [+1, +3] after DLOs activism. DLOs*Post is an interaction term between DLOs and Post-dual period. All models include industry and year fixed effects. To dilute the influence of outliers, all continuous variables are winsorized at the 1st and 99th percentiles. T-statistics are reported in parenthesis (calculated based on standard clustered on firm level). Upper-asterisks *, **, and *** denote significance at the 10%, 5%, and 1% level, respectively.
Panel A. Domestic capital expenditures/ Domestic Assets
Domestic Sale Growth 0.014**
(2.242)
Foreign Sale Growth 0.017
(0.388)
Domestic Profit Margin 0.183***
(4.033)
Foreign Profit Margin 0.094
(0.993)
Domestic assets 0.001
(0.498)
Foreign Assets 0.000
(0.282)
N 1706
adj. R-sq 0.417
Panel A, Table 9 reports modeling of domestic underinvestment following HWZ (2017)
while Panel B reports probit analysis (Columns 1- 4) while panel B reports difference-in-difference
analysis of domestic underinvestment. The domestic investment is defined as domestic capital
28
Post (Columns 1 - 4) suggest decrease in domestic underinvestment for DLO firms and interaction
term between DLOs and Post (Column 5) suggest that in the post-dual period, dual firms reduce
total domestic underinvestment (at the 5% significant level) relative to their peers. Overall, results
of these section suggest that dual ownership has been more effective in decreasing domestic
underinvestment.
Table 9. Panel B: Probit and Difference-in-Difference analysis of domestic underinvestment
Probit and Difference-in-Difference analysis using regression model of domestic underinvestment. Columns (1) - (4) of this table reports results of probit analysis. While, column (5) reports results from Difference-in-difference analysis. DLOs is a dummy variable, which takes value of one if a firm belongs to a foreign subsidiary of the DLOs group and zero otherwise. Post is a dummy variable, which indicates the three-year window [+1, +3] after DLOs activism. DLOs*Post is an interaction term between DLOs and Post-dual period. All models include industry and year fixed effects. To dilute the influence of outliers, all continuous variables are winsorized at the 1st and 99th percentiles. T-statistics are reported in parenthesis (calculated based on standard clustered on firm level). Upper-asterisks *, **, and *** denote significance at the 10%, 5%, and 1% level, respectively. All specifications include industry and year fixed effects.
DLOs Controls DLOs Controls
Difference-in-Difference
(1) (3) (2) (4) (5)
Domestic Underinvest
ment (=1 if residual < 0)
Domestic Underinvestme
nt (=1 if bottom
quartile)
Domestic Underinvestm
ent (=1 if residual
< 0)
Domestic Underinvestme
nt (=1 if bottom
quartile)
Domestic Underinvestme
nt (absolute value
of residual <0)
Post -0.652** -0.158 -0.506** -0.282
(-2.254) (-1.101) (-2.458) (-1.644)
DLOs*Post -0.008**
(-2.169)
DLOs 0.005
(1.366)
Leverage 0.920* -0.646** 0.128 -0.782** -0.003
(1.787) (-2.270) (0.363) (-2.280) (-0.469)
Size 0.247*** 0.024 0.114* 0.020 -0.002**
(2.659) (0.613) (1.817) (0.458) (-2.060)
IO -0.498 -0.391** -0.333 -0.183 -0.002
(-1.554) (-2.237) (-1.542) (-0.916) (-0.422)
N 497 530 363 418 1206
pseudo R-sq 0.099 0.069 0.076 0.133
29
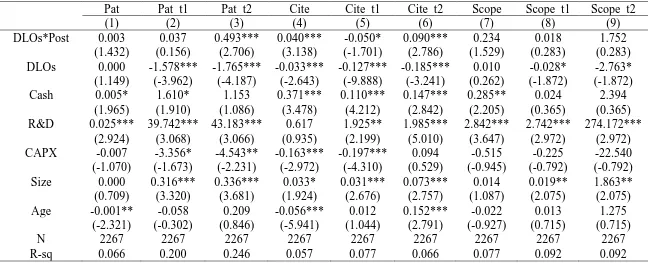
Table 10. Panel A: Difference-in-difference Analysis of Innovative Measures
This table consists of two panels: a) aggregate innovation measures at the US MNCs level and b) aggregated foreign innovation measures at the US MNCs level. The sample includes firms with DLOs and their control firms. The dependent variables measured at time t, t1 and t2 and are log transformation one plus patent counts (Pat), sum of five years forward citations (Cite) and patent scope (Scope). The innovation measures are scaled by the median value of the corresponding technological class. The control firms are firms matched with treated firms in the same industry and year using propensity scores (nearest neighbor) on size, distinct number of foreign subsidiaries and distinct number of subsidiaries in the tax haven country. Industry classification based on the Fama and French (1997) 49 industries. DLOs is a dummy variable, which takes value of one if a firm belongs to DLOs group and zero otherwise. Post is a dummy variable, which indicates the three-year window [+1, +3] after DLOs activism. DLOs*Post is an interaction term between DLOs and Post-dual period. Post is excluded from the model because it was subsumed by year fixed effects. To dilute the influence of outliers, all variables are winsorized at the 1st and 99th percentiles. All variables are defined at Appendix B. T-statistics are reported in parenthesis (calculated based on robust standard errors). Upper-asterisks *, **, and *** denote significance at the 10%, 5%, and 1% level, respectively.
Pat Pat_t1 Pat_t2 Cite Cite_t1 Cite_t2 Scope Scope_t1 Scope_t2
(1) (2) (3) (4) (5) (6) (7) (8) (9)
DLOs*Post 0.186*** 0.292*** 0.311*** 0.221*** 0.193*** 0.200*** 0.195*** 0.172*** 0.166***
(5.008) (4.809) (5.147) (4.954) (4.128) (4.008) (5.175) (4.297) (3.797)
DLOs -0.021 -0.043 -0.044 -0.033 -0.024 -0.018 -0.030 -0.017 -0.003
(-0.993) (-1.107) (-1.132) (-1.283) (-0.855) (-0.563) (-1.364) (-0.707) (-0.099)
R&D 1.461*** 3.780*** 3.785*** 1.842*** 2.239*** 2.583*** 1.507*** 1.841*** 2.088***
(9.465) (12.549) (12.603) (8.556) (9.687) (10.237) (9.366) (10.314) (10.277)
CAPX 0.003 0.019 -0.001 0.092 -0.080 -0.132 -0.002 -0.173 -0.176
(0.024) (0.091) (-0.004) (0.651) (-0.495) (-0.759) (-0.015) (-1.246) (-1.130)
Size 0.134*** 0.261*** 0.279*** 0.159*** 0.184*** 0.211*** 0.136*** 0.160*** 0.186***
(20.443) (22.966) (24.291) (20.125) (21.266) (22.781) (20.392) (21.333) (22.578)
Age 0.127*** 0.249*** 0.277*** 0.136*** 0.170*** 0.208*** 0.128*** 0.155*** 0.192***
(13.126) (14.465) (15.774) (11.906) (13.465) (14.915) (12.935) (14.057) (15.460)
N 6146 6146 6146 6146 6146 6146 6146 6146 6146
adj. R-sq 0.342 0.428 0.454 0.325 0.366 0.401 0.339 0.382 0.412
Year and