Geschke Center
Doctor of Nursing Practice (DNP) Projects Theses, Dissertations, Capstones and Projects
Summer 8-21-2015
A Quality Improvement Project to Increase
Diabetes Self-Efficacy in a Rural Primary Care
Clinic Through Patient Utilization of a Diabetic
Logbook
Margo D. Sutton
University of San Francisco, [email protected]
Follow this and additional works at:https://repository.usfca.edu/dnp Part of theFamily Practice Nursing Commons
This Project is brought to you for free and open access by the Theses, Dissertations, Capstones and Projects at USF Scholarship: a digital repository @ Gleeson Library | Geschke Center. It has been accepted for inclusion in Doctor of Nursing Practice (DNP) Projects by an authorized administrator of USF Scholarship: a digital repository @ Gleeson Library | Geschke Center. For more information, please [email protected].
Recommended Citation
Sutton, Margo D., "A Quality Improvement Project to Increase Diabetes Self-Efficacy in a Rural Primary Care Clinic Through Patient Utilization of a Diabetic Logbook" (2015).Doctor of Nursing Practice (DNP) Projects. 56.
A Quality Improvement Project to Increase Diabetes Self-Efficacy
in a Rural Primary Care Clinic Through Patient Utilization of a
Diabetic Logbook
Margo Sutton RN, MS, CNS, DNP
Doctorate in Nursing Practice Student
University of San Francisco
School of Nursing and Health Professions
Summer 2015
Stefan Rowniak PhD, RN, MS, FNP
Committee Chairperson
Alexa Curtis PhD, FNP-BC
Committee Member
Jo Loomis DNP, RN, FNP-C, CNL, NCMP
Section I: Abstract
The prevalence of type 2 diabetes mellitus (T2DM) has increased substantially in the
United States in recent years. Teaching self-management to diabetic patients is essential to help
them control their chronic disease. Albert Bandura’s theory of self-efficacy is commonly used in
chronic disease self-management programs and is the theoretical framework upon which this
Doctor of Nursing Practice (DNP) pilot project was built.
This evidence-based change in practice project took place in a rural primary care clinic in
the central valley of California, and involved the development of a diabetes logbook, which was
a tool for patients to use to learn self-management of their disease. The logbook was created in
response to an identified gap in knowledge among patients at the clinic. The book was
composed based on current evidence in diabetes management and treatment. It was introduced
to the patients and a validated tool (Diabetes Self-Efficacy Scale) was used before and after the
project to determine the patients’ self-efficacy scores. The project implementation took place
over a three-month period of time.
Though the number of project participants was small, and difficulties were encountered
with follow-up with some patients, overall the pilot project was successful at increasing
self-efficacy scores, with a mean pre-project score of 7.57, and a mean post-project score of 8.08,
which is an increase of 0.51. The mean Hemoglobin A1c (HbA1c) pre-project was 8.75, and the
mean HbA1c post-project was 8.19, indicating a decrease of 0.56. Any decrease in A1c can be
seen as clinically significant, as even small reductions can decrease short and long term
complications of diabetes.
This evidence-based change in practice project met its objective of increasing patients’
primary practice settings. Sharing tools that are developed based on the current evidence will
help to improve all patient healthcare outcomes.
Key Words: Type 2 diabetes, disease self-management programs, diabetes in minority
populations, chronic disease management
Acknowledgements
The road to getting my doctorate has been quite a journey and I have so many people to
thank for helping me along the way. First: a huge thank you to my chair and advisor Dr. Stefan
Rowniak who has been a calm, patient and gentle guiding hand throughout this entire process.
And thank you to Dr. Alexa Colgrove Curtis and Dr. Jo Loomis, my other DNP committee
members, not only for their time and patience, but also for helping to shape me as a future Nurse
Practitioner. Having these professors as mentors made my time in school extraordinary. I would
also like to especially thank my preceptor, Sarita Kumar, for her countless patience and
mentoring. There are so many countless other people and I cannot include them all, but I would
like to thank my cohort in the FNP program for the camaraderie, emotional support and many
laughs.
Finally, I want to thank my two sons: Jordan and Justin, who have put up with all of the
years of Mom in grad school. I did it guys!! They have been incredibly patient and
understanding through all of the years, and I know that without their support I could not have
accomplished this. Also I would like to thank my ex-husband, Doug, parents, Don and Donna,
my sister and brother, Michele and Michael, and all of my friends for all of their words of
encouragement. They say it takes a village to raise a child; I believe it takes a village to produce
a Doctor of Nursing Practice student, because I could have not done it without all of the
TABLE OF CONTENTS
Section I………2
Abstract………..2
Key Words……….3
Acknowledgements………3
Table of Contents………...4
Section II: Introduction………..7
Background Knowledge……….7
Local Problem………9
Gap Identified………11
Intended Improvement………..12
AIM Statement………..12
Review of the Evidence……….13
Findings……….14
Nam, et al………...14
Ricci-Cabello, et al……….16
Cochrane Review………...17
Conclusions………19
Diabetes Initiative………..20
Conceptual or Theoretical Framework………..21
Section III: Methods………22
Ethical Issues………..22
Planning the Intervention………23
Communication Matrix Plan………...26
Implementation………26
Planning the Study of the Intervention………27
Methods of Evaluation……….29
Analysis………....31
SWOT Analysis………31
Budget and Return on Investment Plan………....32
Section IV: Results……….33
Program Evaluation/Outcomes……….34
Quantitative Results………..34
Qualitative Results………35
Evaluation Process………36
Section V: Discussion……….38
Summary………38
Implications for Advanced Nursing Practice……….39
Relation to Other Evidence………39
Barriers to Implementation………40
Lessons Learned……….41
Interpretation………..42
Conclusions………43
Section VI: Other Information...43
Section VII: References...45
Section VIII: Appendices………...51
Appendix A: Comparison of Number of Cases in Stanislaus County vs. California……51
Appendix B: Systematic Review Appraisal Sheet……….52
Appendix C: IRB Certificates………54
Appendix D: Diabetic Logbook (English Version)………..57
Appendix E: Diabetic Logbook (Spanish Version)………..67
Appendix F: Diabetes Self-Efficacy Scale (English Version)………..77
Appendix G: Diabetes Self-Efficacy Scale (Spanish Version)……….79
Appendix H: Pre-Project Questionnaire (English/Spanish)………..81
Appendix I: Post-Project Questionnaire (English/Spanish)………..82
Appendix J: Responsibility/Communication Matrix………83
Appendix K: GANNT Chart of Project Timeline……….84
Appendix L: SWOT Analysis………..85
Appendix M: Cost/Benefit Analysis………86
Appendix N: Budget………87
Appendix O: Self-Efficacy for Diabetes Scores………..88
Appendix P: Diabetes Management Self-Efficacy Scores Graph………...89
Appendix Q: HbA1c Pre- and Post-Intervention………90
Appendix R: A1cs Pre- and Post-Project Graph……….91
Appendix S: Pre-Project Questionnaire Responses……….…92
Appendix T: Post-Project Questionnaire Responses……….…..93
Section II: Introduction Background Knowledge
Type 2 Diabetes Mellitus (T2DM) is a complex, chronic illness that has been increasing
at an exponential rate in recent years in the United States. It is estimated that T2DM will affect
53 million Americans by 2025 with medical costs of approximately half a trillion dollars
annually, and will reach a prevalence of 33% by 2050 (Rowley & Bezold, 2012; Boyle,
Thompson, Gregg, Barker, & Williamson, 2010). The financial burden on individuals and
society for the care of diabetic patients is tremendous, with the current direct medical cost for
diabetes approaching $306 billion dollars per year (Herman, 2013).
The diabetes epidemic is not limited to the United States: the World Health Organization
(WHO, 2015) estimates that by the year 2030, diabetes will be the seventh leading cause of death
globally. Part of the increase in T2DM has been attributed to the epidemic of obesity, sedentary
lifestyle, and an aging population (Glazier, Bajcar, Kennie & Willson, 2006). It is estimated that
33% of adult Americans and 17% of U.S. children and adolescents are obese (CDC, 2015).
Minority populations including Hispanics, African-Americans, and Native Americans
have a higher percentage of diabetes in their populations. The rate of T2DM among U.S.
Hispanics has increased by 46% from 1997 to 2011 and 12.8% of Latinos have type 2 diabetes
compared to 7.6% of non-Latino Caucasians (CDC, 2015). Additionally ethnic minority groups,
including those with chronic disease, are less likely than Caucasians to receive the health
services that they need (Smedley, Stith, & Nelson, 2003).
Type 2 diabetes can lead to emotional and financial burdens and cause complications
including cardiovascular disease, end-stage renal disease, blindness from retinopathy and
disease, including ischemic strokes and myocardial infarctions, compared to the general
population (Sarwar et al., 2010).
According to the American Diabetes Association (ADA, 2014), the diagnosis of T2DM
can be made by measurement of the hemoglobin A1c (HbA1c), fasting plasma glucose or from
an oral glucose tolerance test. If the A1c is > 6.5%, the fasting glucose is > 126 mg/dL or the
blood glucose is > 200 mg/dL 2 hours-post glucose load with an oral glucose tolerance test, the
person is considered to have diabetes. Additionally, a diagnosis of diabetes can be made if the
person is having classic symptoms of hyperglycemia (polydipsia, polyphagia, polyuria) with a
random serum glucose > 200 mg/dL.
The HbA1c has been recognized as a standard of measure in the diagnosis and treatment
of diabetes and an A1c of 7% or less is correlated with a reduction in diabetic complications
(ADA, 2014). Each percentage point decrease in HbA1c over ten years is correlated with a 21%
reduction in deaths related to diabetes, 14% for myocardial infarctions and 37% for
micro-vascular complications (Turner, et al., 1998).
The American Diabetes Association 2014 treatment guidelines for diabetes include an
annual dilated eye exam, a yearly comprehensive foot exam, and annual urine micro-albumin
testing. Recommended periodic testing includes a lipid panel, kidney function tests, and HbA1c
testing at least twice per year. The A1c should be tested quarterly if the value is not within range
or if modifications to the treatment plan are made. Blood pressure and body mass index
measurements are recommended at each provider visit. Routine vaccinations for diabetics
include influenza and pneumonia vaccines. An ongoing assessment of the patient’s psychosocial
Along with a target A1c of < 7.0%, pre-prandial glucose should be between 80 and 130
mg/dL, and post-prandial glucose one or two hours after a meal should be < 180 mg/dL. These
are guidelines, and the practitioner always needs to take individual variability into account,
including whether or not the patient has had severe hypoglycemic episodes in the past.
There are many reasons why diabetics may not effectively self-manage their disease,
including low health literacy, financial inability to pay for medications or health provider
appointments, not knowing potential complications of unmanaged diabetes, lack of social
support and depression or other psychological illness. Furthermore, in minority populations,
lack of access to care, potential lack of transportation, and not speaking English are additional
barriers to managing diabetes (Glazier et al., 2006).
Without a comprehensive model for primary care, which includes creating the impetus
for self-management of diabetes, the cost and burden to individuals and society will continue to
spiral out of control. Additionally, with the passage of the Affordable Care Act (U.S.
Department of Health and Human Services, Patient Protection and Affordable Care Act, 2010),
many people with chronic disease now have health insurance and access to care. Many of these
have been without medical care for years, and may have undiagnosed or untreated diabetes, as
well as other chronic diseases. Healthcare providers must be able to meet the needs of this
medically underserved population.
Local Problem
The rise of T2DM across the U.S., and especially in California is linked to the rising
population of ethnic minorities, as well as the rise in obesity rates. According to the California
Health and Human Services Data Portal, 40% of California’s medically obese population is of
that at least 30% of boys and 40% of girls born in the year 2000 will be diagnosed with diabetes
in their lifetime. It is also predicted that by 2023, Californians will be burdened with more than
4 million cases of chronic disease, at a cost of approximately $19 billion annually, and almost
$100 billion in lost productivity (California Health and Human Services [CHHS], 2015).
According to the Stanislaus County Public Health site (Stanislaus County Health Services
Agency [SCHSA], 2015), as of 2013, the percentage of the Latino population in Stanislaus
County was 42.5%, compared to 38% in California overall. One reason for this fact is the large
number of Latino migrant laborers who come to work in the agricultural industry in the San
Joaquin Valley.
The Stanislaus County Department of Public Health states that type 2 diabetes is a
growing problem. From 2003-2005 (most recent data), the percentage of diabetics in Stanislaus
County increased from 5.9% to 9.4%. This is in comparison to California, which had an increase
from 6.6% to 7.0%. Therefore, the rate of growth of diabetes in Stanislaus County is higher than
for California, and may be due in part to the large Hispanic population that resides there, as well
as the increasing percentage of obese adults (SCHSA, 2015). As of 2008, the percentage of
obese adults in Stanislaus County was 33%, compared to 23.3% in California (SCHSA, 2015).
The Agency for Healthcare Research and Quality (AHRQ) provides data on Prevention
Quality Indicators (PQI) both at the state and county level for diabetes. The four PQIs for
diabetes include short-term complications, which had an average of 56.1 cases per 100,000
population for California, compared to an average of 99.4/100,000 in Stanislaus County;
long-term complications, which had an average of 107.4 in California compared to 147.3 in Stanislaus
County; amputations of lower extremities, which had an average of 16.1 in California compared
California compared to 19.4 cases in Stanislaus County (see Appendix A). These statistics show
a need for increased preventive medical care and better management of chronic disease in
Stanislaus County.
Golden Valley Health Center (GVHC) is a Joint Commission-Accredited, private,
nonprofit, Federally Qualified Health Center, serving Merced and Stanislaus Counties in
California. It is a community-based healthcare organization offering medical and dental care,
behavioral health services, and health education. Part of the mission of GVHC is to provide care
for everyone, regardless of culture, language spoken, or ability to pay. They serve many of the
medically uninsured and underinsured, low-socioeconomic status, and ethnic minority
populations in rural Merced and Stanislaus Counties.
Gap Identified
Many of the clients at GVHC have chronic health conditions, including type 2 diabetes.
At this point in time there is no formal logbook being used in the practice at GVHC. They do
have blank sheets of paper with the title “glucose log”, for patients to record their blood sugars,
but this log is not given to every diabetic patient. There is no consistency on how each primary
care provider furnishes care to their chronic disease patients. Some may have their diabetic
patients return in two weeks with a recorded glucose log, if the patient’s A1c is high, whereas
other providers may not have their patient return for another three months or longer. There is no
uniformity in terms of the diabetic teaching, or information given to patients regarding their
disease. It is recommended that patients be referred to a health educator within the organization,
but this is not routinely done; additionally, diabetic patients should have an annual referral for a
There is a diabetologist, an internal medicine physician with a subspecialty in
endocrinology, who works at the clinic. Providers can refer their more difficult cases to this
physician. However, this physician is not able to see every patient whose diabetes is not well
controlled. If more consistent processes are put in place to help the primary care providers and
their patients to manage their diabetes, then the overall management and health of the patients
will improve. Part of this need is for the patients at GVHC to learn better self-management of
their diabetes through written information and education.
Intended Improvement AIM Statement
The intended improvement with this Doctor of Nursing Practice (DNP) Evidence-Based
Change in Practice Project is to improve self-efficacy in patients with type 2 diabetes in order to
help them with self-management of their disease. Self-efficacy is described as the confidence
and the ability to achieve certain actions or goals (Bandura, 1977). In this case self-efficacy
involves patients having the confidence and knowledge to manage their blood sugar, including
hypoglycemia events, to keep track of lab values, including HbA1c, lipid levels, blood pressure,
and annual exams.
The intended improvement is that within three months, the type 2 diabetic patients, ages
18-64 years, in Sarita Kumar FNP’s practice at Golden Valley Health Center Clinic, with a
HbA1c > 7 % will have utilized the diabetic logbook to keep track of appointments, annual exam
dates, current medication regimens, and blood sugars. By using this tool, patients will feel
empowered to self-manage their diabetes and will have a higher self-efficacy score, as well as
experience an improved quality of life and better control of their disease management, as
by these patients being empowered to better self-manage their disease, there will be a decrease
seen in the HbA1c. The question this test of change is attempting to answer is: will there be an
increase in patient’s perception of self-management of their diabetes with this evidence-based
change in practice project?
Review of the Evidence
This literature review was undertaken to search for the best evidence regarding
self-efficacy and self-management in patients with type 2 diabetes. The Johns Hopkins Nursing
Evidence-Based Practice Appraisal Tool (The Johns Hopkins Hospital/The Johns Hopkins
University, 2012 – see Appendix B) was used to evaluate the literature for studies with the
strongest evidence. According to this Appraisal Tool, Level 1 is the highest in regards to
strength of evidence and includes Experimental Study (Randomized Controlled Trials) and
Meta-Analyses of Randomized Controlled Trials. Level 2 includes Quasi-Experimental Studies,
which involves manipulation of an independent variable, but lacks randomization to groups or a
control group. Level 3 involves Non-Experimental studies, Qualitative Studies, and
Meta-Syntheses.
A literature search was undertaken in PubMed, Cinahl and Academic Search Complete
using the search terms “type 2 diabetes self-management”, “type 2 diabetes and self-efficacy”,
and “type 2 diabetes in minority and underserved populations”. Inclusion criteria for articles
were articles written in English, targeted to ethnic/minority or medically underserved populations
with type 2 diabetes, at least 18 years old, and with an intervention directed at self-management
of diabetes. Additionally, only articles that were available as full text through the University of
Three meta-analyses were found in the search process and are included in this review as
part of the process of evaluating and synthesizing the evidence from the literature. According to
the Johns Hopkins Appraisal Tool, meta-analyses are one of the strongest levels of evidence:
Level 1. The majority of the studies included in the meta-analyses are randomized controlled
trials (RCTs) and controlled trials. These findings are reported in chronological order, with the
earliest studies presented first.
The primary outcome in most of these studies is change in HbA1c, with secondary
outcomes of improved lipid profile, improved blood pressure, and improvements in the number
of annual dilated eye exams, and annual foot exams. Outcomes also looked at self-monitoring of
blood glucose, adherence to diet, exercise, and taking diabetic medications. Most of the
interventions incorporate the idea of cultural competence.
Cultural competence is described as using familiar language and cultural norms to reach
ethnic populations when engaging with them. As described by Nam, Janson, Stotts, Chesla, and
Kroon (2012), cultural competence in a self-management program means integrating cultural
beliefs, values and customs, family support, and familiar foods, language, and health practices.
Findings
A meta-analysis by Nam et al. (2012) looked at the effects of a culturally tailored
diabetes education (CTDE) program in ethnic minorities with T2DM. The objective of the
meta-analysis was to see if use of a CTDE had an effect on HbA1c. Twelve studies met the inclusion
criteria: RCTs between 1990 and 2009, English language studies, studies that had an educational
intervention targeted to minority groups with T2DM and studies that reported HbA1 levels pre-
and post-intervention. An effect size (ES) was calculated based on the difference in HbA1c
differences with 95% confidence intervals. The random effects model was used due to the
differences in study participants, interventions and outcomes.
Since there were differences among studies, three subgroup analyses were performed: the
first subgroup analysis was performed using the baseline HbA1c, the second subgroup analysis
was done using the intervention setting, and the third subgroup analysis used intervention length,
from three to twelve months. The researchers also tested for heterogeneity and publication bias.
The 12 studies in this meta-analysis included a total of 1495 participants. Demographic
data indicates the mean age of the participants was 63.6 years and 68% of them were women.
All of the 12 studies included ethnic minority groups and the average baseline HbA1c was 8.6%.
Most of the studies were performed in the U.S. and the mean sample size was 124.
The educational interventions were done in group sessions, or a combination of group
and individual sessions. The control groups were either usual care or a minor intervention, in
comparison to the treatment groups. The educators included a variety of job descriptions, from
registered nurse to certified diabetes educator to pharmacist. Length of the intervention ranged
from one to twelve months and the setting varied from community-based to hospital-based
clinics.
All of the studies in this meta-analysis included interventions that were culturally
focused. Depending on the ethnic group (Latino, African-American, Asian) the interventions
included information on diet, exercise, and self-management of diabetes as well as including
family members. The written materials were in the primary language, if not English, and visual
aids were utilized to help those with low literacy.
After the intervention, most of the studies showed a reduction in HbA1c from baseline
-0.13). This indicates the interventions were effective in reducing A1C in ethnic minority groups
using culturally tailored educational interventions. The largest change in A1c in the intervention
groups was seen at six months (ES -0.41, 95% CI, -0.61 to -0.21). The changes in A1c at three
and twelve months were not significant. Additionally, the participants who had a baseline
HbA1c < 8.5% had a larger decrease in A1c than those with a baseline HbA1c > 8.5%. The
reasons for this are unclear.
The authors concluded that the culturally tailored diabetes education programs in the
trials in the meta-analysis did show benefit in reducing the HbA1c. The strengths of this study
include the meta-analysis, the inclusion of RCTs, with studies that targeted minority populations,
and the statistical analyses that looked at effect size, heterogeneity, and bias, such as publication
bias. The weaknesses include the fact that no other outcomes were examined, besides HbA1c, so
it is unknown if other effects, such as diabetes knowledge, diabetes self-management, blood
pressure, and lipid panels were improved. Also, since the majority of the participants were older
females, the generalizability of the studies comes into question.
A meta-analysis and meta-regression done by Ricci-Cabello, et al. (2014) examined the
literature to determine which self-management programs were most effective in ethnic minority
groups with type 2 diabetes. Thirty-seven studies were identified for inclusion in the
meta-analysis, 20 of which were randomized controlled trials. Most of these studies took place in the
U.S. and included ethnic populations of African-Americans, Latinos, Asians, Alaskan-Eskimos,
and multiethnic groups. The majority of the interventions took place in the setting of a primary
care office or clinic and included group, one-on-one teaching, or both. Didactic and situational
problem solving were the most commonly used teaching methods. Educational content included
psychosocial information. Most of the studies were culturally tailored to ethnic minorities and
there were a mixture of educators in the interventions, from nurse to dietician to physician. The
average length of the intervention was 8.2 months with a mean duration of ninety minutes per
session.
The outcomes of the interventions were measured by an increase in diabetes knowledge,
and diabetes self-management behavior that included diet, exercise, blood glucose monitoring,
and foot self-examination. Clinical outcomes measured HbA1c, body mass index, and blood
pressure. The researchers gathered the average HbA1c from each trial. Confidence intervals of
95% were calculated using random effects models. Heterogeneity and publication bias were also
quantified.
The RCTs, with a total sample of 3,094 patients, showed a reduction in HbA1c of -0.31%
(95% CI, -0.48% to -0.14%). The interventions in diabetes self-management included
educational content regarding diet, exercise, self-monitoring of blood glucose, medication
adherence, and basic diabetes knowledge. Meta-regressions showed a bigger reduction in
HbA1c in those studies that involved individual rather than a group intervention, and face-to-face
rather than technological interventions. Additionally, studies that involved peer educators, were
based on cognitive reframing techniques, and those that had a lower number of teaching methods
were more successful in achieving desired outcomes. The strength of this review is that it
includes a meta-analysis and meta-regression utilizing randomized controlled trials.
Weaknesses include no long-term follow-up, and no cost-effectiveness studies.
A Cochrane Review (Attridge, Creamer, Ramsden, Cannings-John & Hawthorne, 2014)
examined culturally appropriate interventions for ethnic minority groups with type 2 diabetes.
controlled trials, type 2 diabetics, and participants who were from ethnic minority groups in
countries with a similar standard of living to the United States.
A total of 33 studies were included in the review, with 7453 participants. In 14 of the
trials (1442 participants) there was a reduction in HbA1c by -0.4% (CI 95%, -0.5 to -0.2), at
three months, after a culturally appropriate intervention. Additionally, in 14 of the trials, there
was a six month reduction in HbA1c of -0.5% (CI 95%, -0.7 to -0.4), although the mean
difference in A1c lessened at twelve and twenty-four months. These statistics are
post-intervention and in comparison to a group who received usual care.
The interventions in the studies were too heterogeneous to group, but the included studies
used culturally competent health education. There was no significant increase in quality of life
seen in these studies, in comparison to treatment as usual. Knowledge about diabetes did show
improvement at three, six, and twelve months. An initial reduction in triglycerides was seen at
three months, but did not maintain at six or twelve months. Other lipid profiles did not improve
relative to the control group (low density lipoprotein, high density lipoprotein, total cholesterol).
Additionally, markers of blood pressure, body mass index, self-efficacy, and empowerment were
not statistically different from the control group.
The authors concluded that short term and medium term effects (three and six months)
did show a reduction in HbA1c, increased knowledge about diabetes, and living a healthy
lifestyle through the use of culturally competent interventions in the trials.
The strength of the Cochrane Review is the large amount of studies that were looked at
by the authors, as well as the inclusion of studies that incorporated cultural competence. The fact
that the interventions were varied, making it difficult to compare across studies, does not allow
studies were self-reported by participants, leading to possible bias in this regard. Additionally,
because of the nature of the interventions, researchers and participants were rarely blinded,
leading to the risk of performance bias. No long-term follow-up was done, so the sustainability
of these outcomes is questionable. Also, there were no economic analyses to determine what the
reduction in cost in healthcare would be if the implementation of the interventions led to better
diabetic outcomes.
Conclusions
There are a multitude of factors that influence chronic disease management, from the
patient’s ability to self-manage, levels of self-efficacy, whether or not the patient has social
support, and whether or not the patient has some form of psychological illness. Also, having
processes in place at the clinic, including interdisciplinary management and education of
clinicians, is imperative to the management of chronic disease (Corser & Yin, 2009). The use of
culturally competent care, including being familiar with the language and culture, can only
enhance care, and help to reduce health disparities. Through review of the literature on diabetes
self-management, it can be seen that there has been some success in populations, including
ethnic minorities, in reducing HbA1c, increasing diabetes knowledge, and increasing self-care
activities, especially with the use of culturally tailored diabetes self-management programs.
The A1c was the primary outcome in most of the studies, although other outcomes also
had positive effects, including patient knowledge about diabetes, increases in self-care activities
such as blood glucose monitoring, adhering to a diabetic diet, exercise, and follow-up with health
providers. In addition to being culturally competent, the studies that had the biggest impact on
technology. Reasons for this may include low technology literacy, barriers to accessing these
technologies and language barriers in these populations.
The sustainability of the results was not seen in these studies, as most of the quantifiable
results diminished by 12 months. Further research needs to be done, specifically RCTs, to
determine which interventions work best for diabetes self-management programs in ethnic
populations with type 2 diabetes. Additionally, quantitative and qualitative research needs to be
done to determine how to sustain the intervention effects in studies.
However, there are limitations in doing controlled studies in a population already
marginalized and not receiving appropriate healthcare. The question then becomes: is it ethical
to withhold an intervention that may help an individual who already has limited resources? The
logistics of designing such a study is something that will need to be carefully considered. It
appears that outreach programs in communities, such as health fairs and use of community health
workers, may be a compelling place to start to design these programs.
Diabetes Initiative
An initiative by the Robert Wood Johnson Foundation, called the Diabetes Initiative, was
a national program conducted between 2002-2009 to improve self-management support for
adults with diabetes in clinic and community environments. This Initiative sought to validate
that diabetes self-management programs could be instituted in real-life community settings,
based on research from academic centers and the current literature. The 14 health center sites for
the Initiative included both urban and rural clinics, as well as sites with ethnic minorities and
medically underserved populations.
The Initiative states that individuals need resources and support for self-management of
collaborative goal-setting, key skills for disease management and healthy behavior, ongoing
follow-up and support, and community resources.” One of the key lessons learned was that
diabetes self-management is essential and can be successfully implemented in real-world models
(Robert Wood Johnson Foundation, 2009).
Conceptual or Theoretical Framework
The theoretical framework most often used in disease self-management is the theory of
self-efficacy by Albert Bandura (Jang, & Yoo, 2012; King et al., 2010; Walker, Smalls,
Hernandez-Tejada, Campbell, & Egede, 2014). Bandura’s work in social cognitive theory and
self-efficacy promotes the idea that behaviors are a result of a person’s belief in whether or not
he has the ability to accomplish certain tasks or skills. This belief gives him the confidence to
overcome any barriers that may present in his life and provides the motivation to perform
self-care activities. This theoretical model allows the individual to assume responsibility for the self-care
and management of his chronic disease through self-mastery, and the development of confidence
in his ability to care for himself. It is a difficult and complex process to translate research into
practice, and the lack of a theoretical foundation for this process is often the reason for failure
(Eccles, et al., 2012). By implementing efficacy as a framework into this diabetic
self-management program, it is hoped that the patients will gain the mastery and confidence needed
to better manage their chronic illness.
Ethnic minorities and those who come from a low socioeconomic status tend to have less
self-efficacy. The reasons for this are unclear but may include low self-worth and less
confidence in ability as a result of coming from a disadvantaged background (Walker, Smalls,
enhance the self-efficacy of marginalized populations, so that they may reap the benefits of an
improved quality of life.
Section III: Methods Ethical Issues
As required by the University of San Francisco DNP curriculum, the online Institutional
Review Board (IRB) training modules on Human Subject Assurance Training were completed
(Appendix C). These training modules were developed by the U.S. Department of Health and
Human Services (HHS). The purpose of the training modules is to allow the student to gain an
understanding of the purpose of an IRB, and when an IRB approval is needed. According to the
USF website, the purpose of an IRB is to “safeguard the physical, social, and emotional
well-being of individuals” who are participants in a research project (University of San Francisco,
2015).
Prior to beginning the project, this student completed a DNP Project Approval Form
including a Statement of Determination, which was reviewed and approved by the student’s DNP
chair and committee as an evidence-based change in practice project. Therefore this project was
verified as a quality improvement project, not a research project, and the USF Institutional
Review Board for the Protection of Human Subjects (IRBPHS) approval was not required.
According to the U.S. Department of Health and Human Services (2015), a quality
improvement project “consists of systematic and continuous actions that lead to measurable
improvement in health care services and the health status of targeted patient groups.” Privacy of
each of the patients was protected. No individual identifying information was linked to the
surveys. This DNP student reports no conflict of interest in regards to this project. Participation
The patients who participated in this pilot project were given the diabetic logbook,
instructed on use of the book, and asked only to complete a pre- and post-survey. Since there
were a limited number of logbooks printed for the pilot program, only those in whom the A1c
was greater than 7% were given a logbook. Ideally, if the pilot project is a success, Golden
Valley Health Centers will adopt the logbook to use clinic wide, and all diabetic patients at
GVHC will have access to this resource.
Setting
The setting was a primary care clinic, Golden Valley Health Center, located in Modesto.
Modesto is a city in the central valley of California, and according to the 2013 census, has an
estimated population of 205,000 people. The median resident age is 33.9 years and the median
household income, as of 2013, was $46,329. In Stanislaus County, which includes Modesto,
43.5% of the population is Hispanic (U.S. Census Bureau, 2015).
Golden Valley Health Clinics began in Merced, California in 1972 as a migrant worker
health clinic. It has since grown into 26 sites, with 120 clinicians, at clinics in Merced and
Stanislaus Counties (Golden Valley Health Centers). At the clinics there are multiple primary
care providers, including physicians (MDs, DOs), nurse practitioners (NPs) and physician
assistants (PAs). Each provider sees patients independently. The population consists mostly of
low-income, minority and medically underserved populations. Each provider has two medical
assistants (MAs), who are bilingual in English and Spanish, who place the patients in the rooms,
obtain vital signs, set up appointments, and assist with translation.
Planning the Intervention
Many of the clients at GVHC have chronic health conditions, including type 2 diabetes.
provides an opportunity for a pilot quality improvement project to help the patients at GVHC,
with type 2 diabetes, to better manage their chronic disease with the aid of a logbook. The plan
for this Doctor of Nursing Practice (DNP) project was to introduce the logbook to approximately
20 patients in Sarita Kumar FNP’s practice at GVHC, who are diabetic, between the ages of
19-64, and who have a HbA1c > 7 %, indicating poor glucose control. The project was discussed
with and permission granted by the preceptor, Sarita Kumar, Family Nurse Practitioner (FNP),
and the Director of the Family Practice clinicians at Golden Valley Health Center, Florida suites,
Dr. Elaine Soriano.
Planning the intervention involved doing research on various diabetic logbooks. This
writer found some good examples from the American Diabetic Association, the Wisconsin
Diabetes and Prevention Program, the Canadian Diabetic Association and drug companies such
as Lilly, Bayer, and BD. Based on ideas from these, a unique diabetic logbook was created in
both English and Spanish (see Appendices D and E). The source for the diabetes target numbers
and information regarding diabetes was the American Diabetic Association (ADA).
The logbook is essentially a diabetes self-management workbook. It contains
information regarding blood sugar goals, blood glucose monitoring sheets, current medication
regimen, how to recognize and treat hypoglycemia, and dates of last annual exams. Additionally
there is space to keep track of provider appointments and for the patients to write down
questions. There are instructions for patients to call the office if blood sugars remain
consistently elevated for a specified period of time or if the patient is experiencing hypoglycemic
episodes. This DNP student’s role was as project manager and to educate the patients on how to
use the logbook, with the assistance of the bilingual medical assistants for Spanish speaking
It was anticipated that when the patient came in for his appointment with his healthcare
provider, he would bring this log. Reviewing the log with the patient would also help the
provider to track blood sugars, annual exams and current medications. Additionally, if a patient
changed his provider, this guide would help the new practitioner to see, at a glance, what has
been done for the patient and what medications he is currently taking.
A questionnaire was to be distributed to patients prior to the start of using the logbook to
assess their self-efficacy and additional questions asked to determine how they feel about using a
logbook. Research led to a Diabetes Self-Efficacy Scale created by the Stanford Patient
Education Research Center (2003). This Scale is available in both English and Spanish and is
free for anyone to use. This 8-item scale is a psychometrically validated tool to assess
self-efficacy in patients with diabetes in an English version (Lorig, Ritter, Villa, & Armas, 2009) and
a Spanish version (Lorig, Ritter, & Gonzalez, 2003). This scale has an internal consistency
reliability of 0.828 for the English version and an internal consistency reliability of 0.854 for the
Spanish version (See Appendices F and G). The additional questions proposed to the patients
were: “Do you currently check your blood sugar every day?” (Yes or No), “Do you currently
write down your blood sugar numbers?” (Yes or No), and “How comfortable do you feel using a
daily logbook for your diabetes?” (Circle a number from 1 [very uncomfortable] to 10 [very
comfortable]) (See Appendix H).
After several months of using the logbook, a post-survey questionnaire using the same
Stanford Diabetes Self-Efficacy scale was to be given to the same patients to reassess
self-efficacy and whether the log helped them to manage their diabetes. Additional questions to be
asked at this time were: “Do you feel that using this logbook has helped you with managing
number from 1 [very easy] to 10 [very difficult]) (See AppendixI). Also, a space was given for
the patient to write any comments or concerns. The logbook and the questionnaires were printed
in both English and Spanish. In this pilot project, these were the two languages made available
since a large percentage of the patients at GVHC are Hispanic. In the future, if the program is
extended clinic-wide, additional languages may need to be considered.
Communication Matrix Plan
This DNP student was the project leader, with backing from Sarita Kumar FNP, and Dr.
Elaine Soriano. The chair of the DNP committee was Dr. Stefan Rowniak, and the other
committee members were Dr. Alexa Colgrove Curtis and Dr. Jo Loomis. This student reported
directly to Dr. Rowniak and to Sarita Kumar FNP, while keeping the other committee members
apprised of the project, including any changes or barriers to implementation. Any feedback from
the chair and other committee members were evaluated and implemented in regards to this
project. The DNP student kept all of the people involved in the dissemination of the project
informed. This included the nurse practitioner, the medical assistants and the office supervisor.
Having brief meetings at the beginning of the day was one method to ensure the flow of
information and to clarify any questions or uncertainties about the project (See Appendix J).
Implementation
Implementation of the project started with translating the logbook from English to
Spanish. This author asked the medical assistants to assist with the translation. The MAs were
willing to help with this process and completed the translation within one week. To ensure the
translation was correct, additional steps were taken, including use of an online translator, as well
as having two native Spanish speakers who are high school teachers proofread the book and
The next step of implementation involved getting the logbooks printed in both English
and Spanish. A nearby printing service, associated with a national office supply store, was able
to accommodate the printing of the books. The original idea was the have the logbook be a
small, folded booklet that could be carried in a pocket or a purse. Challenges in the printing
process made this format difficult, so instead the logbook was printed on 8.5 x 11 inch pages in a
portrait format. The information was printed on both sides, in color, and had a comb-style black
binding with a clear plastic cover. This arrangement worked well and allowed all of the
information to be easily read and for the logbook to be useable.
Implementation of this DNP project included identifying patients with type 2 diabetes
with a prior A1c > 7%. Sarita Kumar, FNP, and her MAs assisted in this process by scheduling
diabetic patients on Tuesdays, which is the day this student was at the clinic. Patients could be
selected as appropriate from this system. When a patient came in to the clinic, this DNP student
saw the patient for his diabetic check, and then introduced the logbook to the patient. If the
patient could only speak and understand Spanish, one of the MAs assisted with translation. At
this time, the patient filled out the pre-project survey and questionnaire.
After several months of using the book, patients were scheduled to come in for a follow
up appointment. At the follow up, this student spoke with the patients to see if they were using
the logbook, and then had them fill out the post-survey and questionnaire. The patients then
were instructed to have lab work done, as previously planned.
Planning the Study of the Intervention
Please refer to the Gannt chart in Appendix K for a diagram of the work breakdown
structure. This chart was used as a template for the planning of the project. The first item on this
for the research and development of this deliverable. Other logbooks were to be examined to
determine what should be included in this logbook for diabetics, including information from the
ADA, the New York Diabetes Coalition, Kaiser Permanente, and from such companies as Bayer
Lilly. Additionally, the criteria put forth by the American Diabetes Association (2014) for
recommended frequency of exams would be included in the logbook. The creation of both the
English and Spanish versions of the book would be accomplished in this phase.
The next phase of the project would involve printing of the English and Spanish logbooks
after finalization of the version to be used. This phase was estimated to take approximately one
week, depending on the source for the printing. After completion of the printing, the workbooks
would be checked for any errors.
The third task involved identifying patients in Sarita Kumar’s practice who were
candidates for the pilot project. Any type 2 diabetic, between the ages of 18 and 64, with a
HbA1c > 7 % would qualify to participate in the project. Data on diabetic patients was to be
found in the electronic health record used at Golden Valley Health Center (NextGen). An
arbitrary number of 20 patients was an estimate of participants in the project. If during the
identification phase, more or less participants were found, the number would be adjusted. The
project was to be explained to the patients at the time they were given the pre-project
questionnaire. Patients would be informed of the right to refuse to participate. A total of two
months was designated as time for gathering information on patients and identifying which
patients qualified to participate in the project.
The next phase would involve having the identified patients fill out the pre-project
questionnaire. There are two parts to the questionnaire: the first part is the Diabetes
questionnaire involves questions related to whether or not they keep track of blood sugars and
whether or not they believe a logbook would help them in this regard. This phase would be
implemented concurrently with the next phase, which would be introduction to and education on
the logbook. Education and explanations would be given in the patient’s native language to
ensure understanding. The bilingual medical assistants would help to deliver this information in
Spanish. The patients would be instructed to call the office if they have any questions or issues.
The timeframe for completing these two tasks was two months.
The final follow up was to be at two to three months. The patients would have their most
recent labs, including HbA1c, which should have been done within one week of the follow up
appointment. At the follow up, the patients would again be given the Diabetes Self-Efficacy
Scale to fill out along with the post-project survey. Answers would be compared, pre- and post-
project and HbA1c numbers would be gathered.
The final review would involve looking at the scales and the surveys to determine if the
patients gained a better sense of self-efficacy through the project, and in managing their diabetes.
Any comments from patients would be considered as qualitative information. The A1c numbers
would also be examined to see if there were any decreases from the preceding A1cs.
Milestones were planned for and executed along the course of the project, including
completion of the Qualifying Examination, which incorporated the culmination of the project
prospectus and a manuscript of a literature review that was submitted for publication. Each
deliverable was submitted to the DNP chair and committee and approval received before passing
the Qualifying course.
According to Davidson (2010), there are six areas of evaluation questions. The first area
for the focus of evaluation involves process: “how well was the project designed and
implemented?” The second area for the evaluation is regarding outcome. Some of the questions
asked in this area include “how well did the project meet the overall needs?” Also, “how
valuable are the outcomes to the participants?” The third area of evaluation is “what was learned
from this process?” “What worked and what did not?” “Were there any unintended
consequences?” The fourth area of evaluation involves investment, both in time and money:
“was the project cost effective?” “Could it have been done in a different way?” The fifth area of
evaluation looks at what comes next: “can the project be shared and replicated elsewhere?” “ Is it
sustainable, or does it need continuing support?” The final area of evaluation, according to
Davidson, is “determining whether the project has a theory of change, and whether the project
informs the initial question.” All of these focus areas are included in the final evaluation of this
DNP project.
Reporting requirements included weekly updates given to the nurse practitioner.
Additionally, periodic updates were given to the chair of the DNP committee, to ensure the
project was on track and that if there were barriers, methods could be discussed for surmounting
those barriers.
The evaluation for this quality improvement project was via the pre- and post-project
questionnaires, which determined if there was an increase in self-efficacy and patient satisfaction
in being able to effectively manage chronic disease. The Stanford Diabetes Self-Efficacy Scale
was used as the pre- and post-project survey. This scale contains eight questions that ask how
scale is numbered from one to ten, with one being “not at all confident” and ten being “totally
confident”.
After the patient filled out the scale, it was scored and the mean number was tallied.
This number was compared from the pre-project survey to the post-project survey. If the
patients experienced an increase in self-efficacy, this should be reflected in the survey. When
the pre-project questionnaire was given, three additional questions were asked: “do you
currently check your blood sugar every day? (yes or no)”, “do you currently write down your
blood sugar numbers? (yes or no)” and “how comfortable do you feel using a daily logbook?
(scale numbered 1 [very uncomfortable] to 10 [very comfortable])” When the post-project
questionnaire was given, two additional questions were asked: “do you feel that using this
logbook has helped you with managing your diabetes? (yes or no)” and “how easy was it for you
to use the logbook? (scale numbered 1[very easy] to 10 [very hard])”.
Additionally, the HbA1c levels were looked at to see if there was a reduction in the
HbA1c levels of the patients who participated in the project. The A1c was compared to the
patient’s previous HbA1c from the prior three months.
Analysis
Strengths, Weaknesses, Opportunities, and Threats (SWOT) Analysis
The SWOT analysis (Appendix L) examines the assurances and the opposing
components of the project. Strengths of the project include support of the staff at Golden Valley
Health Center, Florida suites, in the planning and implementation of the project. This includes
support from Sarita Kumar FNP, Dr. Soriano, Dr. Ganupantula (the Diabetologist), and the
assistance of the bilingual medical assistants. Additional strengths were the low cost and ease of
receiving and using the logbook. The evidence from the literature supporting implementation of
a diabetes self-management project can also be seen as a strength.
Identified weaknesses include encountering patients who were not receptive to using the
book, and difficulty with follow-up with some patients who were unable to be contacted by
phone, or who didn’t show up to scheduled appointments. An additional weakness for this
project is that a few of the patients, after receiving the book, did not take the opportunity to read
it or use it.
Opportunities for this project include the chance for patients to learn better
self-management of their diabetes, to increase their diabetes knowledge, and to better control their
diabetes as manifested by a decrease in their A1c. Additional opportunities include a chance for
the clinic to use the logbook with all diabetic patients, and perhaps to evolve the book into a
model for self-management of other chronic diseases, such as hypertension and heart failure.
Threats to the project were potential inability to fund the logbook, the difficulties
encountered in translating and printing the logbooks, potential lack of provider or patient
support, and not being able to follow-up with patients as predicted. Additionally, a threat to the
project included a shorter time frame for the project than originally envisioned, and the fact that
the student’s preceptor had a planned three-week vacation, during which this DNP student had
limited access to the preceptor. In the preceptor’s absence, Dr. Soriano was available at the
clinic. A contingency plan was made prior to the preceptor’s departure to bring the patients in
for their follow up appointment as a “nursing visit”. A registered nurse, who works with the
providers at the clinic, is able to schedule appointments with the patients to review glucose logs.
In this way, this student could follow up with the patients to complete the post-project surveys.
See Appendix M for the Cost/Benefit analysis, and Appendix Nfor the Project budget.
The cost of the project was minimal, and included the cost of the printing of the logbooks
(approximately $400.00). Other services were voluntary, including the clinical hours given by
this student, as well as the hours for translation and assistance provided by the medical assistants,
and the schoolteachers who helped in the translation. Return on investment is difficult to
determine, but the actual per capita Medicare spending for diabetes over one year, in the state of
California was $18,513.00 (Centers for Medicare and Medicaid Services, 2012, most recent
data). As mentioned previously, each percentage point decrease in HbA1c over ten years is
correlated with a 21% reduction in deaths related to diabetes, 14% for myocardial infarctions and
37% for micro-vascular complications (Turner, et al., 1998); therefore by reducing the burden of
disease through intervention, a reduction in complications and medical costs will be the result.
An analysis done by Zhong, Lin, Cohen, Winn, and Neumann (2015) included a
systematic review of the literature for cost-utility analyses in diabetes. They concluded from
their analyses that most diabetic intervention programs are recommended by practice guidelines
and are cost-effective, with a potential for reduction in health care costs for the 7,117 patients in
the studies, of $12.5 million and the gain of more than 1,938 quality-adjusted life years over the
lifetime of these patients. That would mean a savings in healthcare costs of $1.756 million per
diabetic person over the course of their lifespan, which if divided by forty years (assuming a
patient is approximately forty years old and will live for another forty years), would mean a
savings of $43,900 per year. At the very least, a portion of the $18,513 spent per capita on
diabetic patients would be reduced. If this amount were multiplied by the number of diabetic
patients in the state, a tremendous amount of money could be saved.
Program Evaluation/Outcomes
A total of twenty logbooks were distributed to diabetic patients with an A1c > 7%. The
ages of the patients ranged from 33 to 64 years old. Fifteen of the patients were female, and five
of the patients were male. Eleven of the patients were Hispanic, six were Caucasian, two were
Asian and one patient was Assyrian. The actual implementation of the project took three
months, from distribution of the logbook to follow up in the clinic.
Quantitative Results
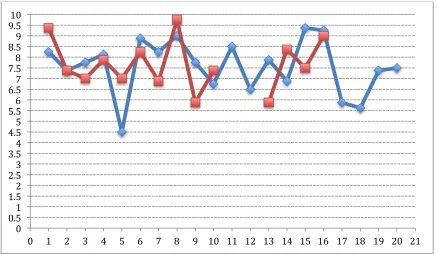
The pre-project Diabetes Self-Efficacy scores had a range from 4.5 to 9.375, with a mean
score of 7.57, and a median score of 7.75, based on twenty responses. The post-project Diabetes
Self-Efficacy scores had a range from 7.0 to 9.75, based on eleven responses (some patients were
lost to follow-up and some patients did not use the logbook and were excluded from the
post-survey results). The change in the mean from pre- to post-post-survey was an increase of 0.51, and
the change in the median from pre- to post-survey was an increase of 0.125 (See Appendices O
and P).
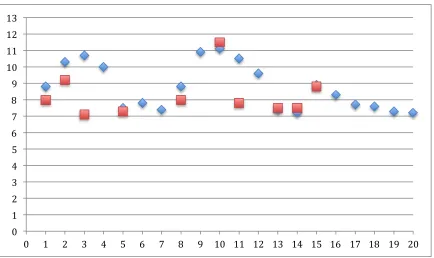
The pre-project A1cs had a range from 7.2 to 11.1, based on twenty patients. The mean
A1c was 8.75, and the median A1c was 8.55. The post-project range for A1cs was 7.1 to 11.5,
based on eleven results. Again, some of the patients were lost to follow up and some had not yet
completed their lab work. The post-project mean was 8.19, and the median was 7.8. This shows
a difference in the mean of -0.56 and a difference in the median of -0.75 (See Appendices Q and
R).
The pre-project questionnaire asked the patients if they checked their blood sugar every
day. Twelve of the respondents said yes, seven of the respondents said no, and one respondent
sugars. Seven of the respondents answered yes, that they record their blood sugars, twelve of the
respondents answered no, and one respondent declined to answer. Finally, the questionnaire
asked how comfortable the patients felt about using a diabetic logbook (from 1 [very
uncomfortable] to 10 [very comfortable]). The answers ranged from 1 to 10. The mean number
was 6.17 and the median was 6.0 (Appendix S). These questions provided a baseline to see how
many patients check their blood sugar, how many patients record their blood sugar, and how
comfortable they feel using a logbook.
The post-project questionnaire asked the question: “do you feel that using this logbook
has helped you with managing your diabetes?” Ten of the respondents answered “yes”, one
respondent answered “no”, two patients did not use the logbook, one declined to answer, and six
were lost to follow-up. The second question asked “how easy was it for you to use this logbook”
(From 1 [very easy] to 10 [very difficult])? The range of answers was from one to ten, the mean
was 5.5 and the median was 7 (Appendix T).
Further investigation may elucidate the reasons why patients felt the logbook did or did
not help with managing their diabetes, and why they found the book easy or difficult to use.
Qualitative Results
A final question posed to the patients was whether or not they had any comments or
concerns they would like to share with regard to the logbook. One patient wrote that using the
logbook has “drastically” helped her with managing her diabetes. Another patient wrote “the
logbook is my constant reminder – I have it with me at home so it reminds me to test, to check
and read labels”. One patient admitted she has not used the logbook because checking her blood
sugar and writing it down makes her “too nervous”. One patient liked the book so much that he
Evaluation Process
Davidson’s (2010) first area of evaluation involves process and asks “how well was the
project designed and implemented?” The design of the project was evidence-based, used cultural
competence and was designed to fill a gap in the practice at a Golden Valley Health Center
Clinic. The implementation phase met with some obstacles, including translating the logbook,
printing the book and following up with all of the patients. Future implementations could be
improved based on lessons learned.
The second area of evaluation involves outcomes and asks “how well did the project meet
the overall needs?” And also “how valuable are the outcomes to the participants?” The project
met the overall needs of the clinic and patients as identified by the gap in practice. The
outcomes are very valuable to the participants, because learning better disease self-management
and improving self-efficacy may help to increase overall health and quality of life.
The third area of evaluation is “what was learned from this process?” “What worked and
what did not?” and “Were there any unintended consequences?” What was learned from this
project is that one must be flexible and adaptable when implementing a project. When things
don’t go as planned, there must be a contingency plan in place. What worked was that overall
the logbook was well received by the patients and they were open to using it. Assistance from
the FNP and from the MAs was crucial in helping this project to work. What didn’t work well
was follow-up with some of the patients. The policy at GVHC is that they do not charge patients
if the patient does not come for a scheduled appointment. The philosophy of the organization is
that most of the patient populace is struggling financially and they don’t want to tax them further
consequence to missed appointments and therefore sometimes they have a high “no show” rate.
In this project, no unintended consequences were identified.
The fourth area of evaluation involves investment, both in time and money. The
questions asked here are “Was the project cost effective,” and “Could it have been done in a
different way?” This DNP project was cost effective. If the logbook is adopted for use in the
clinic, the printing cost and cost of training the clinic staff would be minimal. The time
investment would also be minimal, since the logbook has already been created. The return on
investment for the clinic would be huge, especially if the government begins to pay primary care
providers based on performance and quality indicators, as is done in acute care. Additionally the
knowledge that what is being done for the patient is right may result in higher levels of job
satisfaction among providers. It’s possible the project could have been done in a different way.
Diabetic education classes and outreach fairs are ways in which the project might have been
implemented.
The fifth area of evaluation asks whether “the project can be shared and replicated
elsewhere?” It also asks “is it sustainable, or does it need continuing support?” This project
certainly could be shared and replicated in any primary care practice or practice managing
chronic disease. Again, it is possible the book could evolve to include other types of chronic
disease, such as heart failure and hypertension. Additionally, in the future the use of technology
in disease management may be integrated into the process. This project is sustainable. The only
continuing support it requires is printing of the books, and ongoing education and support of the
primary care clinicians who are disseminating the information.
The final area of evaluation is whether “the project has a theory of change” and whether
Focusing on patient education, patient support, and giving patients a tool to help increase
self-efficacy was the framework for the project. The initial question asked: will there be an increase
in patient’s perception of self-management of their diabetes with this project? Though the
population was small, the majority of patients who utilized the logbook responded that “yes, this
logbook helped with their diabetic management”, along with the fact that there was a small
increase in the Diabetic Self-Efficacy Scale, indicates that the patients had an increase in their
self-perception of being able to manage their diabetes.
Section V: Discussion Summary
Type 2 diabetes continues to be a growing problem not only in the U.S., but worldwide
(CDC, 2015; WHO, 2015). Efforts to help with chronic disease management must include
education and support of patients, education and training of clinicians, and system-wide changes
in practice, in order for success in chronic disease management to occur (Corser & Yin, 2009).
Additional factors that need to be addressed with patients include social support, health literacy,
psychological illness, cultural and language barriers, as well as any other potential obstacles.
The design, planning, and implementation of this evidence-based change in practice
project: introduction of a diabetes management workbook to the patients at the Golden Valley
Health Centers clinic in Modesto, took a total of approximately six months. A gap was
identified, a strategy was planned to fill the gap, research on the evidence was performed, and
the project was structured to help patients to increase self-efficacy with regard to managing their
diabetes.
The project was successful in the sense that there was an increase in the mean