Open Access
Research article
Incorporation of gene-specific variability improves expression
analysis using high-density DNA microarrays
Vikram Budhraja
1,2, Edward Spitznagel
2, W Timothy Schaiff
1and
Yoel Sadovsky*
1Address: 1Department of Obstetrics and Gynecology, and Cell Biology and Physiology, Washington University School of Medicine, St. Louis, MO 63110, USA and 2Department of Mathematics, Washington University, St. Louis, MO 63130, USA
Email: Vikram Budhraja - [email protected]; Edward Spitznagel - [email protected]; W Timothy Schaiff - [email protected]; Yoel Sadovsky* - [email protected]
* Corresponding author
Abstract
Background: The assessment of data reproducibility is essential for application of microarray technology to exploration of biological pathways and disease states. Technical variability in data analysis largely depends on signal intensity. Within that context, the reproducibility of individual probe sets has not been hitherto addressed.
Results: We used an extraordinarily large replicate data set derived from human placental trophoblast to analyze probe-specific contribution to variability of gene expression. We found that signal variability, in addition to being signal-intensity dependant, is probe set-specific. Importantly, we developed a novel method to quantify the contribution of this probe set-specific variability.
Furthermore, we devised a formula that incorporates a priori-computed, replicate-based
information on probe set- and intensity-specific variability in determination of expression changes even without technical replicates.
Conclusion: The strategy of incorporating probe set-specific variability is superior to analysis based on arbitrary fold-change thresholds. We recommend its incorporation to any computation of gene expression changes using high-density DNA microarrays. A Java application implementing our T-score is available at http://www.sadovsky.wustl.edu/tscore.html.
Background
The introduction of microarray technology has enabled investigators to profile the expression of a large number of genes, derived from diverse biological conditions, in a sin-gle experiment. Nevertheless, these experiments are expensive, and the cost is amplified by replication when data reliability is lessened. Technical and biological varia-bility, key determinants of microarray reliavaria-bility, are criti-cal for assessing which genes are differentially expressed. The level of expression of gene products is estimated using
a set of oligonucleotide probes (termed here "probe set"). Within the context of technology-related variability, the reproducibility of individual probes has been insuffi-ciently addressed. [1-6]. Importantly, the impact of probe-specific reliability on data reproducibility, which directly influences experimental design, data analysis and inter-pretation, remains largely unexplored. This problem is further amplified with the use of oligonucleotide microar-rays, which may be more susceptible to probe-specific var-iability than spotted cDNA arrays [7-10].
Published: 28 November 2003
BMC Biology 2003, 1:1
Received: 18 August 2003 Accepted: 28 November 2003
This article is available from: http://www.biomedcentral.com/1741-7007/1/1
Static fold change metrics as an unbiased predictor of dif-ferentially expressed genes depend on the assumption of constant coefficient of variation [11]. Since violation of this assumption is relatively common in microarray data, many methods have been designed to circumvent its requirement [2,12-14]. These methods model variance as a function of intensity, and assume independence of probe sets. Other methods, including popular permuta-tion tests and t-tests that do not explicitly rely on this assumption require replication in order to assess the vari-ability associated with each probe set [15-17]. We pro-posed to use intensity-corrected measures of variance and a correlation test to determine if the assumption of probe set and variance independence is valid. Using a large rep-licate data set we found that signal variability in microar-ray data is in fact probe set-specific, and developed a novel method to integrate a priori-generated, replicate-based information on signal intensity and probe set variability into profiling differential gene expression. The signal intensity as well as probe set information serves as a data-base for future experiments performed without technical replicates. The use of our method enhances the signifi-cance of differences found using reliable probe sets and diminishes the significance of differences found using unreliable probe sets.
Results and Discussion
We have developed a large replicate data set, based on gene expression in a single pool of primary placental tro-phoblast cells. The cells were divided to three groups and exposed to two different peroxisome proliferator activated receptor gamma (PPARγ) ligands, troglitazone or GW7845, or to control, as described in Methods. Prior to hybridization each labeled RNA sample was divided to five aliquots. Each of the five cRNA aliquots was sequen-tially hybridized to identical lot number U95A, U95B, U95C, U95D, and U95E arrays, resulting in expression data for approximately 60 000 genes for each of the three conditions, for a total of 180 000 probe sets, each sampled in five replicates using a total of 75 chips.
The five replicates for each experimental condition i and probe set j yielded a mean ( ) and standard deviation ( ). We formulated an estimate of the standard
devia-tion ( ) as a function of signal intensity using locally
weighted scatter smooth plot (LOESS) local regression (using the PROC LOESS command in SAS). LOESS regres-sion restricts attention to a small window of the data and fits a regression to that data. The window is then shifted and another local regression is calculated. These sequen-tial regressions are combined to yield a LOESS curve [18-20]. Thus the LOESS curve indicates the average / esti-mated standard deviation associated with any given mean intensity, based on the replicate data set of ~180 000 sets
of five replicates. To find a probe-specific effect, we com-pared the observed standard deviation to the estimated standard deviation. We define αi,j as:
where the function f is the LOESS regression, which returns the average standard deviation ( ) for a given
intensity level ( ). By using the ratio of observed stand-ard deviation to estimated standstand-ard deviation, αi,j repre-sents a measure of residual variance for each probe set after correction for intensity.
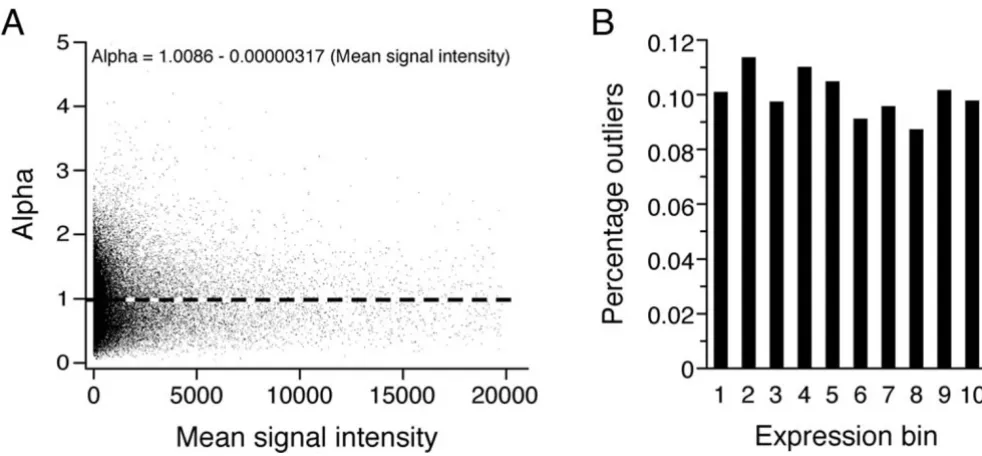
To ensure that αi,j is a useful and correct measure of probe set residual variance and not subject to low-intensity related bias, we initially demonstrated that αi,j is inde-pendent of signal intensity. As shown in Fig. 1A, αi,j was essentially unchanged across the range of signal intensi-ties observed in our experiments. This finding is not unex-pected, because the denominator of αi,j reflects the expected standard deviation for any given intensity. To demonstrate that the variance of αi,j is also independent of signal intensity, we calculated outlier rates by bins of sig-nal intensity. We defined 'alpha outliers' as having an αi,j in the top 10 % of all values, and calculated the outlier rate for bins of increasing expression values. As shown in Fig. 1B, we found no obvious dependence of outlier rate on binned expression level, indicating that the variance of
αi,j is approximately constant over the entire expression range (linear regression test, p = 0.1413).
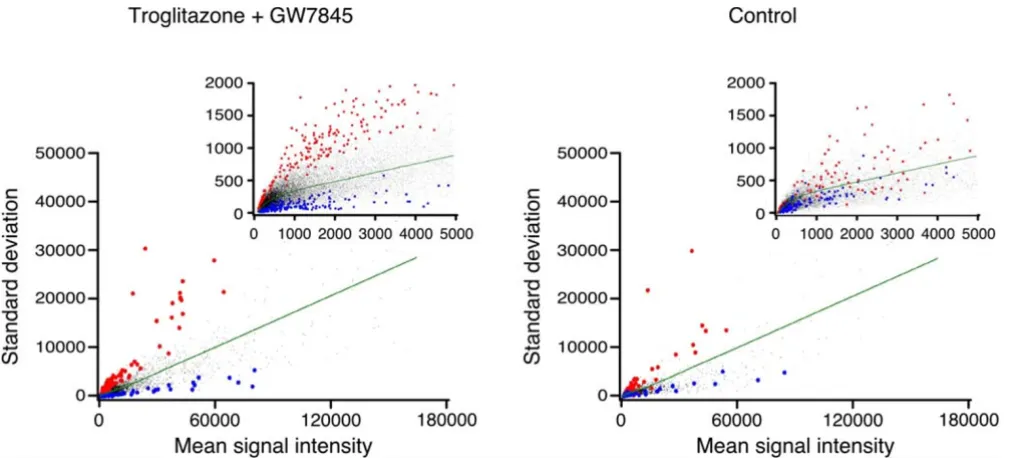
Having shown that αi,j and its variance are independent of intensity, we sought to examine the utility of αi,j as an unbiased predictor of probe set reliability. For that pur-pose, we plotted the standard deviation of each set of five replicates as a function of their mean signal intensity. We next identified the probe sets that exhibited the highest or lowest 5 % of αi,j in two of the three experimental para-digms (cell exposed to troglitazone or GW7845), and examined their ability to predict αi,j in the third paradigm (control). If variance was independent of probe set, the information derived from the first two paradigms would fail to predict a similar pattern for the third paradigm (control) and all noted probe sets would exhibit the expected standard deviation and lie near or on the line αi,j = 1 in the third paradigm. As shown in Fig. 2, data points exhibiting extreme values in the first two paradigms (left panel) successfully predicted a similar value in the third paradigm (right panel). We next sought to further quantify the presence of probe set-specific variability. Under the null hypothesis that all probe sets have a simi-lar inherent variability, α1,j, α2,j, and α3,j are independent
x
i j, sxi j,
ˆ , sx i j 1
( )
= = αi jx i j x x s f x s s
i j i j
i j , , , , , ( ) ^ , ˆ , sx i j
observations of a probe set's intensity-corrected variabil-ity. If αi,j is truly independent of the probe set j, then each observation of αi,j should be independent of the other two and the correlation between α1,j,• α2,j, and α3,j should be zero. If, however, probe sets that have high variance in one paradigm tend to also have high variance in other par-adigms, α1,j, α2,j, and α3,j would exhibit a positive correla-tion. Pearson correlations for αi,j were computed roughly between all three paradigms (i) across all probe sets (j). As shown in Table 1, we found that all three pair-wise corre-lations were significant. It should be noted that the observed raw correlation of approximately 0.3 reflects the fact that αis a sample variance of only five observations, and therefore exhibits high variance by itself. Postulating an ideal case in which αis constant across all paradigms, we created random normal variables based on the varia-bility implied by α, and found that the computed average "ideal correlation" was 0.46 for each of the three pair-wise correlations. As an alternative measure of intensity-inde-pendent variance we used a variance-stabilizing transfor-mation for microarray data [14]. In this approach, variance is again modeled as a function of intensity, but the model is based on normally-distributed error terms. Those error terms were estimated and transformation derived [21], resulting in intensity-independent variance across the full range of expression. The standard deviation
of the transformed data then serves as an alternate meas-ure of intensity-corrected variance. Using the same logic as previously detailed, if all probe sets have equal reliability we expect the standard deviation of the transformed data to exhibit no correlation across the three paradigms. As shown earlier, the standard deviations of the transformed data exhibited strong correlation across the three para-digms (Table 1, right column). Because these standard deviations are corrected for intensity by transformation, the correlation in observed standard deviation is due to the probe set variability. Taken together, our analysis sup-ports the concept that individual probe sets exhibit unique variances, and underscores the need for a custom-made, probe set-specific approach for detection of expres-sion differences.
To incorporate intensity and probe set-specific variability into determination of differentially expressed genes, we introduce novel methodology and an ad hoc t-statistic, called T-score. We have previously shown [12] that for two conditions i = 1 and i = 2 on probe set j, our intensity corrected T-score is derived as follows:
Probe set residual variance (defined as alpha) is independent of signal intensity
Figure 1
Probe set residual variance (defined as alpha) is independent of signal intensity. (A) A linear regression was performed on αi,j as
a function of signal mean. A slope of approximately zero, and no obvious pattern of residuals, indicates that αi,j has corrected
for all intensity related variance. Note that more data points are available at lower intensity signals, as shown in Fig. 4. (B)
Alpha's variance is independent of signal intensity. We defined 'alpha outliers' as having an αi,j in the top 10 %, and calculated the
frequency of 'alpha outliers' in different expression bins, formed by ranking all genes for their signal intensity. The outlier rate remained roughly constant at the expected frequency of 10 % regardless of expression level. The analysis was performed based on the 12 650 probe sets represented in chip U95A, in three paradigms.
2
2 2
1 2
2
1 2
( )
T = x −x = +f z
z x x
j j
j
j
j j
, , , ,
* ( )
Where f(zj) gives the predicted standard deviation value corresponding to the observed mean intensity of x1,j and
x2,j derived from the LOESS regression. This T-score was shown to be independent of signal intensity. To correct for probe set-specific variability we multiplied the pre-dicted standard deviation by (since αi,j is a ratio, we define to be the geometric mean of αi,j across all i par-adigms) and obtained an intensity- and gene-specific
esti-mate for the underlying variance. This makes sense intuitively, since αi,j is the ratio of observed to expected standard deviation, and is the mean of αi,j over the three paradigms. We noted that each of the 60 000 calcu-lations of is based on only 15 observations. Therefore, a few observations for each probe set may inevitably result in falsely deviant values for . Cognizant of this
possi-Probe set-specific variance is preserved across experimental paradigms
Figure 2
Probe set-specific variance is preserved across experimental paradigms. In the left panel, the probe set-specific standard devia-tion (SD) derived from two of the experimental paradigms (cells exposed to troglitazone or GW7845, see Methods) was plot-ted, and probe sets that had high (top 5 %, red) or low (bottom 5 %, blue) variability were identified. In the right panel, the SD of each probe set that was identified in the left panel was determined using the third experimental paradigm (control). Probe
sets with average variability lie along the line αi,j = 1 (green). The main figure depicts the entire data set, and the inset shows the
area up to signal intensity of 5000, magnified for clarity. Using chi-square analysis we confirmed that the SD for the low and high variability probe sets, determined by the left panel, was highly predictive of the respective SD in the right panel (p < 0.0001).
Table 1: Correlation of residual variance values across all three paradigms1.
Correlation of Alpha Standard Deviation (after transformation2)
Pearson Correlation Regression Correlation
Control / GW7845 0.34048 P < 0.0001 0.3609 P < 0.0001 0.56955 P < 0.0001
Control / Troglitazone 0.29042 P < 0.0001 0.3308 P < 0.0001 0.55726 P < 0.0001 GW7845 / Troglitazone 0.30826 P < 0.0001 0.3313 P < 0.0001 0.55505 P < 0.0001
1 See Additional File 1, which displays the ability of alpha from one paradigm to predict alpha from another paradigm. 2 Transformation performed as described in the text following Durbin et al. [14].
αi,j
αi,j
αi,j
αi,j
bility, we diminished the effect of extreme outliers of
by using in its place. This function has the conven-ient properties of being symmetric with respect to the geo-metric mean and bringing extreme outliers closer to the null effect of one. The combined T-score becomes:
While issues of normality and degrees of freedom con-found the distribution of T-score, we can simplify our analysis by using the T-score as a ranking statistic to prop-erly order genes for their statistical significance. An empir-ical null distribution of T-score, generated using replicate RNA samples, is presented in Fig. 3. In addition, a set of p-values derived from this replicate set and associated with the T-Score values is available at http:// www.sadovsky.wustl.edu/tscore.html. Since the T-score is intensity and probe set independent, the null distribution applies to any gene expression change using this platform.
The replicate-based a priori generation of creates a database of probe set-specific variability coefficients that can be used for computation of T-score even from data derived without replicates, as conducted by most research-ers. Instead of estimating variance with costly replicates, we contend that similar results can be obtained using esti-mates of variance generated from the intensity and probe set database we have created. Nevertheless, this
simplification is not necessary. If an experiment has repli-cates the sample sizes can be carried through for their effect on the distribution of the mean. The T-score becomes:
and n1 and n2 represent the number of observations in par-adigm 1 and 2, respectively. Here, we would disregard the observed variances and use the intensity and probe relia-bility index to create an estimate of the variance. A Baye-sian approach could also be used with arbitrary degrees of freedom to incorporate the observed sample variances.
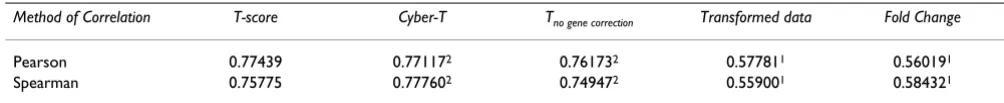
We verified that the T-score is superior to fold-change methodology at identifying differentially expressed genes. For this purpose, we randomly selected 52 probe sets from the gene population in the U95A set in which there was an agreement (26 sets) or disagreement (26 sets) between Affymetrix Fold Change and T-score results across different paradigms. We used real-time quantitative PCR to assess the expression change of these 52 genes, and defined these results as our "gold standard". We then cor-related these "gold standard" results with the expression changes as predicted using several methods. These meth-ods included Fold Change, difference after transforma-tion, T without (correcting solely for intensity, eq. 3), T-score (correcting for intensity and probe set-specific var-iability, eq. 4), and Cyber-T, a t-test based method that combines the empirical variance of a replicate set with the local background of intensity-dependent variance[15]. After variance-stabilizing transformation, the biggest absolute difference in the transformed data should repre-sent the most significant change in gene expression. Using the Pearson Correlation test we determined the strength of association of each of these methods with the change in expression level of these 52 genes, as determined by quan-titative RT-PCR. The results are shown in Table 2. Clearly, the t-test based methods are superior to both Affymetrix Fold Change and absolute difference using transformed data. The Spearman Rank Correlation, which disregards data distribution and solely uses rank orders, exhibited similar results (Table 2). To determine the significance of the correlation differences we formulated a permutation test designed to define the null distribution of the correla-tions. Under the null hypothesis (two prediction methods are equivalent) each value was equally likely to appear under either method. The null distribution is therefore composed of correlations under which predictive values are permuted within each probe set j. The difference in either Pearson or Spearman Correlation coefficients between T-score and Fold-Change was found to be signif-icant at p < 0.0002. T-score also performed better than the
The null distribution of T-score, generated empirically using replicate RNA samples
Figure 3
The null distribution of T-score, generated empirically using replicate RNA samples. Positive values represent up-regu-lated transcripts, and negative values represent
down-regu-lated transcripts. The y-axis represents the frequency of each
T-score value. The degree of deviation from T-score of zero represents the likelihood of random change in transcript expression.
αi,j
αi,j
3
2 2
1 2
2
1 2
( )
= − =
+
∗
T x x
f z
z x x
j j
j
j
j j
i j
, , , ,
* ( )
,
,
α
where
αi,j
4 1 2
1 1
2
1 2
1 2
2
( )
= − = ++ ∗ ∗
T x x z x x
n
j
j j
n n f z
j
j j
j j
, ,
( ) [ ( )]
, ,
.,
,
α
where
1 1+n2
difference after transformation (p < 0.0002). The differ-ence in correlations between T-score, Cyber-T [15], and T (without probe set correction) was not statistically significant.
Conclusions
Generation of replicate data in microarray experiments can be utilized to assess variability, and consequently enhance data consistency [22]. Whereas our approach to identify bias related to intensity-dependent variance is consistent with that of others [1,2,13,15,23,24], we have also shown that consideration of probe set-specific vari-ance is critical, given that the often-used assumption of probe set independence is false. Practically, we demon-strated that small expression differences detected by a more reliable probe set might be more important than larger expression differences detected by a less reliable probe set. Therefore, our analysis indicates that an opti-mal method for determining differentially expressed genes must account and correct for reliability of each indi-vidual probe set. While previous efforts have used replica-tion to distinguish non-funcreplica-tional, or highly unreliable probe sets for elimination [1-5], none has incorporated probe set-specific reliability into expression change statis-tics. Our methodology is the first that allows independent use of previously obtained information on probe set reliability in subsequent experiments. Therefore, infer-ence from prior estimates of probe set-specific variances into new experiments could not have been utilized using previously published approaches.
We were reassured by the fact that the correlation of our T-score method was similar to that of the t-test based Cyber-T [15]. However, while exhibiting a similar performance, Cyber-T does not incorporate an a priori-defined gene correction factor, and relies on replication for estimation of variance. In contrast, our T-score approach integrates previously defined probe set-specific variance (via our database of αj), defined by means of additional experi-mental paradigms (e.g., other ligands) for the same probe sets. Thus T-score, which independently accounts for intensity and probe set variances, may be utilized in array experiments even when performed without replication. Nevertheless, when adequate replicates are available, t-test is a suitable approach. It is also important to note that
our analysis exclusively focuses on technical variability. While we demonstrate that a previously defined probe-specific variance can substitute for technical replicates, biological replicates are paramount to enhance accuracy of microarray-based expression analysis. In addition, the p-values associated with our empirically derived T-score do not include a correction for multiple comparisons, which should be accounted for when comparisons of expression level among thousands of genes are made [25,26].
Another fundamental strength of our approach is the novel analysis of an extraordinarily large data set. Although our downstream analysis demonstrated the superiority of our methodology over an arbitrary cut-off approach, our results are limited by the fact that a fraction of our analyzed gene pool was expressed at a low level across all three paradigms. This might have led to an erro-neous estimation of the specific variability of some probe sets. It should also be noted that our analysis is based on Affymetrix U95A-E gene-chip microarrays. Affymetrix has recently generated a new chip set (U133). While this may represent a technological advancement, the principles underlying our novel methodology are not addressed by the new chip-set. Whereas T-score values reported here are applicable only to the U95A-E set, the basis and principles underlying our analysis are applicable to any oligonucle-otide microarray. We not only provide the first definitive proof that probe set-specific variability exists, but also offer the first generic methodology designed to utilize this information without performing costly replicate experi-ments. Probe reliability information based on cRNA tar-gets that are expressed at high and low levels could be generated by biotechnology companies specializing in microarrays. This information, provided in conjunction with commonly available changes in p-value and determi-nation of transcript presence, may serve to correct for tech-nical variability in array experiments performed without replication.
Methods
We have developed a large replicate data set, based on gene expression in a single pool of primary trophoblast cells. Procurement of the placentas used in this study was approved by the human studies committee at Washington Table 2: Correlation of predictive statistics with gene expression changes, determined by real-time quantitative RT-PCR.
Method of Correlation T-score Cyber-T Tno gene correction Transformed data Fold Change
Pearson 0.77439 0.771172 0.761732 0.577811 0.560191
Spearman 0.75775 0.777602 0.749472 0.559001 0.584321
University School of Medicine, St. Louis, Missouri, USA. Primary human trophoblasts were prepared from three normal term human placentas as previously described [27] with previously published modifications [28], and cultured in 10 cm plates as previously detailed by our lab [28]. Four hours after plating, the medium was replaced with fresh medium supplemented by the PPARγ ligands troglitazone (10 µM) (Biomol, Plymouth Meeting, PA) or GW7845 (1 µM, a gift from GlaxoWellcome), or by dimethylsulfoxide (DMSO) vehicle control. Fresh media and ligands were added after 24 h in culture. After 48 h the cells were collected for RNA. Total RNA was isolated using Tri-reagent (MRC, Cincinnati, OH, USA) and purified using RNeasy (Qiagen, Valencia, CA, USA). RNA samples (30 µg) from three placentas were mixed, and the mixture was used for double stranded cDNA synthesis using Superscript Choice system (InVitrogen Life Technologies, Carlsbad, CA, USA) and a T7T21 oligonucleotide primer (GenSet, La Jolla, CA, USA). Biotin-labeled RNA was syn-thesized by in vitro transcription using Enzo Bioarray RNA labeling kit (Enzo Diagnostics, Farmingdale, NY, USA). The RNA was fragmented and divided into five identical aliquots (15 µg of cRNA per aliquot). Each of the five cRNA aliquots was added to hybridization cocktail and sequentially hybridized to identical lot number U95A, U95B, U95C, U95D, and U95E arrays. All arrays were hybridized, washed, stained, and scanned using standard Affymetrix protocols. Together, we used identical cRNA samples to probe the expression of approximately 60 000 genes for each of the three conditions, for a total of 180 000 probe sets, each sampled in five replicates using a total of 75 chips.
Standard Affymetrix protocols using control oligonucle-otide B2 were used for proper scanning and grid align-ment, and samples were pre-tested using a control cRNA mix from Escherichia coli bioB, bioC, bioD, and P1 cre recombinase, used for monitoring of hybridization, wash-ing, and staining conditions as well as reference samples for normalizing between experiments. Immediately after hybridization the chips were placed in the Affymetrix GeneChip Fluidics Station 400 and sequentially processed for low stringency wash, followed by high stringency wash, streptavidin / phycoerythrin stain, repeat low strin-gency wash, anti-streptavidin antibody stain, a second streptavidin / phycoerythrin stain and a final low strin-gency wash. After washing and staining each chip was placed in the Affymetrix Gene-Chip array scanner for image capture and conversion to numerical output using the Microarray Analysis Suite version 5.0. Comparison between chips using the Affymetrix protocol was per-formed using 'baseline chip' intensity values, normalized to average signal intensity.
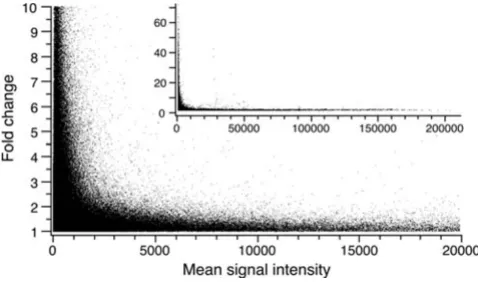
Using this information we recently determined that tech-nical variability in our data set depends on signal intensity [12]. Ignoring this factor results in bias of expression changes toward genes with low signal intensity (Fig. 4).
Authors' contributions
VB conceived the study's idea, generated the methods, cre-ated the mathematical models, wrote and programmed the T-score software, created the web tool, performed the PCR experiments and wrote the manuscript, all as part of his undergraduate training in YS's lab. ES oversaw the con-ception and creation of the mathematical models, and reviewed the validity of the approach and T-score. WTS carried out the experiments related to placental cell culture and sample processing, and reviewed the data. YS supervised the entire project and coordinated the team's efforts. He conceived the idea and generated the methods with VB, reviewed the development of the mathematical model and supervised all aspects of the experimental work, data assembly and manuscript generation. All authors read and approved the final manuscript.
Additional material
Null distribution of fold-changes among all replicates
Figure 4
Null distribution of fold-changes among all replicates. We calculated pair-wise fold-changes among five signal replicates (a total of 10 comparisons) for 12 650 probe sets (Chip U95A only) in three paradigms, for a total 378 750 changes. Each point in the graph represents an observed fold-change and mean signal intensity for two identical samples of mRNA. The inset depicts all data points, magnified in the main figure to demonstrate that higher fold-change values are found at lower expression levels, even when the underlying expression is unchanged. This supports the notion that statis-tical significance of a fold-change depends on signal intensity.
Additional File 1
The regressions of alpha for the three different pair-wise comparisons, pre-sented in Table 1, displaying the ability of alpha from one paradigm to predict alpha from another paradigm.
Click here for file
Publish with BioMed Central and every scientist can read your work free of charge "BioMed Central will be the most significant development for disseminating the results of biomedical researc h in our lifetime."
Sir Paul Nurse, Cancer Research UK
Your research papers will be:
available free of charge to the entire biomedical community peer reviewed and published immediately upon acceptance cited in PubMed and archived on PubMed Central yours — you keep the copyright
Submit your manuscript here:
http://www.biomedcentral.com/info/publishing_adv.asp
BioMedcentral
Acknowledgements
This research was supported by NIH R01 ES11597-01 and the Siteman Cancer Center GeneChip Core Facility, Washington University School of Medicine, St Louis, MO, USA. We thank Elena Sadovsky and Lori Rideout for technical assistance. We thank Tim Willson from GlaxoWellcome for generously providing GW7845. We also thank Jeff Milbrandt and Mark Watson (both from Washington University) for discussions.
References
1. Tusher VG, Tibshirani R, Chu G: Significance analysis of micro-arrays applied to the ionizing radiation response.Proc Natl Acad Sci USA 2001, 98:5116-5121.
2. Yang YH, Dudoit S, Luu P, Lin DM, Peng V, Ngai J, Speed TP: Nor-malization for cDNA microarray data: a robust composite method addressing single and multiple slide systematic variation.Nucleic Acids Res 2002, 30:1-10.
3. Tseng GC, Oh MK, Rohlin L, Liao JC, Wong WH: Issues in cDNA microarray analysis: quality filtering, channel normalization, models of variations and assessment of gene effects.Nucleic Acids Res 2001, 29:2549-2557.
4. Li C, Wong WH: Model-based analysis of oligonucleotide arrays: expression index computation and outlier detection. Proc Natl Acad Sci USA 2001, 98:31-36.
5. Wolfinger RD, Gibson G, Wolfinger ED, Bennett L, Hamadeh H, Bushel P, Afshari C, Paules RS: Assessing gene significance from cDNA microarray expression data via mixed models.J Com-put Biol 2001, 8:625-637.
6. Irizarry RA, Bolstad BM, Collin F, Cope LM, Hobbs B, Speed TP:
Summaries of Affymetrix GeneChip probe level data.Nucleic Acids Res 2003, 31:e15.
7. Duggan DJ, Bittner M, Chen Y, Meltzer P, Trent JM: Expression pro-filing using cDNA microarrays.Nat Genet 1999, 21:10-14. 8. Kerr MK, Martin M, Churchill GA: Analysis of variance for gene
expression microarray data.J Comput Biol 2000, 7:819-837. 9. Satagopan JM, Panageas KS: A statistical perspective on gene
expression data analysis.Stat Med 2003, 22:481-499.
10. Churchill GA: Fundamentals of experimental design for cDNA microarrays.Nat Genet 2002, 32 Suppl:490-495.
11. Chen Y, Dougherty ER, Bittner ML: Ratio-based decisions and the quantitative analysis of cDNAmicroarray images. J Biomed Optics 1997, 2:364-374.
12. Mariani TJ, Budhraja V, Mecham BH, Gu CC, Watson MA, Sadovsky Y: A variable fold change threshold determines significance for expression microarrays.FASEB J 2003, 17:321-323. 13. Tsien CL, Libermann TA, Gu X, Kohane IS: On reporting fold
differences.Pac Symp Biocomput 2001:496-507.
14. Durbin BP, Hardin JS, Hawkins DM, Rocke DM: A variance-stabi-lizing transformation for gene expression microarray data. Bioinformatics 2002, 18:S105-110.
15. Baldi P, Long AD: A Bayesian framework for the analysis of microarray expression data: regularized t -test and statisti-cal inferences of gene changes.Bioinformatics 2001, 17:509-519. 16. Efron B, Tibshirani R, Storey JD, Tusher VG: Empirical Bayes
anal-ysis of a microarray experiment.J Am Statistical Assoc 2001,
96:1151-1160.
17. Cui X, Churchill GA: Statistical tests for differential expression in cDNA microarray experiments.Genome Biol 2003, 4:210. 18. Cleveland W, Devlin S: Locally-weighted regression: an
approach to regression analysis by local fitting.J Am Statistical Assoc 1988, 83:596-610.
19. Colantuoni C, Henry G, Zeger S, Pevsner J: Local mean normali-zation of microarray element signal intensities across an array surface: quality control and correction of spatially sys-tematic artifacts.Biotechniques 2002, 32:1316-1320.
20. Edwards D: Non-linear normalization and background correc-tion in one-channel cDNA microarray studies.Bioinformatics
2003, 19:825-833.
21. Rocke DM, Durbin BP: A model for measurement error for gene expression arrays.J Comput Biol 2001, 8:557-569.
22. Lee ML, Kuo FC, Whitmore GA, Sklar J: Importance of replica-tion in microarray gene expression studies: statistical meth-ods and evidence from repetitive cDNA hybridizations.Proc Natl Acad Sci USA 2000, 97:9834-9839.
23. Newton MA, Kendziorski CM, Richmond CS, Blattner FR, Tsui KW:
On differential variability of expression ratios: improving sta-tistical inference about gene expression changes from microarray data.J Comput Biol 2001, 8:37-52.
24. Ideker T, Thorsson V, Siegel AF, Hood LE: Testing for differen-tially-expressed genes by maximum-likelihood analysis of microarray data.J Comput Biol 2000, 7:805-817.
25. Westfall PH, Young SS: p-value adjustment for multiple tests in multivariate binomial models. J Am Statistical Assoc 1989,
84:780-786.
26. Reiner A, Yekutieli D, Benjamini Y: Identifying differentially expressed genes using false discovery rate controlling procedures.Bioinformatics 2003, 19:368-375.
27. Kliman HJ, Nestler JE, Sermasi E, Sanger JM, Strauss JM: Purification, characterization and in vitro differentiation of cytotrophob-lasts from human term placentae. Endocrinology 1986,
118:1567-1582.
28. Schaiff WT, Carlson MG, Smith SD, Levy R, Nelson DM, Sadovsky Y: