University of New Orleans University of New Orleans
ScholarWorks@UNO
ScholarWorks@UNO
University of New Orleans Theses and
Dissertations Dissertations and Theses
Fall 12-16-2016
Financial Crisis, Inclusion and Economic Development in the US
Financial Crisis, Inclusion and Economic Development in the US
and OIC Countries
and OIC Countries
Shadiya T. Hossain
University of New Orleans, [email protected]
Follow this and additional works at: https://scholarworks.uno.edu/td
Part of the Finance Commons, Growth and Development Commons, and the International Economics Commons
Recommended Citation Recommended Citation
Hossain, Shadiya T., "Financial Crisis, Inclusion and Economic Development in the US and OIC Countries" (2016). University of New Orleans Theses and Dissertations. 2274.
https://scholarworks.uno.edu/td/2274
This Dissertation is protected by copyright and/or related rights. It has been brought to you by ScholarWorks@UNO with permission from the rights-holder(s). You are free to use this Dissertation in any way that is permitted by the copyright and related rights legislation that applies to your use. For other uses you need to obtain permission from the rights-holder(s) directly, unless additional rights are indicated by a Creative Commons license in the record and/ or on the work itself.
Financial Crisis, Inclusion and Economic Development in the US and OIC Member Countries
A Dissertation
Submitted to the Graduate Faculty of the University of New Orleans in partial fulfillment of the requirements for the degree of
Doctor of Philosophy in
Financial Economics
by
Shadiya Hossain
B.S. George Mason Univerisity, 2010 M.S. University of New Orleans, 2015
ii
Dedication
iii
Acknowledgement
iv
Table of Contents
Abstract ...v
Chapter 1: Financial Inclusion and Economic Development in OIC Countries ...1
1. Introduction ...1
2. Literature Review...5
3. Data ...8
4. Methodology and Empirical Findings for Economic Development Analysis ...9
4.1 Proxy measures for financial inclusion and economic development ...9
4.2 Descriptive statistics ...10
4.3 Cross Country Regression with Instrumental Variables ...13
4.4 Dynamic Panel Estimation of Transformed data ...15
4.5 Dynamic Panel Estimation of non-Transformed Data ...25
4.6 Panel VAR methodology ...34
4.7 Panel Granger causality test ...39
5. Methodology and Empirical Findings for Poverty Analysis ...42
5.1 Proxy measures for financial inclusion and poverty ...42
5.2 Methodology for Poverty Alleviation ...44
6. Conclusion ...46
References ...49
Chapter 2: Asymmetric Market Reactions to the 2007-08 Financial Crisis: From Wall Street to Main Street ...51
1. Introduction ...51
2. Literature Review...56
3. Data and Methodology ...59
3.1The Data ...59
3.2Event abnormal return estimation methodology ...60
4. Crisis events and returns ...62
5. Real sector and financial portfolio event interval abnormal returns ...67
5.1 Event interval abnormal returns for financial and real sector portfolios ...67
5.2 Firm size and event interval abnormal returns ...72
5.3 Finance sub-industry portfolio abnormal event interval returns ...78
6. 6. Event Portfolio Abnormal Returns ...85
7. Event Day Portfolio Abnormal Returns ...87
7.1 Real sector, financial and event firm abnormal event day returns ...88
7.2 Financial sector sub-industry event day abnormal returns ...94
8. Conclusion ...101
References ... 104
v
Abstract
The following dissertation contains two distinct empirical essays which contribute to the overall field of Financial Economics. Chapter 1, entitled “Financial Inclusion and Economic Development in OIC Member Countries,” examines whether the presence of Islamic finance promotes development and alleviates poverty. To do so, we estimate the influence of financial inclusion variables on development and poverty variables for OIC countries. Using data from the World Bank, we use dynamic panel analysis using methodology similar to Beck et al (2000) to study the effects of financial inclusion on economic development and use simple cross-sectional analysis similar to Beck et al (2004) to study the effects on poverty alleviation. We find that the countries with Islamic finance tend to outperform the rest of the world. We believe that the ability of financial institutions offering Shari’a compliant services to bring otherwise excluded people under the financial system plays a major role in increased development and reduced poverty in those countries. The results support our view that financial inclusion is causing development. Chapter 2 entitled, “Asymmetric Market Reactions to the 2007-08 Financial Crisis: From Wall Street to Main Street,” examines the impact of significant news events during the 2007 – 2008 financial crisis on the abnormal stock returns for portfolios of financial and real sector firms. We recognize 17 significant news events from 2007 and 2008 and create equity portfolios using daily CRSP data from January 1, 2006 to December 31, 2009. We estimate event announcement interval abnormal returns in the context of an asset pricing model similar to Fama and French (1993) and Carhart (1997). We document significant negative abnormal returns for the portfolio of non-financial firms, and the smallest firms exhibit the largest negative abnormal returns, an indication of a significant spillover of financial market news to real sector stock returns. Smaller financial firms also exhibit negative abnormal event returns, and these results are driven by broker-dealer, depository, holding-investment, and real estate firms. The results provide new evidence regarding the incorporation of news events into asset prices during financial crises.
1
Chapter 1: Financial Inclusion and Economic Development in OIC Member Countries
1. Introduction
The financial system offers savings, credit, and risk management to individuals in a country. Inclusive financial services are more beneficial for poorer individuals increasing their ability to borrow and save money for education, investing in a business, making a large purchase, or health emergencies. An account provides a reliable place to save or to receive payments from family members, employers or the government. Without an account individuals have to rely on their own limited earnings and savings, which may contribute to persistent income inequality and slower economic growth. This topic has become a growing interest for researchers and policy makers. Involuntary financial exclusion can be problematic and needs policy action to remedy when there are individuals whose marginal benefit from using financial services are greater than the marginal costs, but are excluded by barriers. Evidence from international research efforts has revealed that there is a relationship between levels of financial exclusion and economic growth or poverty. Having an account increases savings, female empowerment, consumption, and investment of entrepreneurs. However, people in countries with low levels of financial inclusion struggle with financial problems due to the unavailability of financial services. Researchers and policymakers use financial inclusion strategies to increase the number of individuals, households and small and medium size enterprises that are now either fully or partially excluded from financial industry into the financial system. As people become more financially included, they gain power to use financial services to improve their life and that of their families.
2
plays a significant role in increasing the level of financial inclusion of Islamic countries. Increasing access to formal financial services in these countries will give the adults more ways to save and invest, which may help with economic growth in that country. According to Naceur, Bajaras and Massara (2015) only 27 percent of OIC households have an account at a formal institution, which compared to the rest of the world at 55 percent, is very low. Voluntary exclusion due to religious reason may in large part explain this disparity and increasing Islamic finance in this region may lead to increased economic growth and help alleviate poverty.
The results of this research into the financial inclusion in the members of the Organization of Islamic Cooperation (OIC) have importance for multiple reasons. First, researching Islamic countries will provide useful information about the relationship between financial inclusion and economic growth as well as poverty reduction. The demand for Shari’a compliant financial services is expected to increase and this information will be useful to provide desired financial products. Secondly, Shari’a compliant financial products have relatively low speculative
characteristics compared to conventional financial services, and therefore has attracted a lot of attention in recent years, and these products have sufficient development potential. Poverty is an ongoing problem across many countries that are members of the OIC and studying variables that affect financial inclusion may help policymakers include more people in the financial system that are being excluded which may help reduce poverty.
3
literature (see among other Beck, Levine and Loayza (2000)). We contribute to the literature by presenting proof that Islamic finance leaves positive impact on an economy. We also use a few superior econometric techniques, which have not been used in this field of study so far.
Our major questions for the OIC countries are: does financial inclusion by Shari'a-complaint financial systems have a stronger impact on economic growth and does it also reduce poverty more effectively? This study examines the influence of financial inclusion upon the diffusion of Shari'a-complaint financial systems on economic development by estimating the dynamic relationship between financial inclusion and economic growth as well as poverty. We compare the effects of financial inclusion on development between countries with Islamic finance and countries without Islamic finance examining the dynamic relationship between financial inclusion and economic development and poverty variables using the panel data. For that purpose we divide our sample in four categories: the whole world, OIC countries, OIC countries with Islamic finance, and OIC countries without Islamic finance (following Naceur, Barajas, and Massara (2015)).
4
analysis. We find that one of our proxy variables for financial inclusion, private credit growth, has a positive and significant relationship with economic growth. The effect is higher for OIC countries and in some cases for OIC countries offering Islamic finance. Usually, small businesses are able to generate more value per unit of investment. So, we interpret the higher numbers for OIC countries as inclusion of small investors and households who were able to get small amounts of credit. This implies that Islamic banks are extending private credit to otherwise excluded (voluntary, or involuntary) people in OIC countries helping the economy grow. However, our other financial inclusion proxies do not produce significant results. Third, we analyze panel Granger causality tests in order to examine the direction of the variables, thus we can observe whether there is a causal relationship between financial inclusion, economic development and poverty in OIC countries. The panel Granger causality tests help us see that there are several variables that cause each other, for example we find that financial development influences all the inclusion variables. However, the relationship is not one-way. We also see that financial deposits cause development. The positive impact is more pronounced for the countries with Islamic finance than the whole sample. Researching how different factors affect financial inclusion in OIC countries we can expand the financial system to include those left out. Policy makers can see what reasons people give as to why they do not have accounts, or how they can change some policies to reduce costs to individuals, so that they can save more and in turn reduce poverty and stimulate economic growth.
5
2. Literature Review
Study Sample Major Objectives Findings
Standing Committee for Economic and Commercial
Cooperation of the Organization of Islamic Cooperation (COMEC, 2014)
Explaining demand side and supply side factors to financial exclusion.
Demand side reasons include the lack of financial literacy and inadequate client protection regulations. Religious constraints and cultural characteristics are other reasons of voluntary financial exclusion.
Supply side reasons include the suppliers’ service quality, price and accessibility.
Demirguc-Kunt and Klapper (2012, 2013)
World Financial Index Database (Findex), they survey entire population in 2011.
Looking for variables that affect financial inclusion around the world.
They find that 50 percent of the world’s adults have an account, and that account penetration differs largely between high-income and developing countries. Their results indicate that national-level financial development, measured by domestic credit to private sector as a percentage of GDP, is also significantly associated with account penetration.
Allen et al. (2012) They look at the individual and country characteristics associated with the use of formal accounts and what policies are effective among those most likely to be excluded: the poor and rural residents.
6
Demirguc-Kunt and Levine (2009)
This paper criticizes financial and economic theories of financial inequality.
Finance plays a crucial role in most theories of persistent inequality. Therefore, economic theory provides a rich set of predictions concerning both the impact of finance on inequality and about the relevant mechanisms. Most of the previous empirical research suggests that improvements in financial contracts, markets, and intermediaries expand economic opportunities and reduce inequality. Yet, there is a shortage of theoretical and empirical research on the impact of formal financial sector policies, such as bank regulations and securities law, on persistent inequality.
Demirguc-Kunt et al (2013a
The authors restrict their data to include 65,000 adults in 64 countries.
This study looks at Islamic finance and its influence on financial inclusion.
They find that Muslims are significantly less likely than non-Muslims to own a formal account or save at a formal financial institution. However they do not find any evidence that Muslims are less likely than non-Muslims to report formal or informal borrowing. They then look more closely at North African and Middle Eastern countries and find that there is little use of Shari’a-compliant banking products even though they find evidence of a hypothetical preference for Shari’a-compliant products among the respondents despite higher costs.
Demirguc-Kunt et al (2013b)
World Financial Index Database (2011)
This study looks at the gender differences in the use of financial services in developing countries.
7
Anson et al (2013) Global Findex includes data from 60 countries where postal accounts are offered.
They study the role of the post office in financial inclusion.
The paper finds that post offices are relatively more likely than traditional financial institutions to provide accounts to individuals who are most likely to be from financially vulnerable groups, such as the poor, less educated, and those out of the labor force. They also find that post offices can boost account ownership by acting as cash-merchants for transactional financial services, such as electronic government and remittance payments, and that partnerships between the post office and other financial institutions coincide with a higher bank account penetration.
Hannig and Jansen (2010)
They suggest that greater financial inclusion may
enhance financial stability.
The recent financial crisis has shown that financial innovation can have devastating systemic impacts. They state that low-income savers and borrowers tend to maintain solid financial behavior throughout financial crises, keeping deposits in a safe place and paying back their loans. The potential costs of financial inclusion are compensated for by important dynamic benefits that enhance financial stability over time through a deeper and more diversified financial system.
Naceur, Bajaras and Massara (2015)
This paper looks at the relationship between the development of Islamic banking and financial inclusion.
8
We expand on previous literature to include how financial inclusion by Shari’a compliant
financial systems have a greater impact on economic growth in OIC countries, and how it may help alleviate poverty. Many individuals in these areas choose not to use conventional banking in these areas due to religious reason and this study intends to show that there is a need to expand Islamic banking in these areas.
3. Data
This study will explore the relationship between the financial inclusion, economic growth and poverty of OIC countries since they have higher levels of voluntary financial exclusion relative to other countries. We will examine the relationship between economic growth and financial inclusion, which is growing proportionally with the development of Islamic financial systems. We will also examine the relationship between poverty and financial inclusion. The OIC consists of 57 countries. We use similar methodology to Hassan et al (2014) and Beck et al (2000) to explore this relationship.
Since OIC countries are located in a variety of geographical regions, such as Europe, the Middle East, Asia, and Africa, there must be many regional differences so we will divide the data by geographical regions. We will use the World Bank regional classifications to do so which will allow us to consider both the heterogeneity across regions and the homogeneity of similar geographic regions.
9
4. Methodology and Empirical Findings for Economic Development Analysis
4.1 Proxy measures for financial inclusion and economic development
Financial inclusion by definition is the measure of how many individuals and firms use financial services, the key factors to measure financial inclusion are financial service usage statistics such as accounts penetration, savings, credit, insurance, etc. (Demirguc-Kunt and Klapper, 2012). Previous studies of financial inclusion have used the number of accounts at formal financial institutions, the number of loans from a formal institution, the use of ATMs, credit and debit card usage, etc. as proxy variables for financial inclusion. We will use Gross Domestic Product (GDP) growth rate, which is transformed with the log differencing of GDP (currently in USD)1 as a proxy variable for economic growth. We will use the level of income as a proxy for poverty. We also utilize the following variables in Table A to measure key factors of financial inclusion:
Table A
Economic Variables that Affect Financial Inclusion
Definition
Private credit by deposit money banks to GDP (%)
Private credit by deposit money banks and other financial institutions to GDP, calculated using the following deflation method: {(0.5)*[Ft/Pet +
Ft-1/Pet-1]}/[GDPt/Pat] where F is credit to the
private sector, Pe is end-of period CPI, and Pa is
average annual CPI.
Financial system deposits to GDP (%) Demand, time and saving deposits in deposit money banks and other financial institutions as a share of GDP, calculated using the following deflation method: {(0.5: {(0.5)*[Ft/Pet + Ft-1/P et-1]}/[GDPt/Pat] where F is demand and time and
saving deposits, Pe is end-of period CPI, and Pa
is average annual CPI.
1𝐺𝐷𝑃𝐺
10
Life insurance premium volume to GDP (%) +Nonlife insurance premium volume to GDP (%)
Ratio of life insurance premium volume to GDP (Premium volume is the insurer's direct premiums earned (if Property/Casualty) or received (if Life/Health) during the previous calendar year) + ratio of non-life insurance premium volume to GDP (Premium volume is the insurer's direct premiums earned (if Property/Casualty) or received (if Life/Health) during the previous calendar year).
In this study we are trying to evaluate the impact of financial intermediaries (inclusion) on growth and the sources of growth. In order to evaluate the impact we look for an indicator of the ability of financial intermediaries to research and identify profitable projects, monitor and control managers, ease risk management, and enable capital mobilization. We do not have a direct measure of these financial services. Therefore, we must use proxies for financial inclusion. Following Beck et al (2000) the primary measure of financial inclusion we use is a variable called Private Credit, which equals the value of credits by financial intermediaries to the private sector divided by GDP. This variable excludes credits issued by central banks and development banks, and only includes private credits issued deposit money banks and other financial intermediaries. We also use financial system deposits, and we add the life and non-life insurance premiums for a total insurance premium as a last measure of financial inclusion. This data is already deflated in the World Bank database as stated in the variable description and therefore should not produce misleading measures of financial inclusion, especially in highly inflationary environments.
4.2 Descriptive statistics
11
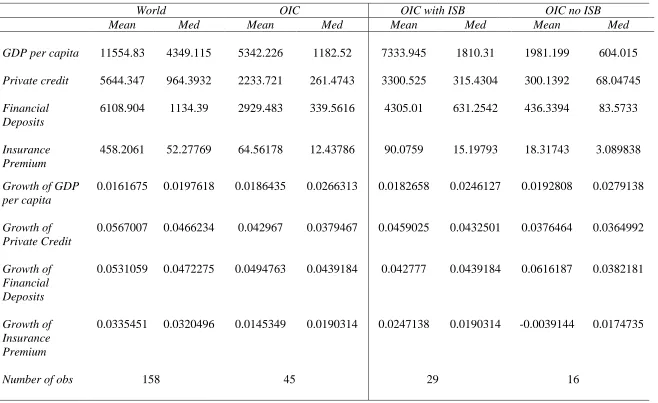
subgroups depending on their use of Islamic finance. At first we look at the summary statistics. We only have 45 observations from OIC countries and the sample gets smaller as we subdivide. We construct a panel dataset with data averaged over each of the six 3-year periods between 1990 and 2013.
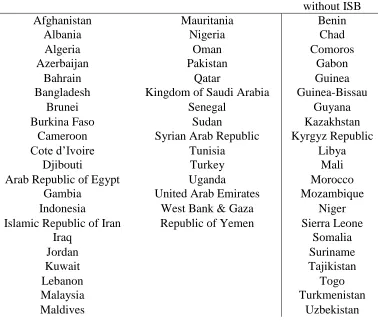
Table 1.1: Country Groups
OIC Countries with Islamic Banking (ISB) OIC Countries without ISB
Afghanistan Mauritania Benin
Albania Nigeria Chad
Algeria Oman Comoros
Azerbaijan Pakistan Gabon
Bahrain Qatar Guinea
Bangladesh Kingdom of Saudi Arabia Guinea-Bissau
Brunei Senegal Guyana
Burkina Faso Sudan Kazakhstan
Cameroon Syrian Arab Republic Kyrgyz Republic
Cote d’Ivoire Tunisia Libya
Djibouti Turkey Mali
Arab Republic of Egypt Uganda Morocco
Gambia United Arab Emirates Mozambique Indonesia West Bank & Gaza Niger Islamic Republic of Iran Republic of Yemen Sierra Leone
Iraq Somalia
Jordan Suriname
Kuwait Tajikistan
Lebanon Togo
Malaysia Turkmenistan
Maldives Uzbekistan
12
Table 1.2: Summary Statistics
This table shows the summary statistics
World OIC OIC with ISB OIC no ISB
Mean Med Mean Med Mean Med Mean Med
GDP per capita 11554.83 4349.115 5342.226 1182.52 7333.945 1810.31 1981.199 604.015 Private credit 5644.347 964.3932 2233.721 261.4743 3300.525 315.4304 300.1392 68.04745 Financial
Deposits
6108.904 1134.39 2929.483 339.5616 4305.01 631.2542 436.3394 83.5733
Insurance Premium
458.2061 52.27769 64.56178 12.43786 90.0759 15.19793 18.31743 3.089838
Growth of GDP per capita
0.0161675 0.0197618 0.0186435 0.0266313 0.0182658 0.0246127 0.0192808 0.0279138
Growth of Private Credit
0.0567007 0.0466234 0.042967 0.0379467 0.0459025 0.0432501 0.0376464 0.0364992
Growth of Financial Deposits
0.0531059 0.0472275 0.0494763 0.0439184 0.042777 0.0439184 0.0616187 0.0382181
Growth of Insurance Premium
0.0335451 0.0320496 0.0145349 0.0190314 0.0247138 0.0190314 -0.0039144 0.0174735
13
We see that there are great discrepancies between the different categories, for example, the GDP per capita mean differs greatly from the world which is 11,554 USD to the OIC member countries mean of 5,342 USD. When we divide the OIC countries in to subcategories, the OIC with Islamic banking has a mean of 7,333 USD whereas without Islamic banking has a mean of 1,981 USD. These large discrepancies may be due to any number of socio-economic, or political reasons but it is still interesting to see these differences and are prevalent in almost all the variables labeled in Table 1.2. We continue our investigation further to see how many of these differences may be able to be overcome.
4.3 Cross Country Regression with Instrumental Variables
In the pure cross-sectional analysis we use data averaged for the countries in each group over 1990-2013. Such that, there is one observation per country. The basic regression takes the form
𝑌𝑡= 𝛼 + 𝛽𝐼𝑛𝑐𝑙𝑢𝑠𝑖𝑜𝑛𝑖 + 𝛾′𝑋𝑖+ 𝜀𝑖(1)
14
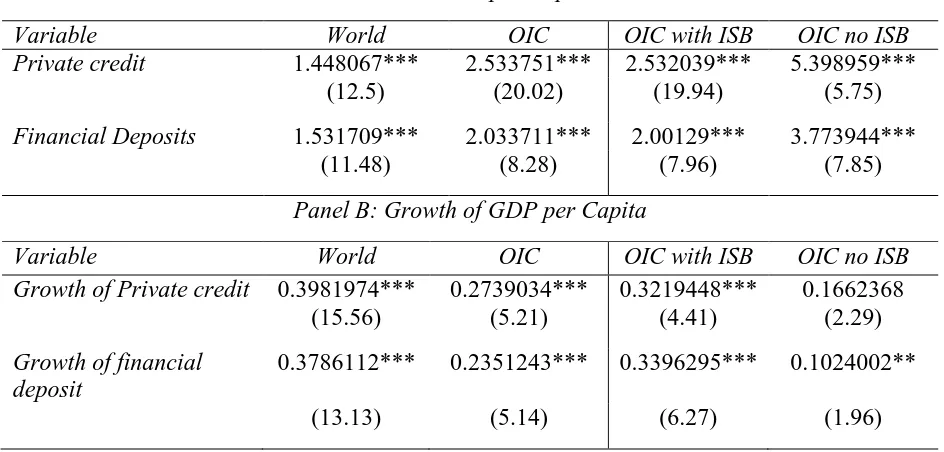
Table 1.3: GMM regression on GDP per capita and the growth of GDP per capita This table shows the estimated coefficient, z-statistic (in parentheses), and number of
observations corresponding to a GMM regression of each financial access or depth variable on the different country subgroups. Significance levels of 10 percent (*), 5 percent (**), and 1 percent (***) are also indicated. In the cross-country regressions in the left-hand portion of the table, each dependent variable is evaluated as an average for every three year period over 1990-2013.
Panel A: GDP per Capita
Variable World OIC OIC with ISB OIC no ISB
Private credit 1.448067*** 2.533751*** 2.532039*** 5.398959***
(12.5) (20.02) (19.94) (5.75)
Financial Deposits 1.531709*** 2.033711*** 2.00129*** 3.773944***
(11.48) (8.28) (7.96) (7.85)
Panel B: Growth of GDP per Capita
Variable World OIC OIC with ISB OIC no ISB
Growth of Private credit 0.3981974*** 0.2739034*** 0.3219448*** 0.1662368
(15.56) (5.21) (4.41) (2.29)
Growth of financial deposit
0.3786112*** 0.2351243*** 0.3396295*** 0.1024002**
(13.13) (5.14) (6.27) (1.96)
15
growth for OIC countries, OIC countries with Islamic countries and OIC countries without Islamic banking, this implies that increase financial deposits in the OIC region will increase GDP growth. The results of Panel B shows that Islamic banking can help economic development.
4.4 Dynamic Panel Estimation of Transformed data
In our dataset some of the observations are extreme and therefore transformation smoothens the dataset. Beck et al (2000) follows a similar technique in their study. They smooth their data for five-year periods. However, our main focus in this study are developing or underdeveloped countries which have many missing variables before 1990. Considering the much smaller timespan of our data we smooth our data over three-year periods. Given that we are using 3-year periods, the forecasting horizon for the growth innovation, that is, its unanticipated component, extends about three years into the future.
The cross-country estimations help us determine whether the cross-country variable in economic growth can be explained by variance in the exogenous component of financial inclusion. There are some limitations with pure cross-sectional instrumental variable estimator. Therefore using panel techniques may help with these issues. First, besides the cross-country variance, we also would like to know whether changes in financial development over time within a country have an effect on economic growth through its various channels. By using a panel data set, we gain degrees of freedom by adding the variability of the time-series dimension. It also allows us to exploit substantial additional variability.
Our panels were divided into the different subgroups over the period 1990-2013. Many countries were dropped due to the lack of data. We average the data over 6 non-overlapping 3-year periods. The regression equation can be specified as follows:
𝑦𝑖,𝑡 = 𝛼′𝑋1𝑖,𝑡+ 𝛽′𝑋2
16
where y represents our dependent variable, X1 represents a set of lagged explanatory variables, and X2 represents a set of contemporaneous explanatory variables, µ is an unobserved
country-specific effect, λ is a time-specific effect, ε is the time-varying error term, and i and t represent country and 3-year time period, respectively.
For estimating panel data, if the dependence variable has a serial auto-correlation, the regression with the lagged dependent variables as independent variables can reduce the serial auto-correlation of an error term. When dealing with panel data, a similar approach can be adopted that considers the auto correlation of the dependent variable, however, the estimation will be biased because of the correlation between the lagged dependent variables and the error term. To handle this issue, Arellano and Bond (1991) suggested a generalized method of moments (GMM) method that estimated a dynamic panel model, which can remove the auto correlation of the error term and reduce the correlation between endogenous variables and the error term.
Arellano and Bond (1991) suggests to first-difference the regression equation to eliminate the country-specific effect, as follows:
𝑦𝑖,𝑡 − 𝑦𝑖,𝑡−1= 𝛼′(𝑋1
𝑖,𝑡−1− 𝑋1𝑖,𝑡−2) + 𝛽′(𝑋2𝑖,𝑡− 𝑋2𝑖,𝑡−1) + (𝜀𝑖,𝑡− 𝜀𝑖,𝑡−1) (3)
This procedure solves the first econometric problem, but introduces a correlation between the new error term, 𝜀𝑖,𝑡− 𝜀𝑖,𝑡−1, and the lagged dependent variable, 𝑦𝑖,𝑡−1− 𝑦𝑖,𝑡−2, when it is included in
𝑋1
𝑖,𝑡−1− 𝑋1𝑖,𝑡−2. To address this correlation and endogeneity problem, Arellano and Bond (1991)
propose using the lagged values of the explanatory variables in levels as instruments. Under the assumptions that there is no serial in the error term, ε, and that the explanatory variables X, where X=[X1X2], are weakly exogenous, we can use the following moment conditions:
17
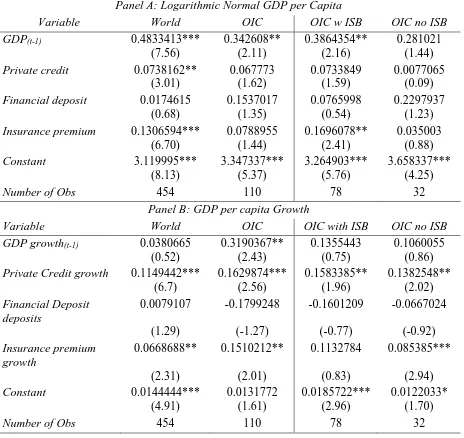
Table 1.4: One-step estimator of Arellano and Bond (1991)
This table shows the estimated coefficient, z-statistic (in parentheses), and number of
observations corresponding to a one-step estimator of Arellano and Bond (1991) regression of each financial access or depth variable on the different country subgroups. We are not
assuming homoskedastic error term. Significance levels of 10 percent (*), 5 percent (**), and 1 percent (***) are also indicated. The variables in Panel A are normalized using logarithm. In the cross-country regressions in the left-hand portion of the table, each dependent variable is evaluated as an average for every three year period over 1990-2013.
Panel A: Logarithmic Normal GDP per Capita
Variable World OIC OIC w ISB OIC no ISB
GDP(t-1) 0.4833413*** 0.342608** 0.3864354** 0.281021
(7.56) (2.11) (2.16) (1.44)
Private credit 0.0738162** 0.067773 0.0733849 0.0077065
(3.01) (1.62) (1.59) (0.09)
Financial deposit 0.0174615 0.1537017 0.0765998 0.2297937
(0.68) (1.35) (0.54) (1.23)
Insurance premium 0.1306594*** 0.0788955 0.1696078** 0.035003
(6.70) (1.44) (2.41) (0.88)
Constant 3.119995*** 3.347337*** 3.264903*** 3.658337***
(8.13) (5.37) (5.76) (4.25)
Number of Obs 454 110 78 32
Panel B: GDP per capita Growth
Variable World OIC OIC with ISB OIC no ISB
GDP growth(t-1) 0.0380665 0.3190367** 0.1355443 0.1060055
(0.52) (2.43) (0.75) (0.86)
Private Credit growth 0.1149442*** 0.1629874*** 0.1583385** 0.1382548**
(6.7) (2.56) (1.96) (2.02)
Financial Deposit deposits
0.0079107 -0.1799248 -0.1601209 -0.0667024
(1.29) (-1.27) (-0.77) (-0.92)
Insurance premium growth
0.0668688** 0.1510212** 0.1132784 0.085385***
(2.31) (2.01) (0.83) (2.94)
Constant 0.0144444*** 0.0131772 0.0185722*** 0.0122033*
(4.91) (1.61) (2.96) (1.70)
Number of Obs 454 110 78 32
We first test for autocorrelation and reject our null of no autocorrelation in the first differenced errors at 10% level. In Table 1.4 Panel A, we see that previous period GDP (GDPt-1)
18
is correlated with this period’s GDP. The sample for OIC countries with no Islamic banking is so
small that most tests do not yield significant results. In this panel we also see that Insurance premium has a positive and significant correlation with GDP per capita for both the world and for
OIC countries with Islamic banking. In Panel B of the same table, we can see that private credit growth is positively and significantly correlated with GDP growth for all categories. And
insurance premium growth is positively and significantly correlated to GDP growth for all
categories except OIC countries with Islamic banking. We cannot make any inferences about Islamic banking from this Panel B but Panel A shows promising results for Islamic banking.
There are some issues by first-differencing. We lose the pure cross-country dimension of the data. Second, differencing may decrease the signal-to-noise ratio, thereby exacerbating measurement error biases. Also, Alonso-Borrego and Arellano (1999) and Blundell and Bond (1997) show that if the lagged dependent and the explanatory variables are persistent over time, lagged levels of these variables are weak instruments for the regressions in differences. Simulation studies show that the difference estimator has a large finite-sample bias and poor precision. Therefore, to deal with these issues we use an alternative method that estimates the regression in differences jointly with the regression in levels, as proposed by Arellano and Bover (1995). Using Monte Carlo experiments, Blundell and Bond (1997) show that this system estimator reduces the potential biases in finite samples and asymptotic imprecision associated with the difference estimator.
19
are more serially correlated than in differences. However, being able to use the regression in levels comes at the cost of requiring an additional assumption. This requirement occurs because the regression in levels does not directly eliminate the country-specific effect. Instead, appropriate instruments must be used to control for country-specific effects. The estimator uses lagged differences of the explanatory variables as instruments. They are valid instruments under the assumption that the correlation between l and the levels of the explanatory variables is constant over time, such that
𝐸[𝑋𝑖,𝑡+𝑝𝜇𝑖] = 𝐸[𝑋𝑖,𝑡+𝑞𝜇𝑖]for all p and q. (5)
Under this assumption, there is no correlation between the differences of the explanatory variables and the country-specific effect. For example, this assumption implies that financial inclusion may be correlated with the country-specific effect, but this correlation does not change through time. Thus, under this assumption, lagged differences are valid instruments for the regression in levels, and the moment conditions for the regressions in levels are as follows:
𝐸[(𝑋𝑖,𝑡−𝑠−𝑋𝑖,𝑡−𝑠−1)(𝜀𝑖,𝑡+ 𝜇𝑖))] = 0𝑓𝑜𝑟𝑠 = 1; 𝑡 = 3, … . , 𝑇. (6)
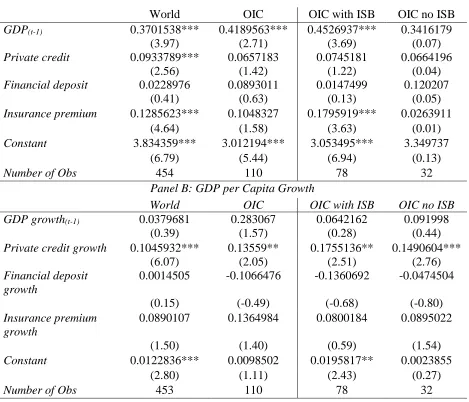
When we conduct the two-step estimator with Windmeijer bias-corrected robust VCE we get similar results. In Table 1.5 Panel A, the variables are normalized using logarithm. The results in this panel show that GDPt-1 is positively and significantly correlated to GDP across all
20
the world (.1285623), this indicates that Islamic finance may increase the amount of insurance premium greater than conventional banking.
In Panel B, we find that private credit growth is positively and significantly correlated to GDP growth across all categories. The coefficient for OIC countries with Islamic banking is the
21
Table 1.5: A two-step estimator with Windmeijer bias-corrected robust VCE
This table shows the estimated coefficient, z-statistic (in parentheses), and number of observations corresponding to a two-step estimator of Arellano and Bond (1991) regression with Windmeijer bias corrected robust VCE of each financial access or depth variable on the different country subgroups. Significance levels of 10 percent (*), 5 percent (**), and 1 percent (***) are also indicated. The variables in Panel A are normalized using logarithm. In the cross-country regressions in the left-hand portion of the table, each dependent variable is evaluated as an average for every three year period over 1990-2013.
Panel A: GDP per Capita
World OIC OIC with ISB OIC no ISB
GDP(t-1) 0.3701538*** 0.4189563*** 0.4526937*** 0.3416179
(3.97) (2.71) (3.69) (0.07)
Private credit 0.0933789*** 0.0657183 0.0745181 0.0664196
(2.56) (1.42) (1.22) (0.04)
Financial deposit 0.0228976 0.0893011 0.0147499 0.120207
(0.41) (0.63) (0.13) (0.05)
Insurance premium 0.1285623*** 0.1048327 0.1795919*** 0.0263911
(4.64) (1.58) (3.63) (0.01)
Constant 3.834359*** 3.012194*** 3.053495*** 3.349737
(6.79) (5.44) (6.94) (0.13)
Number of Obs 454 110 78 32
Panel B: GDP per Capita Growth
World OIC OIC with ISB OIC no ISB GDP growth(t-1) 0.0379681 0.283067 0.0642162 0.091998
(0.39) (1.57) (0.28) (0.44)
Private credit growth 0.1045932*** 0.13559** 0.1755136** 0.1490604***
(6.07) (2.05) (2.51) (2.76)
Financial deposit growth
0.0014505 -0.1066476 -0.1360692 -0.0474504
(0.15) (-0.49) (-0.68) (-0.80)
Insurance premium growth
0.0890107 0.1364984 0.0800184 0.0895022
(1.50) (1.40) (0.59) (1.54)
Constant 0.0122836*** 0.0098502 0.0195817** 0.0023855
(2.80) (1.11) (2.43) (0.27)
Number of Obs 453 110 78 32
The results of the one-step estimator of Arellano and Bover (1995) regression are presented in Table 1.6. The results in Panel A are similar to the previous results, where GDPt-1 is correlated
22
credit is positively and significantly correlated to GDP for the world and OIC countries. We cannot
23
Table 1.6: One-step estimator of Arellano and Bover (1995) not assuming homoskedastic error term
This table shows the estimated coefficient, z-statistic (in parentheses), and number of
observations corresponding to a one-step estimator of Arellano and Bover (1995) regression of each financial access or depth variable on the different country subgroups. We are not assuming homoskedastic error term Significance levels of 10 percent (*), 5 percent (**), and 1 percent (***) are also indicated. The variables in Panel A are normalized using logarithm. In the cross-country regressions in the left-hand portion of the table, each dependent variable is evaluated as an average for every three year period over 1990-2013.
Panel A: GDP per Capita
World OIC OIC with ISB OIC no ISB GDP(t-1) 0.5506868*** 0.7490871*** 0.6248235*** 0.8553244
(6.22) (7.00) (3.56) (10.91)
Private credit 0.0790888* 0.1744954* 0.1485452 0.1945388
(1.94) (1.79) (1.25) (1.60)
Financial deposit 0.0037956 -0.0927124 -0.1077349 -0.0925915 (0.22) (-0.82) (-0.84) (-0.98) Insurance premium 0.1357285*** -0.0045981 0.1433709 -0.0564309
(4.91) (-0.05) (1.23) (-1.01)
Constant 2.602588*** 1.474334*** 2.277986*** 0.6788371
(6.03) (3.21) (3.32) (1.74)
Number of Obs 574 139 99 40
Panel B: GDP per Capita Growth
World OIC OIC with ISB OIC no ISB GDP growth(t-1) 0.0921583 0.3462706*** 0.2512558 0.2594781***
(1.62) (2.87) (1.06) (3.50)
Private credit growth 0.1255999*** 0.1656607** 0.1608909* 0.1366351**
(6.75) (2.51) (1.87) (2.16)
Financial deposit growth 0.0097476 -0.1756344 -0.1604298 -0.0846551 (1.28) (-1.11) (-0.68) (-1.40) Insurance premium growth 0.0689376** 0.1535817* 0.1386411 0.1266342***
(2.33) (1.72) (0.90) (4.50)
Constant 0.0122348*** 0.0120093** 0.0144873** 0.0096149**
(5.15) (2.01) (2.52) (1.77)
Number of Obs 573 139 99 40
We then do a two-step estimator with Windmeijer bias-corrected robust VCE. The results of this regression are presented in Table 1.7. Panel A, shows that GDP(t-1) for the world, OIC
24
subgroups. From Panel A we cannot make any conclusion about Islamic banking being better. Looking at the growth of the same variables in Panel B, GDP growth(t-1) is positive and significant
for OIC countries and OIC countries without Islamic banking. We also find that private credit growth for OIC countries is also positive and significantly correlated to GDP growth as well as for
25
Table 1.7: A two-step estimator with Windmeijer bias-corrected robust VCE
This table shows the estimated coefficient, z-statistic (in parentheses), and number of
observations corresponding to a two-step estimator of Arellano and Bover (1995) regression with Windmeijer bias corrected robust VCE of each financial access or depth variable on the different country subgroups. Significance levels of 10 percent (*), 5 percent (**), and 1 percent (***) are also indicated. The variables in Panel A are normalized using logarithm. In the cross-country regressions in the left-hand portion of the table, each dependent variable is evaluated as an average for every three year period over 1990-2013.
Panel A: GDP per capita
World OIC whole OIC Islamic OIC non-Islamic GDP(t-1) 0.5114023*** 0.7637287*** 0.6380059*** 0.796915
(4.82) (6.76) (4.24) (0.63)
Private credit 0.0870991** 0.1388783 0.1320848 0.154713
(2.08) (1.37) (1.1) (0.24)
Financial deposit 0.0058688 -0.0570806 -0.0906835 -0.0712696
(0.17) (-0.46) (-0.85) (-0.06)
Insurance premium 0.1325068*** -0.0169092 0.1184969 -0.0371378
(3.83) (-0.17) (1.54) (-0.02)
Constant 2.842381*** 1.377937*** 2.223892*** 1.078095
(5.04) (3.07) (3.19) (0.14)
Number of Obs 574 139 99 40
Panel B: GDP per Capita Growth
World OIC OIC with ISB OIC no ISB GDP growth(t-1) 0.1499212 0.3414409*** 0.235832 0.3815464**
(1.96) (2.88) (0.98) (2.34)
Private credit growth 0.1117029 0.1212988** 0.1670115** 0.0896763
(5.44) (2.07) (2.2) (0.89)
Financial deposit growth 0.0033135 -0.1200763 -0.1579043 -0.0598815
(0.26) (-0.8) (-0.72) (-0.66)
Ins. premium growth 0.1177448** 0.1523254** 0.132466 0.1515774***
(2.42) (1.96) (0.93) (5.57)
Constant 0.0077825*** 0.0110387* 0.0148895*** 0.004765
(2.82) (1.71) (2.57) (0.75)
Number of Obs 573 139 99 40
4.5 Dynamic Panel Estimation of non-Transformed Data
26
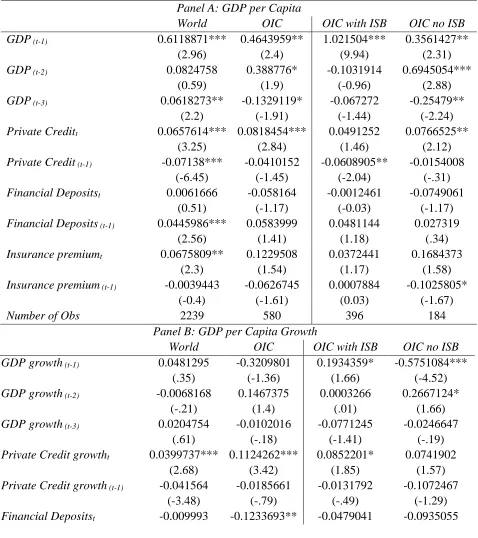
Panel A we regress GDP per capita against our proxy variables and also a one period lag of those variables, and a three period lag of GDP and in Panel B we regress the growth of the same variables. Our results, in Table 1.8 Panel A, indicate that GDP (t-1) for all subgroups is positive and
significant, indicating that the current period GDP is related to last period’s GDP. GDP (t-2) is
positive and significant for OIC countries and for OIC countries without Islamic banking. It is interesting to see that GDP (t-3) for the world is positive and significant for the world, however it is
negative and significant for OIC countries and OIC countries without Islamic banking. Private credit for the current period, t, is positive and significant for the world, OIC countries and for OIC countries without Islamic banking. Private Credit (t-1) on the other had is negative and significant
for the world, OIC countries, and for OIC countries without Islamic banking. Panel B, shows us that GDP growth (t-1) is significant for OIC countries with and without Islamic countries, however
it is positive for OIC countries with Islamic countries and negative for OIC countries without Islamic banking. Panel B shows that GDPgrowth (t-1) is negative and significant for OIC countries
and OIC countries without Islamic banking. Private Credit growtht is positive and significant for
27
Table 1.8: One-step estimator of Arellano and Bond (1991) for non-transformed data This table shows the estimated coefficient, z-statistic (in parentheses), and number of observations corresponding to a One-step estimator of Arellano and Bond (1991) of each financial access or depth variable on the different country subgroups. We are not assuming homoskedastic error term. Significance levels of 10 percent (*), 5 percent (**), and 1 percent (***) are also indicated. The variables in Panel A are normalized using logarithm. In the cross-country regressions in the left-hand portion of the table, each dependent variable is evaluated over 1990-2013.
Panel A: GDP per Capita
World OIC OIC with ISB OIC no ISB GDP (t-1) 0.6118871*** 0.4643959** 1.021504*** 0.3561427**
(2.96) (2.4) (9.94) (2.31)
GDP (t-2) 0.0824758 0.388776* -0.1031914 0.6945054***
(0.59) (1.9) (-0.96) (2.88)
GDP (t-3) 0.0618273** -0.1329119* -0.067272 -0.25479**
(2.2) (-1.91) (-1.44) (-2.24)
Private Creditt 0.0657614*** 0.0818454*** 0.0491252 0.0766525**
(3.25) (2.84) (1.46) (2.12)
Private Credit (t-1) -0.07138*** -0.0410152 -0.0608905** -0.0154008
(-6.45) (-1.45) (-2.04) (-.31) Financial Depositst 0.0061666 -0.058164 -0.0012461 -0.0749061
(0.51) (-1.17) (-0.03) (-1.17) Financial Deposits (t-1) 0.0445986*** 0.0583999 0.0481144 0.027319
(2.56) (1.41) (1.18) (.34)
Insurance premiumt 0.0675809** 0.1229508 0.0372441 0.1684373
(2.3) (1.54) (1.17) (1.58)
Insurance premium (t-1) -0.0039443 -0.0626745 0.0007884 -0.1025805*
(-0.4) (-1.61) (0.03) (-1.67)
Number of Obs 2239 580 396 184
Panel B: GDP per Capita Growth
World OIC OIC with ISB OIC no ISB GDP growth (t-1) 0.0481295 -0.3209801 0.1934359* -0.5751084***
(.35) (-1.36) (1.66) (-4.52)
GDP growth (t-2) -0.0068168 0.1467375 0.0003266 0.2667124*
(-.21) (1.4) (.01) (1.66)
GDP growth (t-3) 0.0204754 -0.0102016 -0.0771245 -0.0246647
(.61) (-.18) (-1.41) (-.19)
Private Credit growtht 0.0399737*** 0.1124262*** 0.0852201* 0.0741902
(2.68) (3.42) (1.85) (1.57)
Private Credit growth (t-1) -0.041564 -0.0185661 -0.0131792 -0.1072467
(-3.48) (-.79) (-.49) (-1.29)
28
(-.93) (-2.12) (-.79) (-1.43)
Financial Deposits (t-1) 0.0493786*** 0.0447284 0.0369477 0.0935303
(2.97) (1.47) (.99) (1.22)
Ins. Premium growtht 0.0563684** 0.1155644* 0.0239276 0.1472185
(2.02) (1.68) (.71) (1.63)
Ins. Premium growth (t-1) 0.015319* 0.0151406 -0.0095902 0.0399444*
(1.74) (.67) (-.48) (1.77)
Number of Obs 2015 536 368 168
For Table 1.9, we repeat the Arellano and Bover (1995) and Blundell and Bond (1999) estimators. We regress GDP per capita against 3 period lags of itself as well as against our proxy variables of financial inclusion. In Panel A we find that for the non-transformed data, GDP (t-1) is
positive and significantly correlated to GDP per capita across all categories. GDP(t-3) is negatively
and significantly correlated to GDP per capita for the world, OIC countries and OIC countries with Islamic banking. This shows that if GDP per capita increases this year, three years from now the GDP will decrease. Private credit is also negative and significantly correlated to GDP per capita for the world and for OIC countries with Islamic banking. This result is different from our
previous results which found a positive correlation between the two variables. In Panel B, GDP Growth (t-1) is negative and significant for OIC countries and for OIC countries without Islamic
29
Table 1.9: Arellano and Bover/Blundell and Bond system estimator
This table shows the estimated coefficient, z-statistic (in parentheses), and number of
observations corresponding to an Arellano and Bover (1995)/Blundell and Bond system estimator of each financial access or depth variable on the different country subgroups. Significance levels of 10 percent (*), 5 percent (**), and 1 percent (***) are also indicated. The variables in Panel A are normalized using logarithm. In the cross-country regressions in the left-hand portion of the table, each dependent variable is evaluated over 1990-2013.
Panel A: GDP per Capita
World OIC OIC with ISB OIC no ISB
GDP (t-1) 0.943474*** 0.621765** 1.224554*** 0.4445286*
3.62 2.22 10.79 1.89
GDP (t-2) 0.0981844 0.5899437* -0.1852345 0.7675793**
.34 1.69 -1.55 2.08
GDP (t-3) -0.141766* -0.3148939** -0.0975485** -0.2653401
-1.81 -2.27 -2.03 -1.57
Private Credit -0.0152611* -0.0304785 -0.0224611*** 0.0245371
-1.88 -1.56 -2.64 .79
Financial Deposit 0.0212423* 0.0440662 0.0423566*** -0.0225753
1.86 1.39 2.82 -.40
Insurance Premium 0.0488989** 0.0334519 0.0182875 0.0215659
2.33 .94 1.19 .63
Constant 0.5933507* 0.6068301** 0.2699222*** 0.3476399*
1.94 2.20 4.01 1.87
Number of Obs 2544 671 452 219
Panel B: GDP per Capita Growth
World OIC OIC with ISB OIC no ISB GDP Growth (t-1) -0.1450318 -0.3717239* 0.1363742 -0.5556563***
-0.75 -1.92 1.23 -5.37
GDP Growth (t-2) -0.1083693*** 0.0085858 -0.0013577 0.0711521
-2.59 0.17 -0.03 1.26
GDP Growth (t-3) -0.0577341 0.0101441 -0.0478679 0.0272925
-1.18 0.27 -1.00 0.54
Private Credit growth 0.0611857*** 0.098901*** 0.0618412* 0.0619089
2.68 2.80 1.87 1.21
Financial Deposit growth -0.0013343 -0.1070429** -0.0298627 -0.0535929
-0.11 -2.02 -0.58 -1.29
Ins. Premium growth 0.0455243* 0.1112617* 0.0272016 0.1271037
1.92 1.72 0.81 1.54
Constant 0.0268915*** 0.0267851*** 0.0179177*** 0.0267405***
5.36 7.35 6.27 4.19
30
When we do the two-step estimator with Windmeijer bias-corrected robust VCE, the results are shown below in Table 1.10. In Panel A, we find that GDP(t-1) is positive and significantly
correlated to GDP per capita for all groups. The coefficient for OIC countries with Islamic finance (0.8380702) is greater than the other categories, indicating a stronger correlation between current and previous period GDP. Insurance premium is also positively and significantly correlated to GDP per capita for the world, OIC countries and OIC countries with Islamic banking. We see that
31
Table 1.10: A two-step estimator with Windmeijer bias-corrected robust VCE
This table shows the estimated coefficient, z-statistic (in parentheses), and number of observations corresponding to a two-step estimator of Arellano and Bover (1995) with Windmeijer bias-corrected robust VCE of each financial access or depth variable on the
different country subgroups. Significance levels of 10 percent (*), 5 percent (**), and 1 percent (***) are also indicated. The variables in Panel A are normalized using logarithm. In the cross-country regressions in the left-hand portion of the table, each dependent variable is evaluated over 1990-2013.
Panel A: GDP per capita
World OIC OIC with ISB OIC no ISB GDP (t-1) 0.7284787*** 0.6461802*** 0.8380702*** 0.5795497**
7.01 5.07 26.1 2.44
Private credit 0.020472 0.0357064 0.0030546 0.0529797
0.99 1.37 0.21 0.57
Financial deposit 0.0306508** 0.0325457 0.0201298 0.0428391
1.9 1.49 0.80 0.54
Insurance premium 0.0699674*** 0.0731393* 0.0619324*** 0.0306873
3.37 1.72 3.03 0.83
Number of Obs 2455 637 433 204
Panel B: GDP per Capita Growth
World OIC OIC with ISB OIC no ISB GDP growth (t-1) 0.0438323 -0.2714901 0.2119906 -0.6303148
0.37 -1.06 1.50 -1.13
Private credit growth 0.0391214*** 0.0824208* 0.0518425 0.0685774
2.95 1.67 1.46 1.05
Financial deposit growth 0.0000566 -0.0883838 -0.0295082 -0.0295053
0.01 -1.49 -0.71 -0.47
Insurance premium growth 0.0462002* 0.1029017* 0.0265016 0.0795776
1.91 1.74 0.97 1.48
Number of Obs 2305 591 404 187
In Table 1.11, we repeat the two-step estimator with Windmeijer bias-corrected robust VCE, this time we assume the variables are endogenous. In Panel A, GDP (t-1) again is positively and
significantly correlated to GDP per capita across all groups. GDP (t-3) is negatively and
32
significantly correlated to GDP per capita for the world, OIC countries and OIC countries with Islamic banking. In Panel B, we find that GDP growtht-1 is positive and significantly correlated to
33
Table 1.11: Two-step estimator with Windmeijer bias-corrected robust VCE with endogenous variables
This table shows the estimated coefficient, z-statistic (in parentheses), and number of
observations corresponding to of each financial access or depth variable on the different country subgroups. We assume the variables are endogenous. Significance levels of 10 percent (*), 5 percent (**), and 1 percent (***) are also indicated. The variables in Panel A are normalized using logarithm. In the cross-country regressions in the left-hand portion of the table, each dependent variable is evaluated over 1990-2013.
Panel A: GDP per Capita
World OIC OIC with ISB OIC no ISB GDP (t-1) 0.7424142*** 0.5929716** 1.097554*** 0.3618759**
3.66 2.46 12.75 1.96
GDP (t-2) 0.0406162 0.3801694 -0.1584083* 0.5532129**
0.24 1.43 -1.69 2.27
GDP (t-3) -0.0216312 -0.1717721** -0.0821811* -0.1282949
-0.68 -2.18 -1.69 -1.19
Private Credit 0.0204716 0.0137677 -0.0016698 0.034361
1.62 1.01 -0.31 1.07
Financial Deposit 0.0263046** 0.0132857 0.033581*** -0.0210583
2.33 0.47 2.80 -0.33
Insurance Premium 0.0649705*** 0.068041* 0.0438016*** 0.0736055
2.78 1.89 3.04 1.26
Number of Obs. 2361 618 418 200
Panel B: GDP per Capita Growth
World OIC OIC with ISB OIC no ISB GDP Growth(t-1) -0.1380385 -0.3269644 0.1778858* -0.5453351***
-0.65 -1.60 1.80 -4.65
GDP Growth (t-2) -0.0154404 0.1535279** 0.0454022 0.1761807**
-0.38 1.99 1.04 2.11
GDP Growth (t-3) -0.0189271 -0.0192294 -0.0738474 0.0213701
-0.51 -0.57 -1.34 0.31
Private Credit growth 0.0673272*** 0.0764501*** 0.0548166** 0.0483215
3.32 4.07 3.00 0.97
Financial Deposit growth 0.0107387 -0.0645309** -0.0128664 -0.0494419
0.83 -2.00 -0.40 -0.94
Ins. Premium growth 0.0450164* 0.1001777* 0.0361923 0.1304655
1.76 1.79 1.24 1.54
34
4.6Panel VAR methodology
While the dynamic panel estimation can present the dynamic effect of financial inclusion key factors for economic growth, the examination for dynamic causality, direction, and timing will show more sufficient information about the relationship of variables. The most well-known method for exploring the dynamic relationship of variables is the vector autoregressive (VAR) methodology, but it is only applicable for time series data, not for panel data. To use the VAR method for panel data, we need to use a panel data vector autoregressive methodology, which is a transformed VAR methodology for panel data. This approach combines the VAR approach of treating all variables as endogenous variables and controls heterogeneity of the panels (Love and Zicchino, 2006). The panel VAR model for this study is as follows:
𝑌𝑖𝑡 = 𝐶 + ∑𝑚𝑠=1𝐴𝑠𝑌𝑖,𝑡−𝑠+ 𝜂𝑖 + 𝑑𝑐,𝑡+ 𝑒𝑡(2)
Where 𝑌𝑖𝑡 is a variable vector including all financial inclusion variables, 𝑑𝑐,𝑡 are
35
To estimate the impulse-response functions (IRFs), we can calculate confidence intervals using the matrix of IRFs from the coefficients of the panel VAR. For this, we will calculate the standard error of IRFs and create confidence intervals using Monte Carlo simulations approach.
On the other hand, forecast error variance decompositions (FEVDs) are a method that can show the percentage of variation in one variable that is affected by the shock of another variable over time. That is, since FEVD can show the response of one variable over time to a single innovation in itself or another variable, FEVDs can represent the strength of the whole effect. Therefore, we can report FEVDs over two, five, and ten years to examine the cumulative total effects over time.
We first conduct a unit root test for our four variables, GDP growth, private credit, financial deposit and insurance. We reject the null hypothesis of unit root test for our four variables. We look for cointegration between the variables and we find that we reject H0 for all variables except
36
Table 1.12: Panel VAR
This table shows the estimated coefficient, z-statistic (in parentheses), and number of
observations corresponding to a panel VAR regression of each financial access or depth variable on the different country subgroups. Significance levels of 10 percent (*), 5 percent (**), and 1 percent (***) are also indicated. The variables in Panel A are normalized using logarithm. In the cross-country regressions in the left-hand portion of the table, each dependent variable is
evaluated over 1990-2013.
Panel A: GDP Growth
World OIC OIC with ISB OIC no ISB
GDP Growth(t-1) 0.3208333*** 0.2831538*** 0.4031887*** 0.1399427
7.43 2.76 3.17 0.81
GDP Growth(t-2) 0.0717159* 0.2155516** 0.093669 0.3045929*
1.83 2.41 1.49 1.65
Private Credit growth(t-1) -0.0010166 -0.0004113 -0.0070202 0.0084326
-0.1 -0.02 -0.27 0.17
Private Credit growth(t-2) -0.0054866 -0.0145711 -0.0057198 -0.041223
-0.5 -1.06 -0.43 -1.01
Financial Deposit growth(t-1) 0.0543897*** 0.0638664** 0.0603798* 0.106369
4.16 2.30 1.84 1.62
Financial Deposit growth(t-2) -0.0245731 -0.0760608 -0.0110612 -0.1849432
-0.87 -0.96 -0.39 -0.94
Insurance premium growth(t-1) -0.0006252 0.0020391 -0.0186759 0.0054959
-0.11 0.12 -1.03 0.23
Insurance premium growth(t-2) -0.00000773 -0.0256678 0.0260844 -0.0624258*
0 -1.11 1.37 -1.82
Panel B: Private Credit Growth
World OIC OIC with ISB OIC no ISB GDP Growth(t-1) 0.9027304*** 0.8607781*** 0.9289518*** 0.7829477***
9.63 4.32 3.54 2.75
GDP Growth(t-2) 0.055749 0.0104022 0.1272772 -0.2341829
0.65 0.06 0.63 -0.91
Private Credit growth(t-1) 0.6213705*** 0.6126877*** 0.5825644*** 0.6551784***
14.03 6.28 4.24 4.94
Private Credit growth(t-2) -0.1252048*** -0.0894335 -0.0250844 -0.2805829**
-3.12 -1.18 -0.36 -2.36
Financial Deposit growth(t-1) -0.1328897*** -0.200418* -0.1940266 -0.1903437
-2.62 -1.69 -1.36 -0.95
Financial Deposit growth(t-2) 0.0310482 -0.0587696 -0.0776796 0.0656653
0.75 -0.58 -0.85 0.35
Insurance premium growth(t-1) -0.0970508*** -0.0793074 -0.1418272** -0.0298357
37
Insurance premium growth(t-2) -0.0343707 0.0234696 0.0152154 0.015574
-1.19 0.51 0.29 0.22
Panel C: Financial Deposit Growth
World OIC OIC with ISB OIC no ISB GDP Growth(t-1) 0.5737774*** 0.4684178*** 0.4067512** 0.6200728**
5.41 3.19 2.28 2.51
GDP Growth(t-2) 0.1186029 0.2461392* 0.2876968** 0.1775296
1.30 1.91 2.03 0.72
Private Credit growth(t-1) -0.2214927 -0.0605166 -0.052211 -0.0469387
-1.58 -0.91 -0.66 -0.42
Private Credit growth(t-2) 0.1682343** 0.0740805 0.0968169** 0.002459
2.07 1.56 2.21 0.02
Financial Deposit growth(t-1) 0.7699885*** 0.3834329*** 0.3830782*** 0.3876418**
2.65 4.43 3.93 2.42
Financial Deposit growth(t-2) -0.281466 -0.209389*** -0.2155383*** -0.1625487
-2.04** -2.87 -2.74 -1.08
Insurance premium growth(t-1) -0.1089369*** -0.0913037** -0.1586385*** -0.0351291
-3.18 -2.14 -2.88 -0.65
Insurance premium growth(t-2) 0.0199515 0.0364254 0.0375319 0.0243204
0.82 0.95 0.74 0.47
Panel D: Insurance Premium Growth
World OIC OIC with ISB OIC no ISB GDP Growth(t-1) 0.4629607*** 0.2940479 0.2834881 0.355314
3.53 1.11 0.95 0.81
GDP Growth(t-2) 0.1294539 -0.0282616 0.093018 -0.319607
0.96 -0.12 0.32 -0.98
Private Credit growth(t-1) 0.0897362 0.0602435 0.0821924 -0.0038391
1.61 0.50 0.83 -0.02
Private Credit growth(t-2) -0.0610528 -0.0888598 -0.1124901* -0.0751436
-1.44 -1.3 -1.74 -0.39
Financial Deposit growth(t-1) 0.0641689 0.1702459 0.1165349 0.3795216*
1.23 1.54 1.03 1.73
Financial Deposit growth(t-2) 0.0032914 -0.0244879 -0.0545491 0.0004079
0.07 -0.22 -0.53 0.00
Insurance premium growth(t-1) 0.0163518 -0.0050237 -0.073545 0.0448622
0.37 -0.05 -1.04 0.24
Insurance premium growth(t-2) 0.056554 -0.0666765 0.0515245 -0.1742345*
38
For our panel VAR regression, each variable is regressed on 2 lags of each of the variables including itself. And the same regression is done for each of the other variables. The results are presented in Table 1.12 above. Panel A looks at the GDP growth, we see that GDP Growth(t-1) it
is positively and significantly correlated to GDP growth for all groups except OIC with no Islamic banking, for which the results are insignificant. Looking at the coeffecients we find that OIC countries with Islamic banking has the highest coefficient with 0.4031887 with a 1 percent significance, the coefficients for the other categories are lower, indicating that countries with Islamic banking is doing better on average. Financial Deposit growth(t-1) is positive and
significantly correlated to GDP and OIC countries with Islamic banking are higher than the coefficient for the world, indicating that Islamic banking may be beneficial in this region. Insurance premium growth(t-2) is negative and significant for OIC countries with not Islamic
banking.
Panel B looks at Private credit growth, we see that the results show that the first and third lags of GDP growth positively affects the current GDP, GDP Growth(t-1) is positively and
significantly correlated to private credit growth. Again the coefficient for OIC countries with Islamic banking (.9289518) is higher than the other coefficients, indicating that it has a stronger correlation with private credit growth. The one period lag of private credit is positively and significantly correlated to current period private credit growth for all groups. The two period lag of private credit is negatively and significantly correlated to the current period private credit growth for the world and for OIC countries with no Islamic banking. Financial Deposit growth
(t-1) is negatively and significantly correlated to private credit growth for the world and OIC
countries. Insurance premium growth(t-1) is negatively and Insurance premium growth(t-1)
39
Panel C looks at financial deposit growth, we find that it is positively and significantly correlated to GDP Growth(t-1) across all groups, the coefficient for OIC countries without Islamic
banking (.6200728) is the highest, therefore we cannot draw any conclusions about Islamic finance being beneficial. The two period lag of GDP is also positively and significantly correlated for OIC countries and OIC countries with Islamic banking. The one period lag of private credit growth does not produce significant results but the Private Credit growth(t-2) positively and significantly
correlated to financial deposit growth for the world and OIC countries with Islamic banking. The one period lag of financial deposit growth is positively and significantly correlated to the current period for all groups and the two period lag is negatively and significantly correlated for OIC countries and OIC countries with Islamic banking. Insurance premium growth(t-1) is negatively and
significantly correlated to financial deposit growth across all groups. All the coefficients for OIC countries with Islamic banking are lower than the other categories in this Panel and therefore we cannot arrive at any conclusions about Islamic banking for this panel.
Panel D looks at insurance premium growth. The results for this part of the table are mostly insignificant.
4.7 Panel Granger causality test
40
The second method is to examine the Granger causality test with the assumption that all the coefficients are different across all cross-sections, which is adopted by Dumitrescu-Hurlin (2012). This method calculates the standard Granger causality tests for each panel and calculates a Zbar statistic from the average of the test statistics.