R E S E A R C H A R T I C L E
Open Access
Impact of blood glucose levels on the
accuracy of urinary N-acety-
β
-D-glucosaminidase for acute kidney injury
detection in critically ill adults: a
multicenter, prospective, observational
study
Lin Wang
1†, Yujun Deng
2†, Yiling Zhai
2†, Feng Xu
3, Jinghua Li
4, Danqing Zhang
2, Lu Gao
2, Yating Hou
2,
Xin OuYang
2, Linhui Hu
2, Jie Yuan
2, Heng Ye
5, Ruibin Chi
6and Chunbo Chen
1*Abstract
Background:The performance of urinary N-acetyl-β-D-glucosaminidase (uNAG) for the detection of acute kidney injury (AKI) was controversial. uNAG is positively correlated with blood glucose levels. Hyperglycemia is common in the critically ill adults. The influence of blood glucose levels on the accuracy of uNAG in AKI detection has not yet been reported. The present study evaluated the effect of blood glucose levels on the diagnostic accuracy of uNAG to detect AKI.
Methods:A total of 1585 critically ill adults in intensive care units at three university hospitals were recruited in this prospective observational study. uNAG, serum glucose, and glycosylated hemoglobin (HbA1c) were measured at ICU admission. Patients were categorized based on the history of diabetes and blood glucose levels. The performance of uNAG to detect AKI in different groups was assessed by the area under the receiver operator characteristic curve.
Results:Four hundred and twelve patients developed AKI, of which 109 patients were severe AKI. uNAG was significantly correlated with the levels of serum glucose (P< 0.001) and HbA1c (P< 0.001). After stratification based on the serum glucose levels, no significant difference was observed in the AUC of uNAG in detecting AKI between any two groups (P> 0.05). Stratification for stress hyperglycemic demonstrated similar results.However, among non-diabetic patients, the optimal cut-off value of uNAG for detecting AKI was higher in stress
hyperglycemic patients as compared to those without stress hyperglycemia.
Conclusions:The blood glucose levels did not significantly affect the performance of uNAG for AKI detection in critically ill adults. However, the optimal cut-off value of uNAG to detect AKIwas affected by stress hyperglycemia in non-diabetic patients.
Keywords:Acute kidney injury, N-acetyl-β-D-glucosaminidase, Blood glucose levels, Critically ill patients
© The Author(s). 2019Open AccessThis article is distributed under the terms of the Creative Commons Attribution 4.0 International License (http://creativecommons.org/licenses/by/4.0/), which permits unrestricted use, distribution, and reproduction in any medium, provided you give appropriate credit to the original author(s) and the source, provide a link to the Creative Commons license, and indicate if changes were made. The Creative Commons Public Domain Dedication waiver (http://creativecommons.org/publicdomain/zero/1.0/) applies to the data made available in this article, unless otherwise stated.
* Correspondence:[email protected]
†These authors contributed equally to this study, Co-first author
1
Department of Intensive Care Unit of Cardiovascular Surgery, Guangdong Cardiovascular Institute, Guangdong Provincial People’s Hospital, Guangdong Academy of Medical Sciences, Guangzhou 510080, Guangdong Province, China
Key messages
Admission serum glucose and HbA1c levels were positively correlated with uNAG.
Admission serum glucose and HbA1c levels did not have a significant impact on the discrimination accuracy of uNAG for AKI.
The optimal cut-off value of uNAG to detect AKI could be affected by stress hyperglycemia in non-diabetic patients.
Background
Acute kidney injury (AKI) is a frequent occurrence [1–3] and associated with morbidity and mortality [4–6], espe-cially in intensive care unit (ICU) [7,8]. Early intervention may avoid the heavy burden associated with AKI due to its long-term effects [9]. Therefore, the timely identifica-tion of AKI is an urgent requisite.
Urinary N-acetyl-β-D-glucosaminidase (uNAG), ori-ginating from the lysosomes of the proximal tubule cells of the kidney, is a sensitive marker for AKI in clinical practice. Since the large size of the uNAG molecule im-pedes its renal filtration, and high levels of uNAG are unlikely to originate from a non-renal source [10, 11]. Recent studies indicated that uNAG is valuable in the early diagnosis of AKI [1,12–14]. However, some studies reported a satisfactory discrimination of uNAG in the early detection of AKI in various patient populations [1,
13], while other studies found that uNAG had poor-to-moderate discrimination ability for AKI [15, 16]. These contradictory findings limit the application of uNAG in the early detection of AKI in clinical practice.
Notably, previous studies found that the concentra-tions of uNAG were positively correlated with blood glucose levels [17–20]. A previous study [20] demon-strated that the level of uNAG increases rapidly due to blood glucose fluctuation. It is possible that in-creased glucose reabsorption of renal tubule excited the polyol pathway activity, which cause sorbitol ac-cumulation and osmotically tissue damage [21]. Con-sequently, the damage of renal tubule increased the excretion of uNAG. ICU patients were usually associ-ated with various clinical comorbidities, especially im-paired glucose metabolism. Moreover, hyperglycemia, which is common in critically ill patients [22], has been reported to be associated with AKI [23]. How-ever, the effect of blood glucose levels on the per-formance and threshold of uNAG in detecting AKI has not yet been elucidated.
Therefore, we undertook a multicenter, prospective, observational study to assess the performance of uNAG for AKI detection in critically ill adults classified accord-ing to the history of diabetes and blood glucose levels in real- world clinical practice.
Methods
Protocol design and study population
Three general ICUs was included in this prospective ob-servational study. Patients admitted to our ICUs between October 2014 and July 2016 were enrolled. Exclusion cri-teria were known the refusal of consent, age < 18 years, pregnancy, unavailability of the urine sample, hemodialysis or peritoneal dialysis prior to enrollment or end-stage renal disease (ESRD), nephrectomy or renal transplant-ation. The protocol was followed according to that of the Strengthening the Reporting of Observational Studies in Epidemiology [24] and Standards for Reporting Diagnostic Accuracy [25] criteria. The current study received the ap-proval of the local institutional review board. Written in-formed consent was obtained from each participant or a family member at the time of enrollment.
Specimen and data collection
At the time of ICU admission, urine and blood samples were collected immediately. For patients from the partici-pating hospital, urine samples were shipped by cold chain transportation and examined at the clinical laboratory of the Guangdong Provincial People’s Hospital within 24 h after collection. We measured the level of serum creatin-ine (sCr), uNAG, serum glucose, and glycosylated hemoglobin (Hb1Ac) at the time of ICU admission. uNAG and HbA1c were measured upon ICU admission. sCr and serum glucose were measured at ICU admission and daily as a part of routine clinical care during ICU stay. We prospectively collected the demographic and clinical characteristics of each patient, including sex, age, body mass index (BMI), preexisting chronic conditions, sepsis, the categories of diseases, Acute Physiology and Chronic Health Evaluation II score (APACHE II), previous applica-tion of antidiabetic drugs, baseline serum creatine, base-line estimated glomerular filtration rate (eGFR), and the outcomes. The eGFR of patient was calculated using the abbreviated Modification of Diet in the Renal Disease for-mula [26]. The hourly urine output was also recorded.
Biomarker assays
Creatinine, uNAG, and serum glucose were analyzed using the UniCel DxC 800 Synchron System (Beckman Coulter, Brea, CA, USA). The values of uNAG were nor-malized to that of the urinary creatinine concentrations. The coefficients of interassay and intraassay variation for uNAG were both ≤10%. HbA1c was measured using the D-10™ Hemoglobin Analyzer (Bio-Rad, Hercules, CA, USA). The normal range for HbA1c was 3.8–18.5%.
Data definitions
(26.5μmol/L) from baseline within 48 h, or more than 1.5-fold increase in sCr levels from baseline within 7 days, or urine output < 0.5 mL/kg/h for 6 h. KDIGO stage 2 or stage 3 within 7 days after ICU admission were considered as severe AKI. The baseline sCr was defined as following rules in sequence as described in previous study [28]: if patients had serum creatine value before ICU admission, (1) the most recent pre-ICU value (between 30 and 365 days before ICU admission); (2) for patients aged < 40 years, a stable pre-ICU value > 365 days before ICU admission (stable defined as within 15% of the lowest ICU measurement); (3) pre-ICU value (> 365 days before ICU admission) and less than the initial sCr at ICU admission; (4) a pre-ICU value (between 3 and 39 days before ICU admission)≤initial sCr at the time of admission to ICU and not distinctly in AKI; if pa-tients did not have serum creatine value before ICU admission, (5) the lowest sCr upon initial admission value, the final ICU value, or the minimum value at follow-up unto 365 days.
Stratification protocol
All of the groups were preset. To evaluate the per-formance of uNAG for AKI detection with respect to the admission serum glucose in various degrees, the patients were stratified into five groups as described
previously [29]: < 110 mg/dL, 110 to < 140 mg/dL, 140 to < 170 mg/dL, 170 to < 200 mg/dL, and≥200 mg/dL. Patients were also divided into five quintiles based on the levels of serum glucose at the time of admission.
In order to detect the impact of HbA1c levels and history of diabetes on the accuracy of uNAG, patients were additionally stratified into four groups as de-scribed previously [30]: recognized diabetes (previous diagnosis of diabetes), undetected diabetes (with HbA1c ≥6.5% but no previous diagnosis of diabetes), prediabetes (5.7%≤HbA1c < 6.5% but no previous diagnosis of diabetes), and normal glycemic status (HbA1c < 5.7% but no previous diagnosis of diabetes). Patients were classified as having diabetes if they were diagnosed with diabetes or at least 1 prescription for insulin or an oral antidiabetic agent. Patients without a known history of diabetes and an HbA1c < 6.5% were defined as non-diabetic patients. The recognized and undetected diabetes were categorized as diabetic patients. Stress hyperglycemia was defined as serum glucose levels exceeding the threshold of 200 mg/dL in non-diabetic patients, in accordance with the con-sensus statement [31]. Likewise, diabetic patients were divided into two subgroups according to abovemen-tioned threshold of serum glucose. The diagnosis of sepsis was defined according to the American College of Chest Physicians/Society of Critical Care Medicine Consensus Conference Committee guidelines [32].
Statistical analysis
We calculated the sample size based on AKI incidence of 26.86%, which we determined in a chart review of 350 crit-ical patients (unpublished). According to the previous stud-ies [33,34], we estimated that a sample size requirement of 1415 patients was required, with a two-sided test (αerror = 5%; power = 80%). With an estimated loss of 10%, the final sample required will be 1557 patients at least. The Kolmo-gorov–Smirnov test was used to determine the normal
distribution of each variable. Continuous variables were presented as means ± standard deviation and medians (interquartile range). The categorical variables were expressed as counts and proportions. The non-normally distributed continuous variables were compared by Wil-coxon rank-sum test or Kruskal–Wallis test for one-way analysis of variance. To compare the categorical variables, the chi-square test or Fisher’s exact test was used. Bivari-ate correlation analysis was performed to examine the
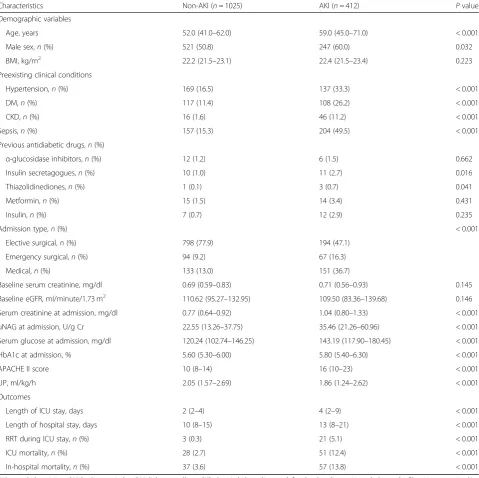
Table 1Baseline clinical data and outcomes
Characteristics Non-AKI (n= 1025) AKI (n= 412) Pvalue Demographic variables
Age, years 52.0 (41.0–62.0) 59.0 (45.0–71.0) < 0.001 Male sex,n(%) 521 (50.8) 247 (60.0) 0.032 BMI, kg/m2 22.2 (21.5–23.1) 22.4 (21.5–23.4) 0.223 Preexisting clinical conditions
Hypertension,n(%) 169 (16.5) 137 (33.3) < 0.001 DM,n(%) 117 (11.4) 108 (26.2) < 0.001 CKD,n(%) 16 (1.6) 46 (11.2) < 0.001 Sepsis,n(%) 157 (15.3) 204 (49.5) < 0.001 Previous antidiabetic drugs,n(%)
α-glucosidase inhibitors,n(%) 12 (1.2) 6 (1.5) 0.662 Insulin secretagogues,n(%) 10 (1.0) 11 (2.7) 0.016 Thiazolidinediones,n(%) 1 (0.1) 3 (0.7) 0.041 Metformin,n(%) 15 (1.5) 14 (3.4) 0.431 Insulin,n(%) 7 (0.7) 12 (2.9) 0.235
Admission type,n(%) < 0.001
Elective surgical,n(%) 798 (77.9) 194 (47.1) Emergency surgical,n(%) 94 (9.2) 67 (16.3) Medical,n(%) 133 (13.0) 151 (36.7)
Baseline serum creatinine, mg/dl 0.69 (0.59–0.83) 0.71 (0.56–0.93) 0.145 Baseline eGFR, ml/minute/1.73 m2
110.62 (95.27–132.95) 109.50 (83.36–139.68) 0.146 Serum creatinine at admission, mg/dl 0.77 (0.64–0.92) 1.04 (0.80–1.33) < 0.001 uNAG at admission, U/g Cr 22.55 (13.26–37.75) 35.46 (21.26–60.96) < 0.001 Serum glucose at admission, mg/dl 120.24 (102.74–146.25) 143.19 (117.90–180.45) < 0.001 HbA1c at admission, % 5.60 (5.30–6.00) 5.80 (5.40–6.30) < 0.001 APACHE II score 10 (8–14) 16 (10–23) < 0.001 UP, ml/kg/h 2.05 (1.57–2.69) 1.86 (1.24–2.62) < 0.001 Outcomes
Length of ICU stay, days 2 (2–4) 4 (2–9) < 0.001 Length of hospital stay, days 10 (8–15) 13 (8–21) < 0.001 RRT during ICU stay,n(%) 3 (0.3) 21 (5.1) < 0.001 ICU mortality,n(%) 28 (2.7) 51 (12.4) < 0.001 In-hospital mortality,n(%) 37 (3.6) 57 (13.8) < 0.001
AKIacute kidney injury,BMIbody mass index,DMdiabetes mellitus,CKDchronic kidney disease, defined as baseline estimated glomerular filtration rate < 60 ml/ min/1.73 m2
correlation between two variables. Multivariate linear re-gression was used to search for factors independently as-sociated with uNAG. The performance of uNAG was determined using the receiver operating characteristic (ROC) curve analysis. The differences between AUC were tested by Hanley–McNeil method [35]. The optimal cut-off values for AKI detection were defined for individ-ual biomarkers using Youden’s index based on which the sensitivity and specificity were calculated.
All statistical tests were 2-tailed, andP< 0.05 was con-sidered statistically significant. All analyses were per-formed using SPSS 13.0 (SPSS, Chicago, IL, USA) or MedCalc version 12.5.0 (MedCalc Software, Ostend, Belgium) software.
Results
Patient characteristics
Of 1585 consecutive admitted patients from three general ICUs, 148 patients (9.3%) were excluded according to the exclusion criteria (Fig.1). Of the remaining 1437 subjects, AKI was diagnosed in 412 patients (28.7%). Table 1 pre-sents the baseline clinical data and outcomes of the en-rolled patients. Compared to the non-AKI patients, those
with AKI were older with high rates of preexisting clinical conditions, including diabetes mellitus (DM), hyperten-sion, and chronic kidney disease (CKD). Diabetes was pre-sented in 225 patients of the entire cohort, including 127 undetected diabetes patients. Patients with AKI had higher concentrations of sCr and serum glucose at the time of ICU admission. Moreover, the concentrations of uNAG were significantly higher in the AKI group than in the non-AKI group.
Baseline factors related to uNAG
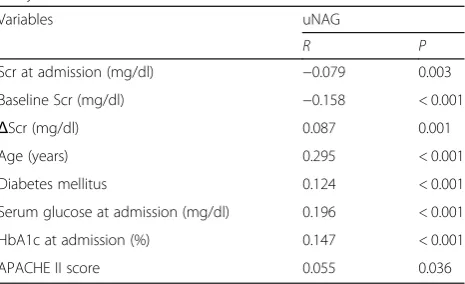
Bivariate correlation analysis (Table2) showed that a high level of uNAG was associated with older age, higher APA-CHE II score, and a remarkable change between the levels of initial sCr and baseline sCr. In addition, a positive cor-relation was established between uNAG and diabetes mel-litus (r= 0.124,P< 0.001) as well as HbA1c (r= 0.147,P< 0.001) and a positive association between uNAG and ad-mission glucose (r= 0.196, P< 0.001). In multivariate re-gression (Table3), age (standardizedβ= 0.187,P< 0.001), baseline sCr (standardized β=−0.093, P< 0.001), △sCr (standardizedβ= 0.089,P< 0.001), and admission glucose (standardized β= 0.147, P< 0.001) were significantly cor-related with the levels of uNAG.
Performance of uNAG for AKI detection with respect to serum glucose stratification
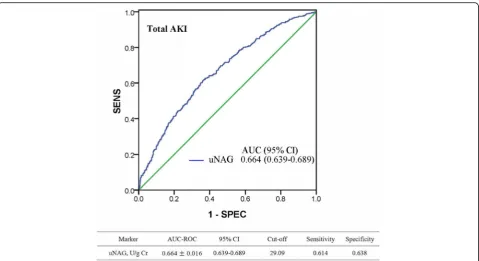
ROC analysis revealed that uNAG detected total AKI with poor-to-moderate discrimination capability (Fig. 2). The AUC-ROC value of uNAG for detecting total AKI was 0.664 [95% confidence interval: 0.639–0.689]. To evaluate the impact of admission serum glucose levels on the ac-curacy of uNAG to detect AKI, an AUC-ROC value was calculated in each group of admission serum glucose: < 110 mg/dL, 110 to < 140 mg/dL, 140 to < 170 mg/dL, 170 to < 200 mg/dL, and > 200 mg/dL (Table4); no significant difference was observed in AUCs between any two groups. Similarly, no significant difference was observed in AUCs for severe AKI detection between any two groups (P> 0.05). In addition, we evaluated the AUCs of uNAG on the diagnosis of total AKI and severe AKI in each quintile of the level of admission serum glucose (Additional file1: Table S1). There was no significant difference in the AUC between any two sub- cohorts.
Performance of uNAG for AKI detection in stress hyperglycemia stratification
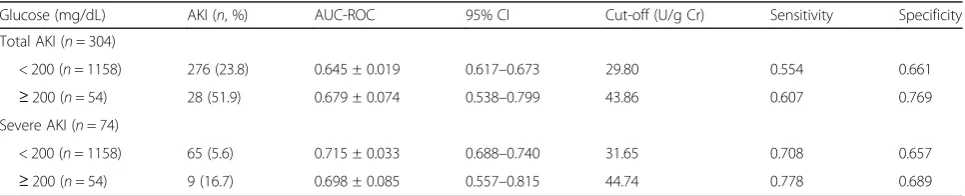
Among the non-diabetic patients, AUCs was calculated as 0.679 and 0.645 in patients with and without stress hyper-glycemia, respectively (Table5). The optimal cut-off value of uNAG for total AKI detection between stress hypergly-cemia and non-hyperglyhypergly-cemia patients was markedly dif-ferent (43.86 and 29.80 U/g Cr, respectively). In addition, the median concentration of uNAG for AKI patients with
Table 2Factors associated with uNAG by bivariate correlation analysis
Variables uNAG
R P
Scr at admission (mg/dl) −0.079 0.003 Baseline Scr (mg/dl) −0.158 < 0.001
ΔScr (mg/dl) 0.087 0.001 Age (years) 0.295 < 0.001 Diabetes mellitus 0.124 < 0.001 Serum glucose at admission (mg/dl) 0.196 < 0.001 HbA1c at admission (%) 0.147 < 0.001 APACHE II score 0.055 0.036
uNAGurinary N-acetyl-glucosaminidase,Scrserum creatinine concentration,
ΔScrthe change between admission Scr and baseline Scr,HbA1cglycosylated hemoglobin,APACHE IIAcute Physiology and Chronic Health Evaluation score
Table 3Factors associated with uNAG in multivariate linear regression
Independent Variablesa uNAG
Standardizedβ P Baseline Scr (mg/dl) −0.093 < 0.001
ΔScr (mg/dl) 0.089 0.001 Age (years) 0.187 < 0.001 Serum glucose at admission (mg/dl) 0.147 < 0.001
a
stress hyperglycemia was 46.15 U/g Cr (29.89–63.13), which was significantly different from non-stress hypergly-cemia patients with the value 32.98 U/g Cr (19.10–57.08) (Additional file 2: Figure S1). Furthermore, uNAG exhib-ited marked difference optimal cut-off value for detecting severe AKI between these two subgroups (44.74 and 31.65 U/g Cr, respectively). However, the optimal cut-off values of uNAG for detecting AKI in diabetic patients be-tween these abovementioned subgroups were similar (Additional file3: Table S2).
Performance of uNAG for AKI detection in HbA1c stratification
To evaluate the influence of HbA1c levels and history of diabetes on the performance of uNAG in the detection of AKI; the level of HbA1c at the time of ICU admission was measured. Patients were divided into four groups according to the HbA1c levels and history of diabetes (Additional file 4: Table S3). Patients with a known pre-vious history of diabetes were defined as recognized dia-betes. Patients without known previous history of diabetes were further divided into three groups. The AUC for total AKI detection was calculated as 0.675 in a sub-cohort of recognized diabetes. In patients without a known previous history of diabetes, the AUC was calcu-lated as 0.649 in the sub-cohort with HbA1c ≥6.5%, 0.645 in the sub-cohort with 5.7%≤HbA1c < 6.5%, and 0.659 in the sub-cohort with HbA1c < 5.7%, respectively. The AUC for uNAG in detecting severe AKI in each
group were as follows: 0.731 in group of recognized dia-betes, 0.704 in group of unrecognized diadia-betes, 0.700 in group with 5.7%≤HbA1c < 6.5% and 0.734 in group with HbA1c < 5.7%. In addition, we also evaluated the AUCs of uNAG on the discrimination ability of AKI in each quartile of HbA1c levels (Additional file 5: Table S4). Similar results were observed, and no significant dif-ference was observed in the AUC for AKI or severe AKI detection between any two groups.
Discussion
In this large-scale multicenter prospective real-world study, we did not find any significant impact of blood glucose levels regarding the performance of uNAG for AKI detection in critically ill adults. However, the opti-mal cut-off value of uNAG to detect AKI was affected by stress hyperglycemia in non-diabetic patients.
uNAG is an early tubular damage biomarker that can predict AKI and adverse outcomes [36,37]. Although an increased uNAG excretion reflects the acute tubular in-jury [38], uNAG levels are also elevated in different con-ditions other than AKI, such as diabetes mellitus [39]. uNAG was detected as increased in the early stages of diabetes mellitus even before any clinical evidence of renal involvement was presented [40]. Recent studies re-vealed that blood glucose levels might increase the ex-cretion of uNAG [17]. On the other hand, uNAG might reflect the glycemic control in insulin-dependent dia-betic patients [41,42]. Another study found a significant
correlation between high uNAG values and HbA1c [43]. Moreover, diabetes and hyperglycemia, both common in critically ill patients [22,23], are associated with the de-velopment of AKI [29,44,45]. Therefore, we undertook this prospective study to evaluate the effect of blood
glucose levels on the performance of uNAG to identify AKI in ICU patients.
Herein, we found significant but weak correlations tween admission serum glucose level and uNAG and be-tween HbA1c and uNAG. However, the present study
Table 4AUCs for AKI stratified according to admission serum glucose concentrations
Glucose (mg/dl) AKI(n, %) AUC-ROC 95% CI Cut-off (U/g Cr) Sensitivity Specificity Total AKI (n= 412)
<110 (n= 448) 77 (17.2) 0.643 ± 0.034 0.597–0.687 21.04 0.727 0.496 110 to < 140 (n= 468) 119 (25.4) 0.645 ± 0.029 0.600–0.689 28.47 0.546 0.673 140 to < 170 (n= 275) 93 (33.8) 0.639 ± 0.036 0.579–0.696 32.89 0.613 0.654 170 to < 200 (n= 123) 51 (41.5) 0.634 ± 0.052 0.543–0.719 29.80 0.726 0.569
≥200 (n= 123) 72 (58.5) 0.651 ± 0.052 0.560–0.735 28.03 0.778 0.549 Severe AKI (n= 109)
<110 (n= 448) 18 (4.0) 0.703 ± 0.068 0.658–0.745 38.37 0.667 0.770 110 to < 140 (n= 468) 27 (5.8) 0.756 ± 0.048 0.714–0.794 31.65 0.778 0.687 140 to < 170 (n= 275) 28 (10.2) 0.679 ± 0.049 0.621–0.734 33.95 0.750 0.615 170 to < 200 (n= 123) 13 (10.6) 0.680 ± 0.086 0.590–0.762 49.25 0.616 0.736
≥200 (n= 123) 23 (18.7) 0.703 ± 0.054 0.614–0.782 35.01 0.870 0.560
AUCarea under the receiver operating characteristic curve,AKIacute kidney injury,nsample size, 95% CI, 95% confidence interval Total AKI:
< 110 mg/dl versus 110 to < 140 mg/dl Z = 0.045,P= 0.964 < 110 mg/dl versus 140 to < 170 mg/dl Z = 0.081,P= 0.935 < 110 mg/dl versus 170 to < 200 mg/dl Z = 0.145,P= 0.885 < 110 mg/dl versus≥200 mg/dl Z = 0.129,P= 0.897
110 to < 140 mg/dl versus 140 to < 170 mg/dl Z = 0.131,P= 0.895 110 to < 140 mg/dl versus 170 to < 200 mg/dl Z = 0.185,P= 0.853 110 to < 140 mg/dl versus≥200 mg/dl Z = 0.102,P= 0.919 140 to < 170 mg/dl versus 170 to < 200 mg/dl Z = 0.079,P= 0.937 140 to < 170 mg/dl versus≥200 mg/dl Z = 0.192,P= 0.848 170 to < 200 mg/dl versus≥200 mg/dl Z = 0.232,P= 0.816 Severe AKI:
< 110 mg/dl versus 110 to < 140 mg/dl Z = 0.635,P= 0.525 < 110 mg/dl versus 140 to < 170 mg/dl Z = 0.287,P= 0.774 < 110 mg/dl versus 170 to < 200 mg/dl Z = 0.210,P= 0.834 < 110 mg/dl versus≥200 mg/dl Z = 0,P= 1
110 to < 140 mg/dl versus 140 to < 170 mg/dl Z = 1.125,P= 0.261 110 to < 140 mg/dl versus 170 to < 200 mg/dl Z = 0.773,P= 0.440 110 to < 140 mg/dl versus≥200 mg/dl Z = 0.734,P= 0.463 140 to < 170 mg/dl versus 170 to < 200 mg/dl Z = 0.010,P= 0.992 140 to < 170 mg/dl versus≥200 mg/dl Z = 0.331,P= 0.740 170 to < 200 mg/dl versus≥200 mg/dl Z = 0.227,P= 0.820
Table 5AUCs for AKI stratified according to admission serum glucose in non-diabetic patients
Glucose (mg/dL) AKI (n, %) AUC-ROC 95% CI Cut-off (U/g Cr) Sensitivity Specificity Total AKI (n= 304)
< 200 (n= 1158) 276 (23.8) 0.645 ± 0.019 0.617–0.673 29.80 0.554 0.661
≥200 (n= 54) 28 (51.9) 0.679 ± 0.074 0.538–0.799 43.86 0.607 0.769 Severe AKI (n= 74)
< 200 (n= 1158) 65 (5.6) 0.715 ± 0.033 0.688–0.740 31.65 0.708 0.657
≥200 (n= 54) 9 (16.7) 0.698 ± 0.085 0.557–0.815 44.74 0.778 0.689
AUCarea under the receiver operating characteristic curve,AKIacute kidney injury,nsample size, 95% CI,95% confidence interval Total AKI:
≥200 mg/dL versus < 200 mg/dL Z = 0.444,P= 0.657 Severe AKI:
showed that uNAG did not yield any significant differ-ence in AUC for AKI detection among different blood glucose levels, either stratified based on the admission serum glucose or HbA1c. These results strongly sug-gested that blood glucose did not interfere with the per-formance of uNAG in the detection of AKI in critically ill adults. Thus, our findings supported the clinical ap-plicability of uNAG in patients with diabetes or predia-betes. To the best of our knowledge, the present study illustrated for the first time that there was no significant impact of blood glucose on the diagnostic accuracy of uNAG in the detection of AKI in the ICU settings based on a large-scale cohort.
The present study did not display a significant dis-crimination ability of uNAG among patients with differ-ent glucose levels. However, the optimal cut-off value of uNAG could be affected by stress hyperglycemia among non-diabetic patients. The current study indicated that the optimal cut-off value of uNAG to detect AKI was markedly higher in those with stress hyperglycemia as compared to without stress hyperglycemia. Thus, this characteristic should be considered when using uNAG to identify AKI in stress hyperglycemia patients. Previ-ous studies [17, 20] reported a rapid change in the uNAG levels in response to the short-term fluctuation of blood glucose, which might be attributed to stress hyperglycemia-induced stimulation of uNAG production in non-diabetic patients. However, a similar result was not observed in the diabetic cohort. The possible reason may be that, in diabetic patients, the elevated blood glu-cose concentrations is partly due to poor glycemic con-trol but not reflecting a short-term increment of blood glucose. This result implies that the most reasonable cut-off point for stress hyperglycemia in diabetic cohort needs to be established.
Nevertheless, the present study has some limitations. Firstly, we used uNAG to detect the total AKI rather than predict AKI, ascribing to the relatively small num-ber of new AKI cases. Secondly, we used the admission serum glucose level rather than continuous blood glu-cose variability to evaluate the hypothesis. Thus, add-itional studies are essential for substantiating the results.
The advantages of this study include its appropriate sample size and a multicenter prospective design that allow the retrieval of real-world data and potentially bet-ter data quality as compared to the retrospective designs. Due to the stability of uNAG [46], specific guidelines for urine sample collection, transportation, and unified measurement strategy were followed for uNAG, which is expected to have reduced the systemic errors.
Conclusion
In this multicenter, prospective, observational study, we found that blood glucose levels might not exert a significant
impact on the performance of uNAG to detect AKI in ICU patients. However, the optimal cut-off value of uNAG in detecting AKI could be affected by stress hyperglycemia in non-diabetic patients.
Additional files
Additional file 1: Table S1.Performance of uNAG in detecting AKI in quintile of admission serum glucose concentrations. (DOC 43 kb)
Additional file 2: Figure S1.Concentration of uNAG for non-diabetic patients stratified according to admission serum glucose. (TIF 327 kb)
Additional file 3: Table S2.AUCs for AKI stratified according to admission serum glucose in diabetic patients. (DOC 35 kb)
Additional file 4: Table S3.AUCs for AKI stratified according to HbA1c levels and history of diabetes. (DOC 51 kb)
Additional file 5: Table S4.Performance of NAG in detecting AKI by quartile of HbA1c. (DOC 40 kb)
Abbreviations
5% CI:95% confidence interval; AKI: Acute kidney injury; APACHE II: Acute Physiology and Chronic Health Evaluation II score; AUC: Area under the receiver operating characteristic curve; BMI: Body mass index; CKD: Chronic kidney disease, defined as baseline estimated glomerular filtration rate < 60 ml/min/1.73 m2; DM: Diabetes mellitus; eGFR: Estimated glomerular filtration rate; ESRD: End-stage renal disease; HbA1c: Glycosylated hemoglobin; ICU: Intensive care unit; n: Sample size; ROC: Receiver operating characteristic curve; RRT: Renal replacement therapy; sCr: Serum creatinine; uNAG: Urinary N-acetyl-β-D-glucosamindase; UP: Urine production first 24 h after admission
Acknowledgements
The authors are grateful to doctors and nurses for collection and testing of urine and blood samples. We also thank the patients involved at the three centers for their dedication in the study.
Funding
The study was supported by grants from National Natural Science Foundation of China (81,671,963 to C.B.C), the Science and Technology Planning Project of Guangdong Province (Key Program) (2014B020212023 to C.B.C), National Science and Technology Support Program (2015BAI12B07 to C.B.C), and the Science and Technology Planning Project of Guangdong Province (2016A020215129 to Y.J.D.). All funders have no role in the design of the study, data collection, analysis, interpretation of data and in writing the manuscript.
Availability of data and materials
The datasets generated and/or analyzed during this study are not publicly available, owing to currently ongoing research studies, but the data are available from the corresponding author on reasonable request.
Authors’contributions
LW, YD and YZ equally contributed to the design of the research and interpretation of the data. CC, LW, YD and YZ contributed to the conception and design of the research as well as interpretation of the data, and critically revised the manuscript. LW, YD, YZ, FX, JL, DZ, LG, YH, XOY, LH, RC, HY, and JY performed the research and collected data. LW, YD and YZ analyzed the data. All authors contributed to the acquisition and analysis of the data, drafted the manuscript, and agree to be fully accountable for ensuring the integrity and accuracy of the work. All authors read and approved the final manuscript.
Ethics approval and consent to participate
Consent for publication
Not applicable. No individual personal data are included in the study. All patients provided necessary consent to participate in the present study.
Competing interests
The authors declare that they have no competing interests.
Publisher’s Note
Springer Nature remains neutral with regard to jurisdictional claims in published maps and institutional affiliations.
Author details
1Department of Intensive Care Unit of Cardiovascular Surgery, Guangdong
Cardiovascular Institute, Guangdong Provincial People’s Hospital, Guangdong Academy of Medical Sciences, Guangzhou 510080, Guangdong Province, China.2Department of Critical Care Medicine, Guangdong Provincial People’s Hospital, Guangdong Academy of Medical Sciences, 96 Dongchuan Road, Guangzhou 510080, Guangdong Province, China.3Department of Emergency
Medicine, Shandong University Qilu Hospital, Jinan 250012, Shandong Province, China.4Department of Clinical Laboratory, Guangdong Provincial People’s Hospital, Guangdong Academy of Medical Sciences, Guangzhou 510080, Guangdong Province, China.5Department of Critical Care Medicine,
Guangzhou Nansha Central Hospital, Guangzhou 511400, Guangdong Province, China.6Department of Critical Care Medicine, Xiaolan Hospital of Southern Medical University, Zhongshan 528415, Guangdong Province, China.
Received: 5 January 2019 Accepted: 13 May 2019
References
1. Yamashita T, Doi K, Hamasaki Y, et al. Evaluation of urinary tissue inhibitor of metalloproteinase-2 in acute kidney injury: a prospective observational study. Crit Care. 2014;18:716.
2. Deng Y, Yuan J, Chi R, et al. The incidence, risk factors and outcomes of postoperative acute kidney injury in neurosurgical critically ill patients. Sci Rep. 2017;7:4245.
3. Zhang D, Gao L, Ye H, et al. Impact of thyroid function on cystatin C in detecting acute kidney injury: a prospective, observational study. BMC Nephrol. 2019;20:41.
4. Thakar CV, Christianson A, Freyberg R, et al. Incidence and outcomes of acute kidney injury in intensive care units: a veterans administration study. Crit Care Med. 2009;37:2552–8.
5. Bagshaw SM, Laupland KB, Doig CJ, et al. Prognosis for long-term survival and renal recovery in critically ill patients with severe acute renal failure: a population-based study. Crit Care. 2005;9:R700–9.
6. Chertow GM, Burdick E, Honour M, et al. Acute kidney injury, mortality, length of stay, and costs in hospitalized patients. J Am Soc Nephrol. 2005; 16:3365–70.
7. Hoste EA, Clermont G, Kersten A, et al. RIFLE criteria for acute kidney injury are associated with hospital mortality in critically ill patients: a cohort analysis. Crit Care. 2006;10:R73.
8. Xu X, Nie S, Liu Z, et al. Epidemiology and clinical correlates of AKI in Chinese hospitalized adults. Clin J Am Soc Nephrol. 2015;10:1510–8. 9. Zarbock A, Kellum JA, Schmidt C, et al. Effect of early vs delayed initiation of
renal replacement therapy on mortality in critically ill patients with acute kidney injury: the ELAIN randomized clinical trial. Jama. 2016;315:2190–9. 10. Ostermann M, Joannidis M. Acute kidney injury 2016: diagnosis and
diagnostic workup. Crit Care. 2016;20:299.
11. Vaidya VS, Waikar SS, Ferguson MA, et al. Urinary biomarkers for sensitive and specific detection of acute kidney injury in humans. Clin Transl Sci. 2008;1:200–8.
12. Cheng B, Jin Y, Liu G, et al. Urinary N-acetyl-beta-D-glucosaminidase as an early marker for acute kidney injury in full-term newborns with neonatal hyperbilirubinemia. Dis Markers. 2014;2014:315843.
13. Doi K, Negishi K, Ishizu T, et al. Evaluation of new acute kidney injury biomarkers in a mixed intensive care unit. Crit Care Med. 2011;39:2464–9. 14. Peng ZY. The biomarkers for acute kidney injury: a clear road ahead? J
Transl Int Med. 2016;4:95–8.
15. Jung K, Hempel A, Grutzmann KD, et al. Age-dependent excretion of alanine aminopeptidase, alkaline phosphatase,
gamma-glutamyltransferase and N-acetyl-beta-D-glucosaminidase in human urine. Enzyme. 1990;43:10–6.
16. Doi K, Noiri E, Nangaku M, et al. Repulsive guidance cue semaphorin 3A in urine predicts the progression of acute kidney injury in adult patients from a mixed intensive care unit. Nephrol Dial Transplant. 2014;29:73–80. 17. Kim SR, Lee YH, Lee SG, et al. Urinary N-acetyl-beta-D-glucosaminidase, an early
marker of diabetic kidney disease, might reflect glucose excursion in patients with type 2 diabetes. Medicine. 2016;95:e4114.
18. Ellis EN, Brouhard BH, Lagrone L, et al. Urinary excretion of N-acetyl-beta-D-glucosaminidase in children with type I diabetes mellitus. Diabetes Care. 1983;6:251–5.
19. Ouchi M, Suzuki T, Hashimoto M, et al. Urinary N-acetyl-beta-D-glucosaminidase levels are positively correlated with 2-hr plasma glucose levels during oral glucose tolerance testing in prediabetes. J Clin Lab Anal. 2012;26:473–80. 20. Brouhard BHLL, Travis LB, Pollard TG. Response of urinary
N-acetyl-beta-D-glucosaminidase to rapid decreases in blood glucose. Clin Chim Acta. 1984;140(2):197–202.
21. Naohito Ishii ZO, Aoki Y, Saruta T, Suga T. Effects of renal sorbitol accumulation on urinary excretion of enzymes in hyperglycaemic rat. Ann Clin Biochem. 2001;38:391–8.
22. Smith FG, Sheehy AM, Vincent JL, et al. Critical illness-induced dysglycaemia: diabetes and beyond. Crit Care. 2010;14:327. 23. Plummer MP, Bellomo R, Cousins CE, et al. Dysglycaemia in the
critically ill and the interaction of chronic and acute glycaemia with mortality. Intensive Care Med. 2014;40:973–80.
24. von Elm E, Altman DG, Egger M, et al. The strengthening the reporting of observational studies in epidemiology (STROBE) statement: guidelines for reporting observational studies. Ann Intern Med. 2007;147:573–7. 25. Bossuyt PM, Reitsma JB, Bruns DE, et al. Toward complete and accurate
reporting of studies of diagnostic accuracy: the STARD initiative. Acad Radiol. 2003;10:664–9.
26. Levey AGT, Kusek J, Beck G. A simplified equation to predict glomerular filtration rate from serum creatinine. J Am Soc Nephrol. 2000;11:A0828. 27. Kidney Disease Improving Global Outcomes (KDIGO). Acute Kidney Injury
Work Group KDIGO clinical practice guideline for acute kidney injury. Kidney Int Suppl. 2012;2:1–138.
28. Deng Y, Chi R, Chen S, et al. Evaluation of clinically available renal biomarkers in critically ill adults: a prospective multicenter observational study. Crit Care. 2017;21:46.
29. Stolker JM, McCullough PA, Rao S, et al. Pre-procedural glucose levels and the risk for contrast-induced acute kidney injury in patients undergoing coronary angiography. J Am Coll Cardiol. 2010;55:1433–40.
30. Gillett MJ. International Expert Committee report on the role of the A1c assay in the diagnosis of diabetes. Diabetes Care. 2009;32(7):1327–34 The Clinical biochemist Reviews 2009; 30: 197–200.
31. Dungan KM, Braithwaite SS, Preiser JC. Stress hyperglycaemia. Lancet (London, England). 2009;373:1798–807.
32. Bone RC, Balk RA, Cerra FB, et al. Definitions for sepsis and organ failure and guidelines for the use of innovative therapies in sepsis. The ACCP/SCCM consensus conference committee. American College of Chest Physicians/ Society of Critical Care Medicine. Chest. 1992;101:1644–55.
33. Obuchowski NA. Prospective studies of diagnostic test accuracy when disease prevalence is low. Biostatistics. 2002;3:477–92.
34. Li J, Fine J. On sample size for sensitivity and specificity in prospective diagnostic accuracy studies. Stat Med. 2004;23:2537–50.
35. Hanley JA, McNeil BJ. A method of comparing the areas under receiver operating characteristic curves derived from the same cases. Radiology. 1983;148:839–43.
36. Sprenkle P, Russo P. Molecular markers for ischemia, do we have something better then creatinine and glomerular filtration rate? Arch Esp Urol. 2013;66:99–114.
37. Liangos O, Perianayagam MC, Vaidya VS, et al. Urinary N-acetyl-beta-(D)-glucosaminidase activity and kidney injury molecule-1 level are associated with adverse outcomes in acute renal failure. J Am Soc Nephrol. 2007;18: 904–12.
38. Price RG. The role of NAG (N-acetyl-beta-D-glucosaminidase) in the diagnosis of kidney disease including the monitoring of nephrotoxicity. Clin Nephrol. 1992;38(Suppl 1):S14–9.
40. Csathy L, Pocsi I. Urinary N-acetyl-beta-D-glucosaminidase determination in newborns and children: methods and diagnostic applications. Eur J Clin Chem Clin Biochem. 1995;33:575–87.
41. Hsiao PH, Tsai WS, Tsai WY, et al. Urinary N-acetyl-beta-D-glucosaminidase activity in children with insulin-dependent diabetes mellitus. Am J Nephrol. 1996;16:300–3.
42. Kordonouri O, Hartmann R, Muller C, et al. Predictive value of tubular markers for the development of microalbuminuria in adolescents with diabetes. Horm Res. 1998;50(Suppl 1):23–7.
43. Mungan N, Yuksel B, Bakman M, et al. Urinary
N-acetyl-beta-D-glucosaminidase activity in type I diabetes mellitus. Indian Pediatr. 2003;40: 410–4.
44. Oezkur M, Wagner M, Weismann D, et al. Chronic hyperglycemia is associated with acute kidney injury in patients undergoing CABG surgery--a cohort study. BMC Cardiovasc Disord. 2015;15:41.
45. McCullough PA, Shaw AD, Haase M, et al. Diagnosis of acute kidney injury using functional and injury biomarkers: workgroup statements from the tenth acute Dialysis quality initiative consensus conference. Contrib Nephrol. 2013;182:13–29.