R E S E A R C H
Open Access
Sequence analysis and variant identification
at the
APOC3
gene locus indicates
association of rs5218 with BMI in a sample
of Kuwaiti
’
s
Zainab H. Malalla
1, Ahmad E. Al-Serri
2, Huda M. AlAskar
1, Wafaa Y. Al-Kandari
1and Suzanne A. Al-Bustan
1*Abstract
Background:APOC3 is important in lipid transport and metabolism with limited studies reporting genetic sequence variations in specific ethnic groups. The present study aimed to analyze the fullAPOC3sequence among Kuwaiti Arabs and test the association of selected variants with lipid levels and BMI.
Methods:Variants were identified by Sanger sequencing the entireAPOC3gene in 100 Kuwaiti Arabs. Variants and their genotypes were fully characterized and used to construct haplotype blocks. Four variants (rs5128, rs2854117, rs2070668, KUAPOC3N3 g.5196 A > G) were selected for testing association with serum lipid levels and BMI in a cohort (n= 733).
Results:APOC3sequence (4.3 kb) of a Kuwaiti Arab was deposited in Genbank (accession number KJ437193). Forty-two variants including 3 novels were identified including an“A”insertion at genomic positions 116,700,599–116,700, 600 (promoter region) and two substitutions in intron 1 at genomic positions 116,700,819 and 116,701,159. Only three variants, (rs5128, rs2854117, and rs2070668) were analyzed for association of which rs5128 showed a trend for association with increased BMI, TG and VLDL levels that was further investigated using multivariate analysis. A significant association of rs5128 with BMI (p< 0.05) was observed following a dominant genetic model with increased risk by an OR of 4.022 (CI: 1.13–14.30).
Conclusion:The present study is the first to report sequence analysis ofAPOC3in an Arab ethnic group. This study supports the inclusion of rs5128 as a marker for assessing genetic risk to dyslipidemia and obesity and the inclusion of the novel variant g.5196 A > G for population stratification of Arabs.
Keywords:APOC3, Sequence variants, Genetic association, Lipid levels, BMI, Arabs
Introduction
Apolipoprotein C3 (APOC3) has been implicated as an important candidate gene involved in plasma lipid level variation and other metabolic abnormalities. TheAPOC3 gene resides within the APOA5-APOA4-APOC3-APOA1 multi-gene cluster on human chromosome 11q23 [1]. TheAPOC3gene is 3367 bp comprising 4 exons that en-code a 99 amino acid glycoprotein which is synthesized mostly in the liver and to a lesser degree in the intestine,
where it undergoes intracellular cleavage of 20-aminoacid-residue signal peptide yielding the mature 79 amino acid APOC3 [2]. APOC3 is a major protein constituent of triglyceride-rich lipoproteins (TRLs) including very low-density lipoprotein (VLDL), and chylomicron (CM) wherein it has a principal role in the regulation of trigly-ceride rich lipoproteins (TRL) catabolism [3]. APOC3 impairs lipolysis of TRL by inhibiting lipoprotein lipase (LPL) and the hepatic uptake of TRLs by remnant recep-tors. High circulating concentration of APOC3 was shown to be associated with increased levels of triglycerides (TG) in blood [4,5] and in metabolic disorders including dyslip-idemia [6, 7]. Dyslipidemia covers a broad spectrum of
© The Author(s). 2019Open AccessThis article is distributed under the terms of the Creative Commons Attribution 4.0 International License (http://creativecommons.org/licenses/by/4.0/), which permits unrestricted use, distribution, and reproduction in any medium, provided you give appropriate credit to the original author(s) and the source, provide a link to the Creative Commons license, and indicate if changes were made. The Creative Commons Public Domain Dedication waiver (http://creativecommons.org/publicdomain/zero/1.0/) applies to the data made available in this article, unless otherwise stated.
* Correspondence:[email protected]
1Department of Biological Sciences, Faculty of Science, Kuwait University,
Kuwait, Kuwait
lipid abnormalities including elevated levels of plasma triglyceride (TG) and total cholesterol (TC), an increase in intermediate-density lipoprotein (IDL), presence of small dense low-density lipoprotein (LDL) particles, and a de-creased level of high-density lipoprotein (HDL) [8]. Herit-ability studies revealed a strong genetic component to dyslipidemia, ranging from 0.20 to 0.60 in which these estimates are likely reflecting contributions from numer-ous gene variants includingAPOC3[9–14].
The important role of APOC3 in lipid transport and metabolism deems it necessary to reveal the full genetic profile of single nucleotide polymorphisms (SNPs) at this locus and how they may correlate to inter-ethnic suscep-tibility of dyslipidemia and other metabolic abnormal-ities. Most of the genetic variants studied in theAPOC3 gene are localized in the promoter region including the five common DNA polymorphisms (C-641A, G-630A, T-625 deletion, C-482 T, and T-455C) that show a minor allelic frequency of about 40% in the general population [15–18]. Sequence analysis of the full locus may provide an effective opportunity to assess the full spectrum of variants and how they may influence plasma lipid levels including both common and rare variants. Recently, exome sequencing of the APOCIII gene locus identified rare loss of function mutations associated with lower triglyceride levels in a large cohort [19]. Very few studies have investigated the role ofAPOC3 in the gen-etic predisposition to variation in lipid levels among Arabs [20] and none have reported full sequence analysis of theAPOC3gene locus in any Arab population (as far as our knowledge) while limited studies reported se-quence analysis on Asians [21].
This paper aimed to investigate sequence variation at the APOC3gene locus to identify potential variants that may contribute to the variation in lipid levels and specif-ically the genetic profile of an Arab population. This study was based on the hypothesis that there are genetic variants that vary in their frequency between different human populations so a common SNP in one ethnic population could be rare in another. Moreover, some
APOC3SNPs could be significantly associated with vari-ation in lipid levels but are dependent on ethnicity. Therefore, the data generated in this study may allow better identification and selection of associated variants with variation in serum lipid levels and/or BMI.
Methods Study population
This study involved two sample phases. The first was se-quencing DNA samples from 100 apparently healthy subjects (50 females and 50 males) with Arabian origin from the Kuwaiti population. The age of the subjects ranged from 18 to 69 with an average age of 30.42 years. The BMI of the subjects ranged from 19 to 30 with an
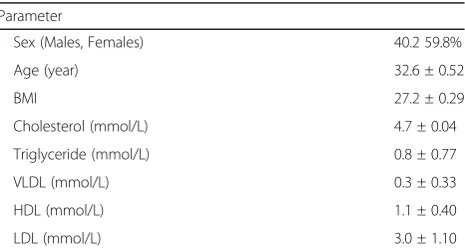
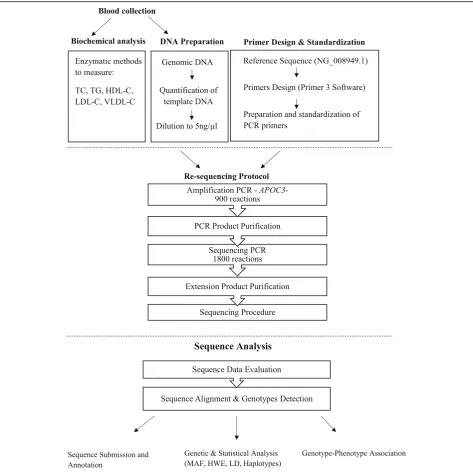
average BMI of 23.946 kg/m. The samples included Kuwait Arabs with normal lipid levels. Each sample had documented phenotypic data including medical and family history of hypertension, hypertriglyceridemia, hypercholesterolemia, diabetes and cardiovascular dis-eases as well as a pedigree with ethnic background. The pedigree was used to trace the ethnic background of both paternal and maternal lineages back at least four generations. The second phase involved 633 samples of the general the Kuwaiti population for the association of selected variants and validation of the novel variants making the cohort for the genetic association study to 733. Random Kuwaitis were recruited during routine check-up at different governmental hospitals around Kuwait. The inclusion criteria included participants who are Kuwaiti natives with documented ancestry and were above the age of 18 years. The exclusion criteria were those with documented diagnosis of diabetes mellitus type 2, hypertension and heart disease. The study popu-lation consisted of 438 females and 295 males. The age of the subjects ranged from 18 to 76. Demographic in-formation, along with detailed personal medical and family history from all the participants (Table1). The in-clusion criteria included participants who are Kuwaiti natives with documented ancestry and were above the age of 18 years. The exclusion criteria were those with documented diagnosis of diabetes mellitus type 2 and/or hypertension. All the participants in this study were de-void of diabetes and/or hypertension. A summary of the procedures followed on the collected blood samples is il-lustrated in Fig.1.
Collection of blood samples and biochemical analysis
Venous blood samples were taken after a 12-h fast. The levels of serum TC, TG, HDL-C, and LDL-C were deter-mined by enzymatic methods with commercially avail-able kits and performed on a UniCel DxC 800 Synchron
Table 1Demographic and clinical features of the Kuwaiti cohort (n= 733)
Parameter
Sex (Males, Females) 40.2 59.8%
Age (year) 32.6 ± 0.52
BMI 27.2 ± 0.29
Cholesterol (mmol/L) 4.7 ± 0.04
Triglyceride (mmol/L) 0.8 ± 0.77
VLDL (mmol/L) 0.3 ± 0.33
HDL (mmol/L) 1.1 ± 0.40
LDL (mmol/L) 3.0 ± 1.10
Clinical System from Beckman Coulter (USA) in the Clinical Chemistry facility at Al-Amiri Hospital (Kuwait).
TC was measured using an enzymatic colorimetric method that breaks it down into water and quinon-imine red dye which is directly proportional to TC concentration. For TG, multienzymatic reaction using glycerol kinase, glycerol-3-phosphate oxidase and perox-idase was performed in a sequence to get a red dye. TG concentration is proportional to the intensity of the color generated and measured photometrically. For HDL-C measurement, a unique detergent was used that
is not only able to selectively solubilize cholesterol in HDL but also to inhibit its release from other lipopro-teins. Released HDL-C was then determined enzymati-cally using cholesterol esterase and cholesterol oxidase to produce a color product that could be measured at 560 nm. Friedewald formula was used to calculate the concentration of both LDL-C and VLDL-C (LDL-C = TC – HDL-C – (TG/2.2, VLDL-C = TG/2.2) [22]. The reference values used in this study are those set by Kuwait Ministry of Health where: TC = 3.0–5.17 mmol/ L, TG = 0.40–1.7 mmol/L, HDL-C = 0.91–2.5 mmol/L and LDL-C = 1.8–3.2 mmol/L.”
DNA extraction andAPOC3sequencing
Total genomic DNA was extracted from whole blood samples, based on the technique described by Miller using proteinase K and salting-out procedures [23]. The 3.4 Kb APOC3 gene along with the flanking sequences was amplified using nine sets of custom designed over-lapping primers (Primer3 Input software version 0.4.0: //Frodo.wi.mit.edu/). The primers and polymerase chain re-action (PCR) conditions are provided in Additional file 1: Table S1. DNA template was first amplified by PCR using Gen Amp® Fast PCR Master Mix in an Applied Biosystem Fast thermal cycler (Version 1.01, Life Technologies, USA) (Additional file 1: Table S2) followed by purification using NucleoSpin® Extract II (Clontech Laboratories, Inc., Version No. PR48598) Kit and formaldehyde denaturation. Sequen-cing reactions were performed on both DNA strands using BigDye X. Terminator v.1.1 Cycle Sequencing Kits (Additional file 1: Table S2). Sanger bidirectional se-quencing was performed using the Gene Analyzer 3130XL (Life Technologies, Applied Biosystems, USA), supported by ABI DNA Sequencing Analysis Software v5.2. The sequences from each pair of reaction were aligned together and checked for sequence accuracy using Clustal W pairwise sequence alignment. Multiple se-quence alignment among all samples were compared to the reference sequence (NG_008949.1) in the GenBank database (http://www.ncbi.nlm.nih.gov, NCBI) to identify all theAPOC3variants among the 100 Kuwaiti Arab sam-ples sequences.
Validation and association of common and novel SNPs identified
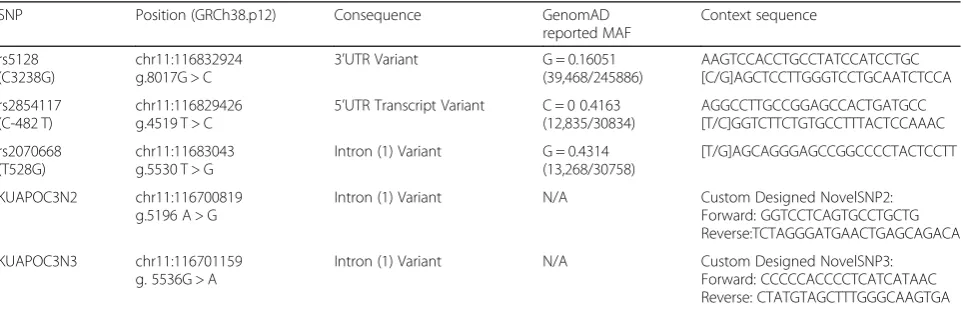
Three common SNPs (MAF > 0.05) identified (rs5128, rs2854117, and rs2070668) were selected for association analysis with variation in lipid levels along with the two novel variants (KUAPOC3N2, and KUAPOC3N3) which
were tested for validation among larger cohort (n= 733). Allelic discrimination (VIC- and FAM-labeled) using real-time PCR (ABI 7800HT Realtime PCR (GS01/02) was performed for all of the five selected variants. Assay-on-demand of the commercially available TaqMan as-says were ordered for the four common variants, while a set of customized primer and probe were used for the two novel variants (Table 2). The reaction was carried according to the instruction of the manufacturer (Ap-plied Biosystem) using TaqmanTM Genotyping Master Mix (Applied Biosystems # 4371355). For quality con-trol, samples were tested on duplicates to estimate geno-typing reproducibility; concordance exceeded 99%.
Statistical analysis
Genotypic and allelic frequencies were determined by simple gene counting. The chi-square test was used to test the Hardy-Weinberg equilibrium (HWE) within the sample population. Haploview program v4.2 was used to check linkage disequilibrium (LD) between SNPs and construct haplotypes. The possible association of lipid profile with APOC3 polymorphisms was initially exam-ined with regards to age, gender and BMI using SPSS v21.0. The R software v3.3.1 was used for further ana-lysis utilizing the following packages SNPassoc, psych, genetics, and MASS [24]. Kruskal-Wallis ANOVA test was performed, and the results were reported as mean ± standard error. Log-transformation was applied across all of the lipid profile values (HDL-C, LDL-C, VLDL, and TG) so as to achieve an approximate normal distri-bution. Additionally, logistic regression model was used to check for any possible association between the studied SNPs and lipid profile parameters. Genetic modeling of the significant variants was performed. Ap-value of 0.05 was considered statistically significant.
Table 2Selected SNPs and their relevant information. Reported Minor Allele Frequency and predicted consequence were obtained fromhttp://www.ncbi.nlm.nih.gov/snp/, NCBI
SNP Position (GRCh38.p12) Consequence GenomAD reported MAF
Context sequence
rs5128 (C3238G)
chr11:116832924 g.8017G > C
3’UTR Variant G = 0.16051 (39,468/245886)
AAGTCCACCTGCCTATCCATCCTGC [C/G]AGCTCCTTGGGTCCTGCAATCTCCA
rs2854117 (C-482 T)
chr11:116829426 g.4519 T > C
5’UTR Transcript Variant C = 0 0.4163 (12,835/30834)
AGGCCTTGCCGGAGCCACTGATGCC [T/C]GGTCTTCTGTGCCTTTACTCCAAAC
rs2070668 (T528G)
chr11:11683043 g.5530 T > G
Intron (1) Variant G = 0.4314 (13,268/30758)
[T/G]AGCAGGGAGCCGGCCCCTACTCCTT
KUAPOC3N2 chr11:116700819 g.5196 A > G
Intron (1) Variant N/A Custom Designed NovelSNP2: Forward: GGTCCTCAGTGCCTGCTG Reverse:TCTAGGGATGAACTGAGCAGACA
KUAPOC3N3 chr11:116701159 g. 5536G > A
Intron (1) Variant N/A Custom Designed NovelSNP3: Forward: CCCCCACCCCTCATCATAAC Reverse: CTATGTAGCTTTGGGCAAGTGA
Results
APOC3sequence analysis
The full nucleotide sequence of the 4.3 Kb APOC3 gene locus among 100 Kuwaiti Arabs was analyzed excluding the 224 bp repetitive segment spanning nucleotide positions 2366–2589 due to the technical difficulties generated by the sequence analysis soft-ware. The newly defined APOC3 gene sequence in the Kuwaiti Arab samples was deposited in the NCBI
gene bank with accession number (GenBank:
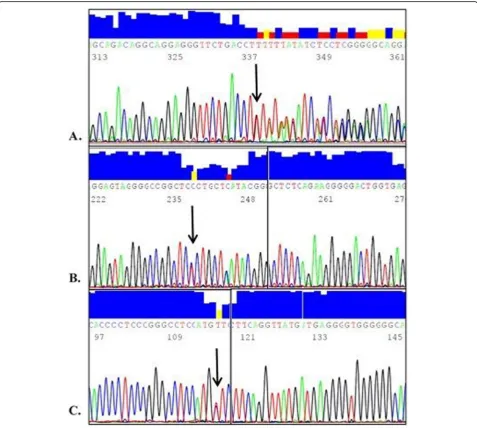
KJ437193). Sequence analysis identified 45 different polymorphisms including 42 previously reported SNPs and 3 novel SNPs (Fig. 2).
All three novel variants were found in a heterozygous state. The first novel variant (KUAPOC3N1) is an inser-tion of one nucleotide (A) within the promoter region (25 bases upstream of the gene) between positions g.4976 and g.4977 relative to the GenBank sequence (NG_008949.1) corresponding to genomic positions 116, 700,599 and 116,700,600 in the newly generated se-quence (accession number: KJ437193) and was detected in two normolipidemic individuals. The other two novel SNPs were found within the first intron of the APOC3 locus, each of them in one individual of normal lipid pro-file. One variant (KUAPOC3N2) resulted from A to G transition at genomic position 116,700,819 on the newly
generated APOC3 sequence (KJ437193) (NG_008949.1 g.5196 A > G). The other variant (KUAPOC3N3) resulted from G to A transition at genomic position 116,701,159 (KJ437193) (NG_008949.1 g. 5536G > A).
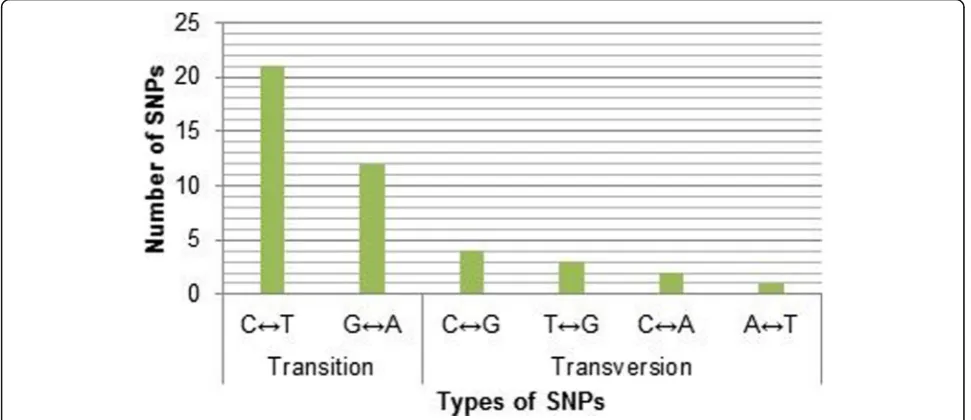
The remaining 42 variants were mainly SNPs with only 1 InDel. In general, a higher number of transitions type substitutions (n= 31) was observed compared to transversions (n= 10) (Fig.3). Considering the individual substitutions, C to T (n= 21) was found to be predomin-ant when compared to others G to A (n= 9), G to C (n= 4), G to T (n= 3), C to A (n= 2), and T to A (n= 1). Most of the identified SNPs were observed in non-coding regions, especially in intronic sequences totaling 26 SNPs (Fig. 4). There were 12 SNPs upstream of the gene, 2 SNPs in the 5′-UTR, and 3 SNPs in the 3′-UTR. Interestingly, there were only 2 SNPs found within the coding exons; the nonsense mutation rs76353203 (R19X) and the synonymous mutation rs4520 in exon 3 and exon 4 respectively.
SNPs and haplotype analysis
Analysis of the 45 SNPs in this study found 22 SNPs to have a minor allele frequency (MAF) more than 5% (Table 3) while the remaining 23 SNPs showed MAF < 5% (Additional file 1: Table S3). Most of the identified SNPs were found to be in HWE (p-value > 0.05) except for 6 SNPs (p-value < 0.05). Deviated SNPs included: rs2854117 (p-value < 0.001), rs734104 (p-value = 0.012), rs5142 (p-value = 0.0018), rs5141 (p-value = 0.001), rs645901 (p-value = 0.013), and rs5128 (p-value = 0.006). For all of the 6 SNPs, the homozygous genotypes were over-represented at the expense of heterozygous genotypes. As variants with low MAF (< 5%) are more prone to statistical error and false findings, only common
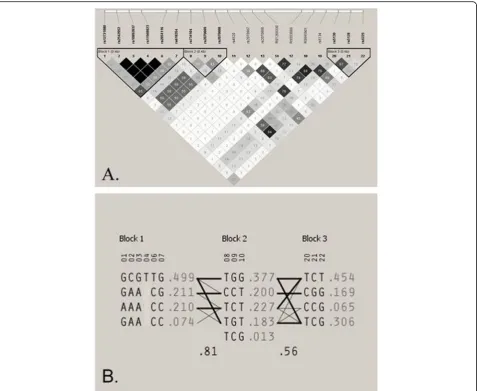
variants were further analyzed. Haplotype analysis using 22 SNPs resulted in five common (> 5%) haplotypes in three blocks (Fig. 5). The first haplotype block consists of the 5′ promoter SNPs (rs12721080, rs2542052, rs10892037, rs11568823, rs2854116) and
rs618354 within the first intron. The second
haplotype block includes 3 consecutive polymor-phisms within the first intron rs734104, rs2070669, and rs2070668. The third haplotype block includes rs5130 in intron 3 along with both rs5128 and rs4225 within the untranslated region of exon 4. Linkage analysis between SNPs were measured, with results
showing four SNPs (rs2542052, rs10892037,
rs11568823, and rs2854116) to be in complete LD (r2= 1) (Additional file 1: Table S4).
Fig. 3Substitution SNPs (n= 43) at the APOC3 gene locus among the analyzed 100 Kuwaiti Arab samples in term of their types
Validation and association of selected variants with serum lipid levels
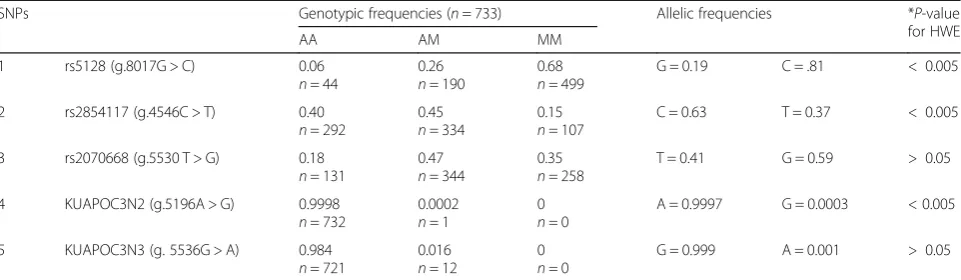
Three SNPs (rs2854117, rs2070668, rs5128) were selected for further association analysis as they have been reported to be associated with lipid variation in other populations [21–27]. Genotyping of the three selected variants and the two novels were determined based on the allelic discrimin-ation assay using real-time PCR. The genotypes obtained for the novel variants in the initial sequencing procedure were also observed by real-time PCR (Additional file 2: Figure S1). The allele frequencies in the cohort obtained from real-time PCR (Table3) were mostly found to be con-sistent with the frequencies obtained using the sequencing method (n= 100) (Additional file 1: Table S3). Deviation from HWE was observed for rs5128, most likely an out-come of excessive homozygous carriers of the mutant wild type C allele in the studied population. The two novel vari-ants were only identified in heterozygous states in < 1% of the cohort (n= 733) in which Novel 3 was identified in 10 additional samples while Novel 2 was not identified in any other sample than the originally sequenced sample. Novel 2 also showed deviation from HWE (p< 0.005) most likely due to status as a very rare allele and therefore was ex-cluded from further association tests.
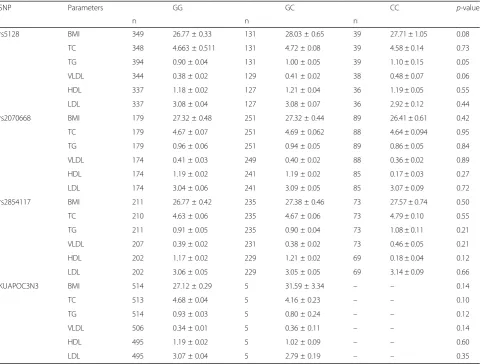
Analysis for genetic association of the selected SNPs with serum lipid level and BMI employing Kruskal-Wallis ANOVA after adjustment for sex, age and BMI did not show any sig-nificant associations (p-value > 0.05) (Table 4). However, rs5128 showed a trend for association with higher TG levels in homozygous (1.10 mmol/L ± 0.15) as well as heterozygous (1.00 mmol/L ± 0.05) of the minor allele when compared to homozygous for the wild type allele (0.90 mmol/L ± 0.04).
Multivariate analysis and genetic modeling of the associated variant (rs5128)
Genetic modelling was used to test the effect of rs5128 minor allele which showed (Additional file1: Table S5) a
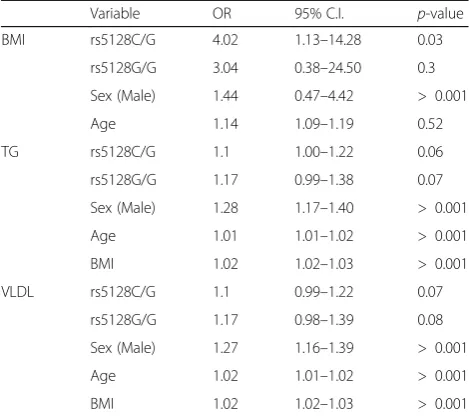
strong significant association (p= 0.02) of the dominant model in which carriers of the minor allele had an in-creased risk for high BMI (OR: 3.78 (1.19–11.94). In addition, carriers of rs5128 minor allele showed slightly increased levels of TG (OR: 0.89 (0.80–0.97)) and VLDL (OR: 1.11 (1.01–1.22)) based on the dominant model (p< 0.05). Significant association (p= 0.03) of rs5128 remained after multivariate analysis in which the OR value was 4.022 (CI: 1.13–14.30) for BMI implicated the minor“C”as a“risk”allele for higher BMI (Table5).
Discussion
The current study reports for the first time the full gen-etic profile of the APOC3gene locus (excluding the re-petitive sequence) among Arab ethnicity (Kuwaiti Arabs) which included 42 previously reported SNPs and 3 novel variants.
Sequence and mutation analysis provided insight on the locus structure and its conservation. The ratio of substitu-tion mutasubstitu-tions (n= 43) to indels (n= 2) was expected to be high since InDels are subjected to strong purifying se-lection in order to avoid their severe functional constraint as they are more likely to disrupt protein structures or to interfere with the functions of coding, splicing, and regula-tory sequence elements [28, 29]. Moreover, the rate of transition substitution was 3.3 times the rate of transver-sion at theAPOC3gene locus in the studied population. Part of this transition bias is thought to be driven by underlying chemical and structural properties of DNA that favor transition mutations as they are thermodynam-ically more stable [30].
It has been documented that the rates of SNPs are known to vary across the functional components near genes [31, 32]. In this study, the observed SNPs were more frequent in noncoding regions (n= 43: intronic = 26, upstream = 12, 3′-UTR =3, 5′-UTR =2) than in the coding exons (n= 2), a signature of purifying selection against changes. However, this feature does not preclude Table 3Genotypic and allelic frequencies for the 5 selected APOC3 SNPs (n= 733) that were genotyped by Realtime PCR
SNPs Genotypic frequencies (n= 733) Allelic frequencies *P-value for HWE
AA AM MM
1 rs5128 (g.8017G > C) 0.06
n= 44
0.26
n= 190
0.68
n= 499
G = 0.19 C = .81 < 0.005
2 rs2854117 (g.4546C > T) 0.40
n= 292
0.45
n= 334
0.15
n= 107
C = 0.63 T = 0.37 < 0.005
3 rs2070668 (g.5530 T > G) 0.18
n= 131
0.47
n= 344
0.35
n= 258
T = 0.41 G = 0.59 > 0.05
4 KUAPOC3N2 (g.5196A > G) 0.9998
n= 732
0.0002
n= 1
0
n= 0
A = 0.9997 G = 0.0003 < 0.005
5 KUAPOC3N3 (g. 5536G > A) 0.984
n= 721
0.016
n= 12
0
n= 0
G = 0.999 A = 0.001 > 0.05
a functional effect, as SNPs in noncoding sequences may have regulatory roles especially with alternative splicing [33, 34]. Low occurrence of SNPs in the coding exons (n= 2) could be explained by selective evolutionary pres-sure to maintain their structural and functional integrity [32], especially since the studied population were appar-ently healthy at the time of data collection. However, low variability occurs not only in protein-coding regions but also in non-coding regions harboring exons includ-ing both 5′-UTR (n= 2) and 3′-UTR (n= 3), this accen-tuates the importance of conservation among such regions because of their sequence-dependent role in
gene regulation through mRNA processing and transla-tion [32–35].
human evolutionary history in which APOC3 gene was under continuous natural selection pressure and alteration by mutation, genetic drift, and gene flow [36].
The allele frequency distribution at the APOC3loci was compared to other reported populations. The overall pattern of allelic frequencies ofAPOC3common SNPs (MAF higher than 5%) in the sampled population of Kuwaiti Arabs (n= 100) were found to be fairly comparable to the frequencies of other populations obtained from the 1000GENOMES and HapMap deposited in ensembl including Caucasion, American, Asian, and European (Additional file1: Table S3) [37]. However, some SNPs showed large interethnic varia-tions in their allelic frequencies. The largest ethnic variation in the allelic frequencies of the common APOC3 SNPs (MAF higher than 5%) was observed when compared to African population [37].
Most polymorphisms in APOC3 gene promoter are thought to play some role in the regulation of APOC3 ex-pression. Therefore, the evaluation of the allelic distribu-tion of some common promoter variadistribu-tions (rs2542052,
rs10892037, rs11568823, rs2854116, and rs2854117) in various ethnic groups is crucial in understanding the in-terethnic variability in APOC3 activity. The common SNPs at sites A-641C (rs2542052), A-630G (rs10892037),
−625insT (rs11568823) of the promoter region are repre-sentative to each other. Kuwaiti Arabs (n= 100) showed higher frequencies (49.5%) for the previously reported
“variant” promoter alleles at sites -641A, −630A, and -625del when compared to Caucasions (42%) [15,16]. In regard to the two common SNPs, T-455C (rs2854116) and C-482 T(rs2854117) observed within the insulin re-sponsive element (IRE) in the promoter region, the allelic frequencies differed markedly among ethnic groups. The frequency of the -482C allele (rs2854117) detected in Ku-waiti Arabs (37%) is lower than that of Chinese Han popu-lation (53.45%) [4]. Kozlitina and his colleagues investigated the frequency of the same polymorphism in different ethnic groups and reported the highest frequency in African American (71.2%) and less common in His-panics (38.9%) and Europeans (36.6%). These interethnic Table 4Association of the 4 APOC3 SNPs with lipid profiles in the Kuwaiti Cohort (n= 733)
SNP Parameters GG GC CC p-value
n n n
rs5128 BMI 349 26.77 ± 0.33 131 28.03 ± 0.65 39 27.71 ± 1.05 0.08
TC 348 4.663 ± 0.511 131 4.72 ± 0.08 39 4.58 ± 0.14 0.73
TG 394 0.90 ± 0.04 131 1.00 ± 0.05 39 1.10 ± 0.15 0.05
VLDL 344 0.38 ± 0.02 129 0.41 ± 0.02 38 0.48 ± 0.07 0.06
HDL 337 1.18 ± 0.02 127 1.21 ± 0.04 36 1.19 ± 0.05 0.55
LDL 337 3.08 ± 0.04 127 3.08 ± 0.07 36 2.92 ± 0.12 0.44
rs2070668 BMI 179 27.32 ± 0.48 251 27.32 ± 0.44 89 26.41 ± 0.61 0.42
TC 179 4.67 ± 0.07 251 4.69 ± 0.062 88 4.64 ± 0.094 0.95
TG 179 0.96 ± 0.06 251 0.94 ± 0.05 89 0.86 ± 0.05 0.84
VLDL 174 0.41 ± 0.03 249 0.40 ± 0.02 88 0.36 ± 0.02 0.89
HDL 174 1.19 ± 0.02 241 1.19 ± 0.02 85 0.17 ± 0.03 0.27
LDL 174 3.04 ± 0.06 241 3.09 ± 0.05 85 3.07 ± 0.09 0.72
rs2854117 BMI 211 26.77 ± 0.42 235 27.38 ± 0.46 73 27.57 ± 0.74 0.50
TC 210 4.63 ± 0.06 235 4.67 ± 0.06 73 4.79 ± 0.10 0.55
TG 211 0.91 ± 0.05 235 0.90 ± 0.04 73 1.08 ± 0.11 0.21
VLDL 207 0.39 ± 0.02 231 0.38 ± 0.02 73 0.46 ± 0.05 0.21
HDL 202 1.17 ± 0.02 229 1.21 ± 0.02 69 0.18 ± 0.04 0.12
LDL 202 3.06 ± 0.05 229 3.05 ± 0.05 69 3.14 ± 0.09 0.66
KUAPOC3N3 BMI 514 27.12 ± 0.29 5 31.59 ± 3.34 – – 0.14
TC 513 4.68 ± 0.04 5 4.16 ± 0.23 – – 0.10
TG 514 0.93 ± 0.03 5 0.80 ± 0.24 – – 0.12
VLDL 506 0.34 ± 0.01 5 0.36 ± 0.11 – – 0.14
HDL 495 1.19 ± 0.02 5 1.02 ± 0.09 – – 0.60
LDL 495 3.07 ± 0.04 5 2.79 ± 0.19 – – 0.35
SNPSingle nucleotide polymorphism,BMIBody mass index,TCTotal cholesterol,TGTriglycerides,VLDLVery low-density lipoprotein,HDLHigh density lipoprotein,
differences in the allele frequencies of the two common variatiants within IRE suggest that there may be potential ethnic differences in APOC3 expression downregulation pathway activity and IRE sensitivity [26]. The frequency of the common variant rs5128 (C3238G), in the 3′-UTR was also found to be different from other reports. A higher frequency of the rare 3238G allele (19.6%) was observed in Kuwaiti Arabs than Caucasians (0–11%), comparable to the frequencies reported for Saudi Arabians (18%), Iranians (14%) and Costa Ricans (19%) [17, 25, 38–41]; while being lower than those reported for Northwest Indian subpopulations (22.6–26.2%) Asian Indians (31.3%) [42,43].
The haplotype structure exhibited a complete LD (r2= 1) observed between 4 promoter SNPs, rs2542052 (A-641C), rs10892037 (A-630G), rs11568823 (−625insT) and rs2854116 (T-455C), all of which were within 186 base pairs. Considering the polymorphism at site −455 (rs2854116), no previous studies (to our knowledge) have shown complete LD with the 3 concordant promoter SNPs listed above. Dammerman study [15] on Caucasians showed a strong LD rather than a complete LD in which the −625 (rs11568823) genotype predicted the −455 (rs2854116) genotype in 169 out of 173 subjects [43]. Moreover, Brown and his colleagues also generated a very strong LD in the place of complete LD within this poly-morphisms pair (rs11568823 and rs2854116) [17].
In the present study, 2 additional haplotypes blocks were observed beside the common promoter haplotype reported in other studies. Both of them are three-marker haplotypes found within moderate disequilibrium re-gions. The first of the two encompasses 3 sequential
SNPs within the first intron (rs734104, rs2070669, and rs2070668) while the second block covers rs5130 in in-tron 3 along with both rs5128 and rs4225 within the untranslated region of exon 4. The emergence of both haplotypes in Kuwaiti Arabs population could be ex-plained in view of population-level behavior of alleles at adjacent loci or interethnic allele frequency differences. The aggregation of the above-mentioned SNPs in each haplotype suggest that each 3 variants may functionally cooperate in the Kuwaiti Arabs population. Based on these findings, the variants analyzed for association in this study were selected according to their haplotype group.
Studies of the association between variousAPOC3 poly-morphisms and lipid profile have reported apparently con-flicting findings across different populations [18,43–46]. In the studied cohort (n= 733) and among the 5 tested
APOC3 SNPs (rs5128, rs2854117, rs2070668, and Novels SNP 2 and 3), only rs5128 showed an association with in-creased BMI, TG and VLDL levels (Table4) that was fur-ther validated using multivariate analysis. The rs5128 variant was found to be significantly associated (p< 0.05) with BMI among the studied cohort following a dominant genetic model (Table 5) and increased risk by an OR of 4.022 (CI: 1.13–14.30). Such an association was in con-cordance with other studies reported in different popula-tion [18–27]. It must be noted that the deviation from HWE observed for rs5128 was most likely an outcome of excessive homozygous carriers of the mutant wild type C allele conferring to the above findings and is not an out-come of genotyping error. Randomly selected samples were genotyped, and the results were consistent. In addition, other studied variants such as rs2070668 conferred to HWE further supporting the potential involvement of rs5128 with BMI in a known population prevalent with obesity.
The contributed small effect of the rs5128 minor allele, localized in the 3″UTR of exon 4, could be the outcome of possible increased transcriptional activity of the gene resulting in higher plasma levels of APOC3 protein. Stud-ies have reported that high APOC3 levels is directly corre-lated to increased levels of TG, VLDL, and BMI [47]. There are three different possible mechanisms involved in the elevation of TG levels by APOC3. First, APOC3 is an inhibitor of lipoprotein lipase (LPL), a key rate limiting enzyme in the hydrolysis of TG-rich particles thereby increased levels of APOC3 would increases the inhibition of LPL [47]. Second, APOC3 promotes the assembly and secretion of VLDL in the liver yielding higher circulation of VLDL in the bloodstream [48, 49]. Thirdly, at higher concentrations APOC3, inhibition of hepatic lipase (HL) activity may also occur leading to a delayed catabolism of TG-rich particles [50]. Other indirect mechanisms by which the APOC3 could affect lipid metabolism resulting Table 5Multivariate analysis on the effect of APOC3 rs5128 on
BMI, TG and VLDL in the cohort (n= 733) assuming a dominant genetic model
Variable OR 95% C.I. p-value
BMI rs5128C/G 4.02 1.13–14.28 0.03
rs5128G/G 3.04 0.38–24.50 0.3
Sex (Male) 1.44 0.47–4.42 > 0.001
Age 1.14 1.09–1.19 0.52
TG rs5128C/G 1.1 1.00–1.22 0.06
rs5128G/G 1.17 0.99–1.38 0.07
Sex (Male) 1.28 1.17–1.40 > 0.001
Age 1.01 1.01–1.02 > 0.001
BMI 1.02 1.02–1.03 > 0.001
VLDL rs5128C/G 1.1 0.99–1.22 0.07
rs5128G/G 1.17 0.98–1.39 0.08
Sex (Male) 1.27 1.16–1.39 > 0.001
Age 1.02 1.01–1.02 > 0.001
BMI 1.02 1.02–1.03 > 0.001
in accumulation of TG have been suggested [51]. A more recent study reported that another variant (rs4225) in the vicinity had a role in the regulation of gene expression and increased TG levels through the introduction of an miR-4271 binding site [21]. Further-more, it could be postulated that such variants could have a modified affect related to nutraceuticals in regu-lating lipid levels. These molecules as well as functional food ingredients have been shown [52] to affect lipid levels and more specifically may reduce VLDL levels and that the mechanism behind this could be under genetic control.
Conclusion
APOC3was found to be highly polymorphic in the stud-ied Kuwaiti Arab population in which 42 previously re-ported SNPs and 3 novel SNPs were identified, one of which as characterized as“very rare” variant which may make a useful maker for ethnic identification. Only rs5128 showed an association with increased BMI, TG and VLDL levels in which the G allele is a risk variant and was found to deviate from HWE most likely as a re-sult of its association and not the outcome of sampling error. This study supports the inclusion of rs5128 a marker for assessing genetic risk to dyslipidemia. For fu-ture studies and considering the importance of the re-petitive sequences in genetic control processes, it would be interesting to analyze the repetitive sequence of the
APOC3gene among different ethnic groups employing a specific and reproducible genotyping protocol. Repeats have always presented technical challenges for sequence alignment and assembly programs. Polymorphisms of the repetitive sequence may be genotyped by targeted PCR with primers flanking the repetitive sequence and examining the resolving the products on high resolution gels that would facilitate the identification of the repeat alleles. The limitation of this study is in the lack of apoli-poprotein and LPL levels.
Supplementary information
Supplementary informationaccompanies this paper athttps://doi.org/10. 1186/s12944-019-1165-6.
Additional file 1: Table S1.Primers sets designed to sequence the full APOC3 gene.Table S2.PCR thermal profile used for all the primer sets of the APOC3 gene in this study during both amplification and sequencing reactions.Table S3.A summary of genotypic and allelic frequencies for the APOC3 SNPs showing within the total population (n= 100). Listed are the number of the SNP when used in the linkage disequilibrium and haplotype analysis (first column), the dbSNP reference number.Table S4.Pairwise test of linkage-disequilibrium as measured by r2 between the identified 22 segregating SNPs at the APOC3 gene locus (MAF > 5%).Table S5.Genetic modeling of APOC3 rs5128 with BMI, TG, and VLDL.Table S6.Minor allelic frequencies of commonly studied APOC3 SNPs (MAF > 5%) in reported in various populations.
Additional file 2: Figure S1.Amplification plots for the genotypes of the identified novel APOC3 variants as observed by real-time PCR.
Abbreviations
3′-UTR:3′-untranslated region; 5′-UTR: 5′-untranslated region;
APOC3: Apolipoprotein C3 human gene; APOC3: Apolipoprotein C3 human protein; BMI: Body mass index; bp: Base pair; dbSNP: The single nucleotide polymorphisms database; DNA: Deoxyribonucleic acid; GMAF: Global minor allele frequency; HDL-C: High-density-lipoprotein-cholesterol; HWE: Hardy-Weinberg equilibrium; Indel: Insertion or deletion; Kb: Kilo base; LDL-C: Low-density lipoprotein-cholesterol; NCBI: National center for biotechnology information; PCR: Polymerase chain reaction; rs: Reference sequence; SNPs: Single nucleotide polymorphisms; TC: Total cholesterol; TG: Triglycerides
Acknowledgments
The authors would like to acknowledge the General Facility Project (GS 01/ 02) for the use of the ABI 3130xl Gene Analyzer. The authors extend their deepest appreciation and gratitude to all the participants in this study and to the technical assistance provided by Mrs. Babitha G. Annice and Mrs. Sheela Thankakon.
Authors’contributions
ZM and SA contributed equally. ZM performed all the experiments, analyzed all the data and prepared the manuscript, AA participated in the study design, supervised and assisted the statistical analysis and revised the manuscript. HA conducted the statistical analysis for the association of the selected variants among the cohort samples WA supervised and assisted with the sequence alignment, its annotations and submission of SNPs and revised the manuscript. SA prepared the project proposal and study design, supervised the molecular genetic analysis and sample collection and documentation, assisted with the data interpretation and preparation of the manuscript. All the authors have read and approved the final manuscript.
Funding
This research was supported and funded by Kuwait University Research Administration (Project YS01/12).
Availability of data and materials
Additional data and analysis are provided in the supplementary files. Any other data may be made available upon request from the corresponding author.
Ethics approval and consent to participate
Informed consent and ethical approval were obtained for this study in accordance to the revised 2000 Helsinki guiltiness of 1975. Ethical approval was granted by the Ethical Committee at Kuwait University as well as the Ethics Board at the Ministry of Health in Kuwait for conducting this study.
Consent for publication
All authors have read and approved the manuscript for publication.
Competing interests
The authors declare that they have no competing interests.
Author details
1Department of Biological Sciences, Faculty of Science, Kuwait University,
Kuwait, Kuwait.2Human Genetics Unit, Department of Pathology, Faculty of Medicine, Kuwait University, Hawally, Kuwait.
Received: 16 September 2019 Accepted: 3 December 2019
References
1. Pennacchio LA, Olivier M, Hubacek JA, Cohen JC, Cox DR, Fruchart JC, Krauss RM, Rubin EM. An apolipoprotein influencing triglycerides in humans and mice revealed by comparative sequencing. Science. 2001; 294(5540):169–73.
3. Parzianello L, Oliveira G, Coelho JC. Apolipoprotein CIII polymorphism and triglyceride levels of a Japanese population living in southern Brazil. Braz J Med Biol Res. 2008;41(6):462–7.
4. Yu J, Wang HM, Yang SM, Yuan J, Chen LY, Chen CL, Huang DF, Wang YG, Ju SQ, Zhu JY. The effect of APOC3 promoter polymorphisms on the risk of hypertriglyceridemia in Chinese Han population with or without type 2 diabetes mellitus. Labmedicine. 2010;41(1):34–9.
5. Davidson J, Rotondo D. Control of serum triglyceride levels by the apolipoprotein C3 gene and its relationship to cardiovascular disease. Curr Opin Lipidol. 2018;29(3):271–2.
6. Sacks FM, Alaupovic P, Moye LA, Cole TG, Sussex B, Stampfer MJ, Pfeffer MA, Braunwald E. VLDL, apolipoproteins B, CIII, and E, and risk of recurrent coronary events in the cholesterol and recurrent events (CARE) trial. Circulation. 2000;102(16):1886–92.
7. Mendivil CO, Rimm EB, Furtado J, Chiuve SE, Sacks FM. Low-density lipoproteins containing apolipoprotein C-III and the risk of coronary heart disease. Circulation. 2011;124(19):2065–72.
8. Task Force for the management of dyslipidaemias of the European Society of, C., S. the European Atherosclerosis, Catapano AL, Reiner Z, De Backer G, Graham I, Taskinen MR, Wiklund O, Agewall S, Alegria E, Chapman MJ, Durrington P, Erdine S, Halcox J, Hobbs R, Kjekshus J, Filardi PP, Riccardi G, Storey RF, Wood D, E. S. C. C. f. P. Guidelines and Committees. ESC/EAS guidelines for the management of dyslipidaemias: the task force for the management of dyslipidaemias of the European Society of Cardiology (ESC) and the European Atherosclerosis Society (EAS). Atherosclerosis. 2011; 217(Suppl 1):S1–44.
9. Edwards KL, Newman B, Mayer E, Selby JV, Krauss RM, Austin MA. Heritability of factors of the insulin resistance syndrome in women twins. Genet Epidemiol. 1997;14(3):241–53.
10. Kronenberg F, Coon H, Ellison RC, Borecki I, Arnett DK, Province MA, Eckfeldt JH, Hopkins PN, Hunt SC. Segregation analysis of HDL cholesterol in the NHLBI Family Heart Study and in Utah pedigrees. Eur J Hum Genet. 2002; 10(6):367–74.
11. Wang X, Paigen B. Genetics of variation in HDL cholesterol in humans and mice. Circ Res. 2005;96(1):27–42.
12. Goode EL, Cherny SS, Christian JC, Jarvik GP, de Andrade M. Heritability of longitudinal measures of body mass index and lipid and lipoprotein levels in aging twins. Twin Res Hum Genet. 2007;10(5):703–11.
13. Herbeth B, Samara A, Ndiaye C, Marteau JB, Berrahmoune H, Siest G, Visvikis-Siest S. Metabolic syndrome-related composite factors over 5 years in the STANISLAS family study: genetic heritability and common environmental influences. Clin Chim Acta. 2010;411(11–12):833–9. 14. Cole CB, Nikpay M, McPherson R. Gene-environment interaction in
dyslipidemia. Curr Opin Lipidol. 2015;26(2):133–8.
15. Dammerman M, Breslow JL. Genetic basis of lipoprotein disorders. Circulation. 1995;91(2):505–12.
16. Surguchov AP, Page GP, Smith L, Patsch W, Boerwinkle E. Polymorphic markers in apolipoprotein C-III gene flanking regions and
hypertriglyceridemia. Arterioscler Thromb Vasc Biol. 1996;16(8):941–7. 17. Brown S, Ordovas JM, Campos H. Interaction between the APOC3 gene
promoter polymorphisms, saturated fat intake and plasma lipoproteins. Atherosclerosis. 2003;170(2):307–13.
18. Song Y, Zhu L, Richa M, Li P, Yang Y, Li S. Associations of the APOC3 rs5128 polymorphism with plasma APOC3 and lipid levels: a meta-analysis. Lipids Health Dis. 2015;14:32.
19. Tg NHL, Hdl Working Group of the Exome Sequencing Project, Blood I, Crosby J, Peloso GM, Auer PL, Crosslin DR, Stitziel NO, Lange LA, Lu Y, Tang ZZ, Zhang H, Hindy G, Masca N, Stirrups K, Kanoni S, Do R, Jun G, Hu Y, Kang HM, Xue C, Goel A, Farrall M, Duga S, Merlini PA, Asselta R, Girelli D, Olivieri O, Martinelli N, Yin W, Reilly D, Speliotes E, Fox CS, Hveem K, Holmen OL, Nikpay M, Farlow DN, Assimes TL, Franceschini N, Robinson J, North KE, Martin LW, DePristo M, Gupta N, Escher SA, Jansson JH, Van Zuydam N, Palmer CN, Wareham N, Koch W, Meitinger T, Peters A, Lieb W, Erbel R, Konig IR, Kruppa J, Degenhardt F, Gottesman O, Bottinger EP, O'Donnell CJ, Psaty BM, Ballantyne CM, Abecasis G, Ordovas JM, Melander O, Watkins H, Orho-Melander M, Ardissino D, Loos RJ, McPherson R, Willer CJ, Erdmann J, Hall AS, Samani NJ, Deloukas P, Schunkert H, Wilson JG, Kooperberg C, Rich SS, Tracy RP, Lin DY, Altshuler D, Gabriel S, Nickerson DA, Jarvik GP, Cupples LA, Reiner AP, Boerwinkle E, Kathiresan S. Loss-of-function mutations in APOC3, triglycerides, and coronary disease. N Engl J Med. 2014;371(1):22–31.
20. Tas S. Strong association of a single nucleotide substitution in the 3′ -untranslated region of the apolipoprotein-CIII gene with common hypertriglyceridemia in Arabs. Clin Chem. 1989;35(2):256–9. 21. Hu SL, Cui GL, Huang J, Jiang JG, Wang DW. An APOC3 3′UTR variant
associated with plasma triglycerides levels and coronary heart disease by creating a functional miR-4271 binding site. Sci Rep. 2016;6:32700. 22. Friedewald WS, Levy RI, Fredrickson DS. Estimation of the concentration of
low-density lipoprotein cholesterol in plasma, without use of the preparative ultracentrifuge. Clin Chem. 1972;18(6):499–502.
23. Miller SA, Dykes DD, Polesky HF. A simple salting out procedure for extracting DNA from human nucleated cells. Nucleic Acids Res. 1988; 16(3):1215.
24. R Core Team. R: A language and environment for statistical computing. Vienna: R Foundation for Statistical Computing; 2018.
25. Bandegi AR, Firoozrai M, Akbari Eidgahi MR, Kokhaei P. SstI polymorphism of the apolipoprotein CIII gene in Iranian hyperlipidemic patients: a study in Semnan Province. Iran J Basic Med Sci. 2011;14(6):506–13.
26. Kozlitina J, Boerwinkle E, Cohen JC, Hobbs HH. Dissociation between APOC3 variants, hepatic triglyceride content and insulin resistance. Hepatology. 2011;53(2):467–74.
27. Cui F, Li K, Li Y, Zhang X, An C. Apolipoprotein C3 genetic polymorphisms are associated with lipids and coronary artery disease in a Chinese population. Lipids Health Dis. 2014;13:170.
28. Chen K, McLellan MD, Ding L, Wendl MC, Kasai Y, Wilson RK, Mardis ER. PolyScan: an automatic indel and SNP detection approach to the analysis of human resequencing data. Genome Res. 2007;17(5):659–66.
29. Chen JQ, Wu Y, Yang H, Bergelson J, Kreitman M, Tian D. Variation in the ratio of nucleotide substitution and indel rates across genomes in mammals and bacteria. Mol Biol Evol. 2009;26(7):1523–31.
30. Rosenberg MS, Subramanian S, Kumar S. Patterns of transitional mutation biases within and among mammalian genomes. Mol Biol Evol. 2003;20(6):988–93.
31. Shastry BS. SNPs in disease gene mapping, medicinal drug development and evolution. J Hum Genet. 2007;52(11):871–80.
32. Castle JC. SNPs occur in regions with less genomic sequence conservation. PLoS One. 2011;6(6):e20660.
33. Hull J, Campino S, Rowlands K, Chan MS, Copley RR, Taylor MS, Rockett K, Elvidge G, Keating B, Knight J, Kwiatkowski D. Identification of common genetic variation that modulates alternative splicing. PLoS Genet. 2007;3(6):e99. 34. Cooper GM, Shendure J. Needles in stacks of needles: finding disease-causal
variants in a wealth of genomic data. Nat Rev Genet. 2011;12(9):628–40. 35. Hesketh J. 3′-Untranslated regions are important in mRNA localization and
translation: lessons from selenium and metallothionein. Biochem Soc Trans. 2004;32(Pt 6):990–3.
36. Guo Y, Jamison DC. The distribution of SNPs in human gene regulatory regions. BMC Genomics. 2005;6:140.
37. Genomes Project, C, Abecasis GR, Auton A, Brooks LD, DePristo MA, Durbin RM, Handsaker RE, Kang HM, Marth GT, McVean GA. An integrated map of genetic variation from 1,092 human genomes. Nature. 2012;491(7422):56–65.
38. Rees A, Stocks J, Sharpe CR, Vella MA, Shoulders CC, Katz J, Jowett NI, Baralle FE, Galton DJ. Deoxyribonucleic acid polymorphism in the apolipoprotein A-1-C-III gene cluster. Association with hypertriglyceridemia. J Clin Invest. 1985;76(3):1090–5.
39. Paul-Hayase H, Rosseneu M, Robinson D, Van Bervliet JP, Deslypere JP, Humphries SE. Polymorphisms in the apolipoprotein (apo) AI-CIII-AIV gene cluster: detection of genetic variation determining plasma apo AI, apo CIII and apo AIV concentrations. Hum Genet. 1992;88(4):439–46.
40. Garenc C, Aubert S, Laroche J, Girouard J, Vohl MC, Bergeron J, Rousseau F, Julien P. Population prevalence of APOE, APOC3 and PPAR-alpha mutations associated to hypertriglyceridemia in French Canadians. J Hum Genet. 2004; 49(12):691–700.
41. Johansen K, Skotnicki A, Tan JC, Kwaasi AA, Skotnicki M. Apolipoprotein A-I/ C-III gene cluster polymorphism in Saudi Arabians, Filipinos and Caucasians. Clin Genet. 1990;37(3):194–7.
42. Singh P, Singh M, Bhatnagar DP, Kaur T, Mastana S. Apolipoprotein C3 (SstI) gene variability in Northwest India: a global perspective. Int J Hum Genet. 2008;8(1–2):51–60.
44. Dammerman M, Sandkuijl LA, Halaas JL, Chung W, Breslow JL. An apolipoprotein CIII haplotype protective against hypertriglyceridemia is specified by promoter and 3′untranslated region polymorphisms. Proc Natl Acad Sci U S A. 1993;90(10):4562–6.
45. Hokanson JE, Kinney GL, Cheng S, Erlich HA, Kretowski A, Rewers M. Susceptibility to type 1 diabetes is associated with ApoCIII gene haplotypes. Diabetes. 2006;55(3):834–8.
46. Pollin TI, Damcott CM, Shen H, Ott SH, Shelton J, Horenstein RB, Post W, McLenithan JC, Bielak LF, Peyser PA, Mitchell BD, Miller M, O’Connell JR, Shuldiner AR. A null mutation in human APOC3 confers a favorable plasma lipid profile and apparent cardioprotection. Science. 2008;322(5908):1702–5. 47. Johansen CT, Kathiresan S, Hegele RA. Genetic determinants of plasma
triglycerides. J Lipid Res. 2011;52(2):189–206.
48. Sundaram M, Zhong S, Bou Khalil M, Links PH, Zhao Y, Iqbal J, Hussain MM, Parks RJ, Wang Y, Yao Z. Expression of apolipoprotein C-III in McA-RH7777 cells enhances VLDL assembly and secretion under lipid-rich conditions. J Lipid Res. 2010;51(1):150–61.
49. Qin W, Sundaram M, Wang Y, Zhou H, Zhong S, Chang CC, Manhas S, Yao EF, Parks RJ, McFie PJ, Stone SJ, Jiang ZG, Wang C, Figeys D, Jia W, Yao Z. Missense mutation in APOC3 within the C-terminal lipid binding domain of human ApoC-III results in impaired assembly and secretion of
triacylglycerol-rich very low-density lipoproteins: evidence that ApoC-III plays a major role in the formation of lipid precursors within the microsomal lumen. J Biol Chem. 2011;286(31):27769–80.
50. Jong MC, Rensen PC, Dahlmans VE, van der Boom H, van Berkel TJ, Havekes LM. Apolipoprotein C-III deficiency accelerates triglyceride hydrolysis by lipoprotein lipase in wild-type and apoE knockout mice. J Lipid Res. 2001; 42(10):1578–85.
51. Luo M, Peng D. The emerging role of apolipoprotein C-III: beyond effects on triglyceride metabolism. Lipids Health Dis. 2016;15(1):184.
52. Scicchitano P, Cortese F, Ricci G, Carbonara S, Moncelli M, Iacoviello M, Cecere A, Gesualdo M, Zito A, Caldarola P, Scrutinio D, Lagioia R, Riccioni G, Ciccone MM. Ivabradine, coronary artery disease, and heart failure: beyond rhythm control. Drug Des Devel Ther. 2014;8:689–700.
Publisher’s Note