R E S E A R C H
Open Access
Association between blood lead and blood
pressure: a population-based study in
Brazilian adults
Ana Carolina Bertin de Almeida Lopes
1, Ellen Kovner Silbergeld
2, Ana Navas-Acien
2, Rachel Zamoiski
2,
Airton da Cunha Martins Jr.
3, Alissana Ester Iakmiu Camargo
4, Mariana Ragassi Urbano
1,5,
Arthur Eumann Mesas
1,6and Monica Maria Bastos Paoliello
1,7*Abstract
Background:Environmental lead exposure among adults may increase blood pressure and elevate the risk of
hypertension. The availability of data on blood lead levels (BLL) in adult Brazilian population is scarce and population-based studies are important for screening the population exposure and also to evaluate associations with adverse health effects. The goal of this study was to examine the association of BLL with blood pressure and hypertension in a population-based study in a city in Southern Brazil.
Methods:A total of 948 adults, aged 40 years or older, were randomly selected. Information on socioeconomic, dietary, lifestyle and occupational background was obtained by orally administered household interviews. Systolic blood pressure (SBP) and diastolic blood pressure (DBP) were measured according to the guidelinesVI Brazilian Guidelines on Hypertension. BLL were measured by inductively coupled plasma mass spectrometry technique. Multiple linear and logistic regression models were performed to evaluate associations of BLL with SBP and DBP, and with the chance of hypertension and of elevated SBP and DBP.
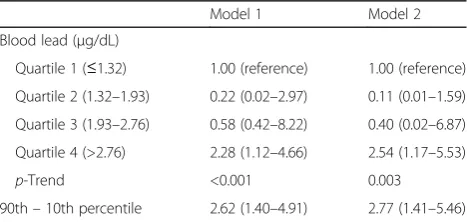
Results:The geometric mean of BLL was 1.97μg/dL (95%CI:1.90-2.04μg/dL). After multivariable adjustment, participants in the quartile 4 of blood lead presented 0.06 mm/Hg (95%CI, 0.04-0.09) average difference in DBP comparing with those in quartile 1. Participants in the 90th percentile of blood lead distribution had 0.07 mmHg (95% CI, 0.03 to 0.11) higher DBP compared with those participants in the 10th percentile of blood lead. The adjusted OR for hypertension was 2.54 (95% CI, 1.17-5.53), comparing the highest to the lowest blood lead quartiles. Compared with participants in the 10th percentile of blood lead, participants in the 90th percentile presented higher OR for hypertension (OR: 2.77; 95% CI, 1.41 to 5.46).
Conclusion:At low concentrations, BLL were positively associated with DBP and with the odds for hypertension in adults aged 40 or older. It is important to enforce lead exposure monitoring and the enactment of regulatory laws to prevent lead contamination in urban settings.
Keywords:Blood lead, Blood pressure, Hypertension, Population-based
* Correspondence:monibas2@gmail.com
1
Graduate Program in Public Health, Center of Health Sciences, State University of Londrina - UEL, Londrina, Paraná, Brazil
7Department of Molecular Pharmacology, Albert Einstein College of Medicine, Bronx, NY 10461, USA
Full list of author information is available at the end of the article
Background
Chronic lead exposure and accumulation in the body can lead to progressive health effects. Among these ef-fects, increased blood pressure, which is associated with the onset of cardiovascular diseases, has been linked to lead exposure. The hypertensive effects of lead have been widely reported in workers exposed to high levels of the metal and by experimental studies in which ani-mals were exposed to long-term high doses of lead. Under occupational conditions, the development of hypertension has been implicated as a possible conse-quence of the nephropathy caused by lead exposure. Studies have concluded that lead exposure is a risk fac-tor for raised blood pressure and hypertension even in the general population [1–4].
Publications of NHANES (National Health and Nutri-tion ExaminaNutri-tion Survey) data have reported a decline of environmental lead exposure in the United States and consequent lower blood lead concentrations in the American population. While early studies had noticed positive and significant associations between blood lead and blood pressure, more recent studies have questioned the consistency of this association in view of the lower blood lead concentrations observed in the last published data [5–10]. A meta-analysis of the epidemiological studies available from 1980 to 2001 reported that a 2-fold increase in blood lead concentration was associated with a 1.0 mm Hg increase in systolic blood pressure and a 0.6 mm Hg increase in diastolic blood pressure [11]. Recent data have suggested that the effect sizes in the associations of blood pressure and blood lead (mean of 1.51 μg/dL) are small and inconsistent [6], or that a modest association was found [12].
Hypertension is a major risk factor for cardiovascular disease, which remains the leading cause of death in Brazil, representing about 13% of disability adjusted life years (DALYs) [13, 14]. Globally, raised blood pressure is the leading noncommunicable diseases risk factor, to which 13% of deaths are attributed. The prevalence of raised blood pressure in adults aged 25 years or older was about 40% in 2008, and is generally more prevalent in men than in women (39% for men and 32% for women) [15]. In Brazil, the prevalence is similar to other countries, occurring in 35.8% of men and 30% of women with general estimate of over 30% in both sexes, and prevalence increases with age (≥60 years old) [16–18].
In view of the low blood lead concentrations found in our study (1.97 μg/dL) and the divergent results pub-lished on literature, we aimed to examine the relation-ship of blood lead with blood pressure and hypertension in a population-based sample of Brazilian adults living in southern Brazil. Besides, few studies have evaluated the scientific evidence on blood lead and adverse health ef-fects on the Brazilian general population. Our study
focused on adults aged 40 years or older who, as com-pared to younger persons have increased risk factors for cardiovascular diseases, and also were probably exposed to higher concentrations of lead before 1985, when the withdrawal of tetraethyl lead in automotive gasoline oc-curred in Brazil [19].
Methods
The study population included adults aged 40 years or older residents in an urban area in southern Brazil. In 2011, participants were randomly selected and took part in a household interview, anthropometric measurements and laboratory tests. Complete information of the study design and sampling has already been published [20, 21]. The accomplished study had a census based design, using data from the Population Count 2007, when the city of Cambé had a total of 92,888 people, of whom 30,710 (33.1%) were aged 40 or older (46% men and 54% women) [22]. All census tracts in the urban region were included in the study and the number of subjects to be interviewed in each tract was calculated proportionally to the amount of men and women aged 40 or over, and a quota of individuals, according to gender and age range, with five-year intervals was defined.
A total of 1180 (88.3%) of the selected persons com-pleted the interview and 959 (81.3%) performed blood collection [20]. For the present analysis, we used data from 948 subjects who participated in the interviews, who had performed blood tests and had blood pressure measurements. Eleven participants missing information on blood pressure were excluded from this analysis.
The measurements were taken according to the VI Brazilian Guidelines on Hypertension, organized by the Brazilian Hypertension Society [23], by using the digital equipment Omron HEM 742. Measurements were ob-tained at both arms, and in case of difference, we used data from the arm with the highest value as a reference for subsequent measures. At least three measurements were performed with one minute interval between them, with the participant in a sitting position. The mean of the last two blood pressure measurements was consid-ered the most accurate blood pressure. Participants were considered as hypertensive if any of the following criteria were present: a systolic blood pressure of 140 mm Hg or higher, a diastolic blood pressure of 90 mm Hg or higher, or self-reported use of antihypertensive medica-tion. Systolic and diastolic blood pressures were also ex-amined as separate dichotomous variables considering the same cutoff values.
−50 °C until being processed. Blood lead concentration was measured in duplicate by inductively coupled plasma mass spectrometry (ICP-MS) in the Adolfo Lutz Institute, São Paulo. To evaluate the accuracy of the re-sults, the standard reference material Toxic Metals in Bovine Blood, from National Institute of Standards and Technology (NIST 966 levels 1 and 2) was used. The ob-tained results were: 1,315 ± 0.05 μg/100 ml (level 1) and 24.95 ± 0.07 μg/100 ml (level 2), showing good agree-ment with the certified values, 1,459 ± 0.013 μg/100 ml and 25.27 ± 0.22 μg/100 ml, respectively. The within-and-between batch precision were 4% and 6% for 1,459μg/100 ml and 1% and 3% for 25.27μg/100 ml, re-spectively. The detection and the quantification limits were obtained by 10 consecutive measurements of a blood sample with low lead level. These limits were cal-culated as three times and 10 times the standard devi-ation of those measurements. The results were 0.0029 and 0.0096μg/100 ml for detection limit and quantifica-tion limit, respectively. Considering the diluquantifica-tion factor used for the sample preparation, the final limit of quan-tification was 0.20 μg/100 ml. Only one sample was below the limit of quantification and in this case the value of 0.20 μg/100 ml was assigned. All the analyses were performed in an ISO Class 7 cleanroom facility.
Information on sex, age (years), race, education, in-come class, occupation, smoking and alcohol consump-tion was obtained from each subject by the orally administered household interviews [21]. Race was cate-gorized as white and non-white according to reported answers. Education was based on the self-reported number of years of education completed, (0–3, 4–7, 8–11 and 12 or more years of study). Income class was defined according to the Economic Classification Criterion Brazil (Critério de Classificação Econômica Brasil - CCEB) from the Brazilian Association of Re-search Companies [24]. This tool estimates the purchas-ing power and economic status of respondents, divided into classes A through E. For this study, this variable was categorized as A/B classes (corresponding to the higher income levels), C (medium income level) and D/ E classes (related to the lower income levels). Occupa-tion was queried in terms of potential lead exposure, based on self-reported current or former employment in any of the following of the lead using industries as de-fined by CNAE (National Classification of Economic Ac-tivities). These included: manufacture and recycling of batteries, secondary smelters, alloy production, electro-plating, welding, PVC and other plastic manufacture and rubber recycling industry. Cigarette smoking was catego-rized as never, former and current smoker and alcohol consumption was categorized as either drinking or not drinking alcoholic beverages. Body mass index (BMI) in-formation was obtained from the physical examination
and calculated as weight in kilograms divided by the square of height in meters. Weight was measured with an electronic scale, with a precision of 0.1 kg and max-imum capacity of 150 kg. The individuals were weighted barefoot, standing upright at the center of the scale plat-form and wearing light clothing. Height was measured with a portable stadiometer with a precision of 0.1 m and maximum length of two meters. The participants stood, barefoot, with their back turned to the vertical surface of the equipment and head positioned in the Frankfurt plane, with arms relaxed at the side of the body, with palms facing the thighs united heels, touching the vertical part of the stadiometer and medial edges spaced apart. The movable part of the stadiometer was elevated until touching the vertex, compressing the hair [21]. Current antihypertensive medication use was self-reported and participants were considered as taking these medications according with the VI Brazilian Guidelines of Hypertension [23]. The antihypertensive medications were shown to the interviewer at the mo-ment of the interview. However, some of these medica-tions as carvedilol (alpha-beta adrenergic blocker) and
spironolactone (potassium-sparing diuretic), both pre-scribed for the treatment of congestive heart failure, and the medication verapamil retard (calcium channel blocker), used to treat cardiac arrhythmia, were not con-sidered as current use of antihypertensive medication [25, 26]. In the case of diuretics use, a non-specific medication for the treatment of hypertension, the par-ticipant was considered to have hypertension depending on the self-reported question. For this, the following question was asked to the respondent: “Which of the following diseases have you ever been told by a doctor or other health professional (doctor, nurse, pharmacist, etc.) do you have or had?” Total cholesterol, high-density lipoprotein (HDL), triglycerides and glucose were performed using automated methodology to Dimension® RXL biochemical system model. The low-density lipo-protein (LDL) was calculated using the Friedewald equa-tion [27].
performed Pearson correlation analysis to verify the cor-relations between systolic and diastolic blood pressure with blood lead levels.
Regression models were constructed based on a priori knowledge and biologic association with blood pressure (age, sex, antihypertensive medication use and blood lead log transformed). Other covariates were added to the model in two separated blocks: Model 1– sex, age, race, income, education, antihypertensive medication and blood lead level; Model 2 –model 1 + total choles-terol, triglycerides, glycemia, smoking, alcohol consump-tion and body mass index. A third model was further adjusted for occupation status. These variables were in-cluded because they were significantly associated with blood pressure outcomes in at least one of the models performed before the inclusion of blood lead, consider-ing ap< .20. Additionally, we performed regression ana-lyses with only the subgroup that was not taking antihypertensive medication to elucidate if we would find significant changes in results. After running each model, the distribution of the residuals was tested for normality. Statistical tests with p value < .05 were con-sidered statistically significant.
Results
The overall geometric mean of blood lead level was 1.97 μg/dL (95% CI, 1.89–2.04), and the means for the blood lead quartiles ranged from 0.96μg/dL to 4.21μg/ dL in the lowest and higher quartile, respectively. Blood lead levels were higher in men, in older participants (50 to 59 years old), in non-white, in smokers and drinkers, and in subjects with normal BMI. Participants currently or former employed in lead industries had higher blood lead levels (2.65 μg/dL; 95% CI, 2.31–3.05) than those not employed (Table 1).
Of the 948 participants in the sample, 519 (54.7%) were classified as hypertensive, of whom 398 were classi-fied as hypertensive according to their systolic and/or diastolic blood pressures, and 121 if they self-reported current use of antihypertensive medication. A total of 181 subjects had both systolic and diastolic hyperten-sion, 164 had only systolic hypertenhyperten-sion, 53 had diastolic hypertension. Among the 220 untreated subjects, 73 had systolic hypertension only, 39 had diastolic hypertension, and 108 had both systolic and diastolic hypertension. Of those who reported being treated for hypertension (n= 299), 91 had only systolic hypertension, 14 had diastolic hypertension, and 73 had both systolic and diastolic hypertension. Participants with hypertension (systolic blood pressure ≥140 mm Hg, diastolic blood pressure
≥90 mm Hg, or self-reported use of antihypertensive medication) had higher blood lead levels (2.04 μg/dL; 95% CI, 1.94–2.15) than those not hypertensive (1.87μg/ dL; 95% CI, 1.77–1.98) (Tables 1 and 2). The results of
the Pearson correlation analysis for systolic blood pres-sure and blood lead levels was r= 0.088, p < 0.005, and for diastolic blood pressure the coefficient wasr= 0.112, p < 0.005.
In unadjusted analysis, participants with elevated sys-tolic and diassys-tolic blood pressure presented higher blood lead concentration (2.16 μg/dL; 95% CI, 2.02–2.31) and (2.31 μg/dL; 95% CI, 2.13–2.51), compared with those with normal systolic and diastolic blood pressure (1.86 μg/dL; 95% CI, 1.78–1.95) and (1.86 μg/dL; 95% CI, 1.79–1.94), respectively. Hypertensive individuals had increased concentrations of total cholesterol, triglyc-erides and glycemia than those not hypertensive. Con-troversially, we observed that participants with higher levels of HDL had higher blood lead concentrations than those with decreased HDL (Tables 1 and 2).
In multivariate analysis, there was a weak association of blood lead with both systolic and diastolic blood pres-sure. After multivariable adjustment, participants in the quartile 4 of blood lead presented 0.06 mm/Hg (95% CI, 0.04–0.09) average difference in diastolic blood pressure comparing with those in quartile 1. For systolic blood pressure, the average difference was almost insignificant (Table 3). Participants in the 90th percentile of blood lead distribution had 0.07 mmHg (95% CI, 0.03 to 0.11) higher diastolic blood pressure compared with those participants in the 10th percentile of blood lead. The geometric mean of blood lead level of participants in the 10th percentile and in the 90th percentile was 0.74 μg/ dL (95% CI, 0.71–0.77) and 6.03 μg/dL (95% CI, 5.52– 6.58), respectively.
The adjusted OR for hypertension comparing the highest to the lowest blood lead quartiles was 2.54 (95% CI, 1.17–5.53). Compared with participants in the 10th percentile of blood lead, participants in the 90th per-centile presented higher OR for hypertension (OR: 2.77; 95% CI, 1.41 to 5.46) (Table 4).
When we further adjusted for occupational status, the results did not significantly change and the overall sig-nificance was maintained.
The results of the multivariate analysis when consider-ing only the subjects not takconsider-ing antihypertensive medi-cation (n= 649) were similar to those results of the sample including the whole population. Only a minor centesimal difference was observed for the OR and 95% CI as shown in Tables 3 and 4.
Discussion
Table 1Blood lead levels (μg/dL) by participant characteristics
Characteristic n(%) Percentile 50th (median) Interquartile range Min–max values Geometric means (95% CI) p-Valuea
Overall 948 (100) 1.94 1.44 0.46–45.62 1.97 (1.90, 2.04)
Sex
Male 421 (44.4) 2.46 1.72 0.65–45.62 2.59 (2.46, 2.73) <0.001
Female 527 (55.6) 1.59 0.99 0.46–27.91 1.58 (1.51, 1.65)
Age (years)
40–49 386 (40.7) 1.83 1.46 0.48–27.91 1.84 (1.73, 1.96) 0.001
50–59 294 (31.0) 2.09 1.42 0.54–21.83 2.13 (2.00, 2.28)
≥60 268 (28.3) 1.94 1.36 0.46–45.62 1.98 (1.84, 2.12)
Race
White 562 (59.3) 1.87 1.42 0.46–45.62 1.88 (1.79, 1.97) 0.084
Non white 386 (40.7) 2.03 1.48 0.49–24.49 2.09 (1.97, 2.23)
Education (years)
0–3 229 (24.2) 1.99 1.28 0.46–10.78 1.94 (1.81, 2.08) 0.055
4–7 357 (37.7) 1.94 1.51 0.51–45.62 2.00 (1.88, 2.14)
8–11 265 (28.1) 1.99 1.64 0.49–27.91 2.03 (1.88, 2.20)
12 or more 97 (10.0) 1.74 0.94 0.68–8.79 1.72 (1.56, 1.90)
Income classb
A and B 348 (36.8) 1.95 1.44 0.48–45.62 1.97 (1.85, 2.11) 0.259
C 514 (54.3) 1.97 1.49 0.46–13.03 1.98 (1.88, 2.08)
D and E 85 (8.9) 1.74 1.20 0.51–24.49 1.85 (1.61, 2.11)
Occupation
Exposed to lead 114 (12.0) 2.48 2.11 0.7–45.62 2.65 (2.31, 3.05) <0.001
Not exposed to lead 834 (88.0) 1.89 1.35 0.46–27.91 1.89 (1.82, 1.96)
Smoking
Never 498 (52.5) 1.71 1.10 0.46–45.62 1.68 (1.59, 1.76) <0.001
Former 268 (28.3) 2.05 1.57 0.56–8.53 2.11 (1.98, 2.25)
Current 182 (19.2) 2.64 2.18 0.87–27.91 2.73 (2.50, 2.98)
Alcohol Consumption
Do not drink 584 (61.6) 1.74 1.19 0.46–27.91 1.74 (1.67, 1.83) <0.001
Drink 364 (38.4) 2.26 1.72 0.56–45.62 2.38 (2.24, 2.53)
Systolic blood pressure
< 140 mm Hg 603 (63.6) 1.88 1.39 0.48–27.91 1.86 (1.78, 1.95) <0.001
≥140 mm Hg 345 (36.4) 2.07 1.58 0.46–45.62 2.16 (2.02, 2.31)
Diastolic blood pressure
< 90 mm Hg 714 (75.3) 1.86 1.35 0.46–45.62 1.86 (1.79, 1.94) <0.001
≥90 mm Hg 234 (24.7) 2.19 1.73 0.50–24.49 2.31 (2.13, 2.51)
Hypertensionc
No 429 (45.3) 1.88 1.46 0.49–27.91 1.88 (1.77, 1.98) 0.099
Yes 519 (54.7) 2.00 1.47 0.46–45.62 2.04 (1.94, 2.15)
Glycemia (mg/dL)
< 100 499 (52.6) 1.85 1.42 0.49–27.91 1.91 (1.81, 2.01) 0.278
difference observed in the 95% CI, showing a modest in-crease. However, the OR for hypertension was higher in participants in the quartile 4 of blood lead compared with those in the quartile 1 (OR = 2.54; 95% CI, 1.17– 5.53). The geometric mean blood lead concentration of 1.97 μg/dl (95% CI, 1.89–2.04) found in the present study was higher than the concentration of 1.64 μg/dl reported by Bushnik et al. [12], in a survey at national
level with the Canadian population aged 40 to 79 years old. These authors reported a significant association be-tween systolic and diastolic blood pressure and lead con-centrations for subjects aged 40 to 54 years old and for men, but not with the odds for hypertension [12].
Prospective studies have suggested that there is suffi-cient evidence to infer a causal relationship of lead ex-posure with hypertension, besides the modest strength
Table 1Blood lead levels (μg/dL) by participant characteristics(Continued)
HDL (mg/dL)
≥50 female≥40 male 483 (50.9) 2.04 1.68 0.49–27.91 2.13 (2.02, 2.26) 0.003
< 50 female <40 male 465 (49.1) 1.84 1.19 0.46–45.62 1.80 (1.71, 1.89)
LDLd(mg/dL)
< 160 767 (83.5) 1.90 1.42 0.46–27.91 1.92 (1.84–2.00) 0.574
≥160 151 (16.4) 2.01 1.36 0.60–12.88 2.07 (1.90–2.27)
Total cholesterol (mg/dL)
< 200 452 (47.7) 1.88 1.48 0.49–27.91 1.90 (1.80, 2.01) 0.188
≥200 496 (52.3) 1.99 1.36 0.46–45.62 2.03 (1.92, 2.14)
Triglycerides (mg/dL)
< 150 622 (65.6) 1.89 1.51 0.48–27.91 1.94 (1.85, 2.03) 0.296
≥150 326 (34.4) 2.01 1.31 0.46–45.62 2.02 (1.90, 2.16)
Body Mass Indexe(Kg/m2)
15 - <25 289 (30.8) 1.96 1.74 0.49–27.91 2.10 (1.95, 2.26) 0.004
25 - <30 357 (38.1) 2.03 1.40 0.50–21.83 2.02 (1.90, 2.14)
≥30 291 (31.1) 1.85 1.15 0.46–45.62 1.95 (1.37, 2.78)
at-Student and Kruskal-Wallis test.bAccording to ABEP, 2012. Data missing for one participant.cAccording with VI Diretriz Brasileira de Hipertensão. Hypertension
defined as systolic blood pressure≥140 mmHg or diastolic blood pressure≥90 mmHg or current antihypertensive medication.d30 missing data on this variable (n = 918).e11 missing data on this variable (n = 937)
Table 2Participants characteristics by hypertension statusa
Characteristics Hypertension (n= 519) No hypertension (n= 429) All (n= 948) Pvalueb
Age (years) 57.6 (0.46) 50.9 (0.44) 54.5 (0.34) <0.001
Sex (% male) 42 (0.02) 47 (0.02) 44.5 (0.16) 0.114
Race (% white) 58 (0.02) 61 (0.02) 59 (0.01) 0.375
Education (years of study) 5.62 (0.19) 7.24 (0.21) 6.35 (0.14) <0.001
Income class (% middle income class)c 59 (0.02) 48 (0.02) 54 (0.02) 0.001
Smoking
Former smoker (%) 32 (0.02) 23 (0.02) 28.3 (0.01) 0.001
Current smoker (%) 16 (0.16) 23 (0.02) 19 (0.01)
Alcohol intake (% drinker) 42 (0.02) 36 (0.02) 38.4 (0.01) 0.055
Total cholesterol (mg/dL) 206.8 (1.83) 200.5 (1.80) 203.9 (1.29) 0.020
Triglycerides (mg/dL) 169.4 (7.65) 129.2 (5.04) 151.2 (4.81) <0.001
Glycemia (mg/dL) 110.1 (1.52) 98.9 (0.89) 105.0 (0.94) <0.001
BMI (Kg/m2) 28.9 (0.23) 26.9 (0.27) 27.9 (0.18) <0.001
Blood lead (μg/dL)d 2.04 (1.94-2.15) 1.87 (1.77-1.98) 1.97 (1.89-2.04) 0.029
Occupation (% lead exposed) 11 (0.01) 13 (0.02) 12.0 (0.01) 0.278
a
Hypertension defined as systolic blood pressure≥140 mmHg or diastolic blood pressure≥90 mmHg or antihypertensive medication use.bChi-square, Wilcoxon or Kruskal-Wallis test.c
observed in these associations [3, 29–31]. Bone lead is considered a long-term biomarker for lead exposure, representing a cumulative dose in the body, which has been considered a better assessment of lead in epidemio-logical studies evaluating associations of cumulative ex-posures with chronic disease. Blood lead represents a short-term biomarker, reflecting recent exposure to the metal, but also provide variability of lead released from the bones [32]. The mobilization of lead from bone is in-creased during some periods of life, such as aging, preg-nancy and after the menopause in women [10, 32, 33]. Studies that measured both bone and blood lead re-ported that bone lead (patella and tibia bones), was posi-tively associated with hypertension, while blood lead was mostly associated with raised blood pressure [34, 35]. So the associations found between bone lead and current blood pressure indicate that past exposure as well as current exposure to lead are important biomarkers to evaluate blood pressure outcomes.
Studies with general population also found positive as-sociations between blood lead concentrations and
elevation on both systolic and diastolic blood pressure [6, 12, 34, 36, 37]. We identified a most significant asso-ciation of blood lead with diastolic blood pressure (0.06 mmHg; 95% CI, 0.04–0.09), while other studies re-ported most significant associations of blood lead with systolic blood pressure comparing with diastolic blood pressure [6, 9, 10, 31, 34, 36–38]. This variability is diffi-cult to be enlightened and may not be restricted to in-trinsic factors of blood pressure, but also depends on the measurement technique used, the measurer's ability, and other conditions under which the measure will be held [2].
Most recently, Hara et al. [6] reported that blood lead doubling was associated with higher systolic (+0,76 mm Hg; 95% CI, 0.38–1.13) and diastolic blood pressure (+0,43 mm Hg; 95% CI, 0.18–0.68), but not with the odds of prevalent hypertension in analyzing data from NHANES 2003–2010. Besides that, the study reported the results of stratified analysis of blood lead and blood pres-sure by sex and ethnicity, revealing distinct results regard-ing each population stratum [6]. Before that, Scinicariello et al. [39] published data from NHANES 1999–2006 and reported that blood lead was significantly associated with higher diastolic blood pressure among white men and women and in black men, while elevated systolic blood pressure was associated with blood lead only in blacks, but not in whites or in Mexican-American participants. Compared with American population, Brazilian adults may be exposed to distinct sources of lead, and the influ-ence of covariates may differ [20]. Besides, although the present study is based on a representative sample of adults, the number of participants did not allow us to per-form a fully stratified analysis.
Unlike what has been observed on the hypertensive ef-fects of lead in studies involving workers exposed to high levels of lead, environmental exposure is often asymptomatic and as other toxic effects of lead, the magnitude of raised blood pressure depends on the mag-nitude of the exposure [2, 3, 5, 11, 40, 41]. Another Table 3Change (95% CI) of systolic and diastolic blood pressure by blood lead levels (μg/dL)
Systolic blood pressure (mmHg)* Diastolic blood pressure (mmHg)
Model 1 Model 2 Model 1 Model 2
Blood lead (μg/dL)
Quartile 1 (≤1.32) 0.00 (reference) 0.00 (reference) 0.00 (reference) 0.00 (reference)
Quartile 2 (1.32–1.93) −0.00* −0.00* 0.04 (0.01–0.05) 0.03 (0.01–0.05)
Quartile 3 (1.93–2.76) −0.00* −0.00* 0.03 (0.01–0.06) 0.02 (0.00–0.05)
Quartile 4 (>2.76) −0.00* −0.00* 0.07 (0.04–0.09) 0.06 (0.04–0.09)
p-Trend <0.001 0.002 <0.001 <0.001
*
All Confidence Intervals (CI) for systolic blood pressure were−0.00 to -.000
Model 1 was adjusted for sex, age (40–49, 50–59,≥60), race (white, no white), education (years of study), income (continuous; according to Associação Brasileira de Empresas de Pesquisa, 2012) and antihypertensive medication (yes, no)
Model 2 was further adjusted for continuous total cholesterol (μg/dL), triglycerides (μg/dL), glycemia (μg/dL), smoking status (never, current and former), alcohol intake (yes, no) and body mass index, continuous (kg/m2
)
Table 4OR (95% CI) of hypertension by blood lead quartiles (μg/dL)
Model 1 Model 2
Blood lead (μg/dL)
Quartile 1 (≤1.32) 1.00 (reference) 1.00 (reference) Quartile 2 (1.32–1.93) 0.22 (0.02–2.97) 0.11 (0.01–1.59)
Quartile 3 (1.93–2.76) 0.58 (0.42–8.22) 0.40 (0.02–6.87)
Quartile 4 (>2.76) 2.28 (1.12–4.66) 2.54 (1.17–5.53)
p-Trend <0.001 0.003
90th–10th percentile 2.62 (1.40–4.91) 2.77 (1.41–5.46)
Model 1 was adjusted for sex (male, female), age (40–49, 50–59,≥60), race (white, no white), education (0–3, 4–7, 8–11 and 12 or more years of study), income (classes A/B, C, D/E; according to Associação Brasileira de Empresas de Pesquisa, 2012) and antihypertensive medication (yes, no)
perspective on the health effects of lead-associated in-creases in blood pressure is to consider the effect of a unit increase in median BLL on the overall distribution of blood pressure values in a population and the effect on number of persons with blood pressure elevations as-sociated with stroke and other endpoints. This was cal-culated by Schwartz [42], who reported that a 1 μg/dL increase in mean population blood lead in US white males aged 40–59, distributed over the range of blood pressure values in this population, would increase the numbers of persons at risk for myocardial infarction by 3200 per year, of strokes by 1300 per year, as well as an overall increase in clinical hypertension of 635,000 more cases. Pirkle et al. [43], using the opposite approach, based on a longitudinal analysis of NHANES II data, from 1976 to 1980, in which blood lead levels in white males aged 40 to 59 years decreased by 37%, found that this decrease resulted in 4.7% and 6.7% decrease in fatal and nonfatal myocardial infarctions and strokes, respect-ively [43].
The inclusion of confounding factors in regression models has been considered very important to control for residuals in such analysis, especially when examining small effects as the influence of lead in blood pressure [10]. The inclusion of inappropriate covariates in regres-sion models can attenuate associations between lead levels and the studied outcomes. Still, the absence of cer-tain variables in the analysis may overestimate the strength of the association [9, 34, 40]. In this study, we included in the analysis risk factors for cardiovascular disease such as smoking, alcohol consumption, sex, age, socioeconomic and demographic variables and BMI to account for covariates that are known to be associated with blood pressure outcomes. Even so, some unmeas-ured variables not included in the analysis may influence the association of lead and blood pressure as, for ex-ample, pre-existing diseases, genetic aspects and renal function [40].
Although not completely elucidated, some mecha-nisms of lead-related hypertension have been reported, such as: impaired renal function, reduction of nitric oxide (NO) bioavailability, increased oxidative stress, in-creased activity of the renin angiotensin system and down-regulation of soluble guanylate cyclase. As a con-sequence of such mechanisms, lead exposure leads to in-creased vascular tone and induce alterations of the adrenergic system leading to peripheral vascular resist-ance [3, 44, 45].
Oxidative stress has been described as the main mech-anism of lead-induced toxicity. Lead exposure promotes oxidative stress by enhancing the production of reactive oxygen species, and by decreasing antioxidant enzymes activity [45–49]. Even at low levels, lead triggers the oc-currence of events that are involved with the
development of hypertension and other cardiovascular diseases, which have been consistently reported in stud-ies conducted with animals and humans [50, 51]. The overload of oxygen reactive species leads to tissue injury and dysfunction through direct interaction with cell molecules, and through depletion of the antioxidant sys-tem. Lead interaction with biological macromolecules, such as lipids, proteins and DNA, results in disturbances in cell membranes, changing its structure and function-ing. Beyond that, lead interferes with the activity of im-portant antioxidant enzymes, such as glutathione, which can interact directly with reactive oxygen species, or can serve as a cofactor for the detoxification reactions in the presence of free radicals [52–55]. The activation of redox-sensitive transcription factors, such as the nuclear factor-κB (NF-κB), which stimulates the production of inflammatory substances associated with renal interstitial inflammation, and changes in the calcium channels function leading to alterations in vascular tone and re-activity, are also important factors contributing for alter-ations in blood pressure outcomes [51, 56].
Furthermore, lead-induced oxidative stress reduces the availability of NO, which is an endogenous catalyst of several biochemical processes with an important role in cardiovascular system regulation, leading to endothelial dysfunction [41]. Barbosa Jr et al. [57] reported that lead exposure exerted a significant inhibitory effect on NO production, as shown by analyses of nitrite concentra-tions in adults living in the Southeast region of Brazil, suggesting that this biological mechanism is possibly re-lated to the increased cardiovascular risk associated with lead exposure.
Some positive points to be highlighted in our study are the census based and the spatial analysis used to enroll participants. Besides that, the study included the measure-ment of multiple anthropometric and socioeconomic characteristics and the standardization of blood pressure measurements (≥3 readings) based on Brazilian Guide-lines, taken by trained researchers. However, some limita-tions of this study are the cross-sectional design that does not allow causal inferences about the association of blood lead and blood pressure; and the fact that we may not have measured all the potential confounders of the rela-tionship between hypertension and lead exposure.
factors for lead exposure exist among these populations. Although education and income have been considered significant predictors of blood lead levels in Americans, the historically difference observed among income level has been decreasing. Furthermore, some Pb-related out-comes, including blood pressure outout-comes, may vary by race/ethnicity, providing some evidence that some groups may be at higher risk of developing some dis-eases [7, 44, 58]. In Brazil these characteristics may have specific associations with both blood lead levels and hypertension, indicating that more studies with Brazilian adults are necessary to evaluate Pb-related health out-comes, as well as to provide an evaluation of blood lead levels in the general population.
Conclusions
We found a positive association between blood lead and diastolic blood pressure, and a significant association of blood lead and hypertension in Brazilians aged 40 years or older, living in southern Brazil. Our results add knowledge about the health risks associated with current environ-mental exposures to lead in Brazil, and encourage efforts to prevent lead exposure in the general population.
Abbreviations
ABEP:Associação Brasileira de Empresas de Pesquisa; AP-1: Activator protein-1; BLL: Blood lead levels; BMI: Body mass index; CCEB: Economic Classification Criterion Brazil; CI: Confidence interval; CNAE: National Classification of Economic Activities; DALYs: Disability adjusted life years; DBP: Diastolic blood pressure; HDL: High-density lipoprotein; ICP-MS: Inductively coupled plasma mass spectrometry; LDL: Low-density lipoprotein; NF-κB: Nuclear factor-κB; NHANES: National Health and Nutrition Examination Survey; NIST: National Institute of Standards and Technology; NO: Nitric oxide; OR: Odds ratio; Pb: Lead; SBP: Systolic blood pressure
Acknowledgements
“Not applicable”in this section.
Funding
This work was supported by the Coordination for the Improvement of Higher Level or Education Personnel (CAPES), through the Ministry of Health, Brazil.
Availability of data and supporting materials section
The study data are located in a secure server at the State University of Londrina, Brazil. All data are identified. The data are available upon request following the approve procedures of the VIGICARDIO Steering Committee (VIGICARDIO project:Cardiovascular diseases in Paraná State: Mortality, risk profile, drug therapy and complications). In summary, to get access to the data, external investigators need to submit a proposal indicating the objectives and analysis plan for accessing and analyzing the data. The study will be reviewed by he Steering Committee before approval. I am available for further information,Monica Maria Bastos Paoliello.
Author’s contributions
ACBAL, MMBP, EKS, ANA, RZ and AEM made contributions to conception, design, epidemiological analysis and data interpretation, drafting, and linking the exposure and health data. MRU made contributions to statistical analysis, and AEIC and ACMJ contributed to conception, design, and biological material analysis. All authors have made contributions and approved the final manuscript.
Competing interests
We declare that we have no actual or potential competing financial interests.
Consent for publication
“Not applicable”in this section.
Ethics approval and consent to participate
This cross-sectional study is part of a research project entitled“Cardiovascular diseases in Paraná State: Mortality, risk profile, drug therapy and complica-tions” –VIGICARDIO Study [21]. In compliance to the provisions in Resolution 196/96 from the National Health Council, Brazil, this research was approved by the Ethics Committee of the State University of Londrina, Paraná State, Brazil, with the issuance of opinion n. 236/10. Participants were asked to sign a consent form after the presentation of the research objectives. Each volun-teer consented to the publication of data. For each interview, two copies of the consent form were issued, one being given to the volunteer.
Publisher’s Note
Springer Nature remains neutral with regard to jurisdictional claims in published maps and institutional affiliations.
Author details
1Graduate Program in Public Health, Center of Health Sciences, State University of Londrina - UEL, Londrina, Paraná, Brazil.2Department of Environmental Health Sciences, Johns Hopkins Bloomberg School of Public Health, Baltimore, MD, USA.3Graduate Program in Toxicology, Faculty of Pharmaceutical Sciences of University of São Paulo–USP, Ribeirão Preto, São Paulo, Brazil.4Graduate Program in Health Sciences, Center of Health Sciences, State University of Londrina - UEL, Londrina, Paraná, Brazil. 5Department of Statistics, State University of Londrina - UEL, Londrina, Paraná, Brazil.6Department of Public Health, State University of Londrina– UEL, Londrina, Paraná, Brazil.7Department of Molecular Pharmacology, Albert Einstein College of Medicine, Bronx, NY 10461, USA.
Received: 9 July 2016 Accepted: 3 March 2017
References
1. Toxicological profile for lead. [http://www.atsdr.cdc.gov/toxprofiles/tp13. pdf]. Accessed 12 July 2016.
2. U.S. Environmental Protection Agency. Air Quality Criteria for Lead. [https:// cfpub.epa.gov/ncea/risk/recordisplay.cfm?deid=158823]. Accessed 12 July 2016.
3. Navas-Acien A, Guallar E, Silbergeld EK, Rothenberg SJ. Lead exposure and cardiovascular disease–a systematic review. Environ Health Perspect. 2007; 115(3):472–82.
4. Schwartz BS, Hu H. Adult lead exposure: time for change. Environ Health Perspect. 2007;115(3):451–4.
5. Den Hond E, Nawrot T, Staessen JA. The relationship between blood pressure and blood lead in NHANES III. National Health and Nutritional Examination Survey. J Hum Hypertens. 2002;16(8):563–8.
6. Hara A, Thijs L, Asayama K, Gu YM, Jacobs L, Zhang ZY, Liu YP, Nawrot TS, Staessen JA. Blood pressure in relation to environmental lead exposure in the national health and nutrition examination survey 2003 to 2010. Hypertension. 2015;65(1):62–9.
7. Muntner P, Menke A, DeSalvo KB, Rabito FA, Batuman V. Continued decline in blood lead levels among adults in the United States: the National Health and Nutrition Examination Surveys. Arch Intern Med. 2005;165(18):2155–61. 8. Harlan WR. The relationship of blood lead levels to blood pressure in the U.
S. population. Environ Health Perspect. 1988;78:9–13.
9. Schwartz J. The relationship between blood lead and blood pressure in the NHANES II Survey. Environmental Health Perspectives. 1988;78(15–22). 10. Nash D, Magder L, Lustberg M, Sherwin RW, Rubin RJ, Kaufmann RB,
Silbergeld EK. Blood lead, blood pressure, and hypertension in
perimenopausal and postmenopausal women. Jama. 2003;289(12):1523–32. 11. Nawrot TS, Thijs L, Den Hond EM, Roels HA, Staessen JA. An
epidemiological re-appraisal of the association between blood pressure and blood lead: a meta-analysis. J Hum Hypertens. 2002;16(2):123–31. 12. Bushnik T, Levallois P, D'Amour M, Anderson TJ, McAlister FA. Association
between blood lead and blood pressure: Results from the Canadian Health Measures Survey (2007 to 2011). Health Rep. 2014;25(7):12–22.
14. Schramm JMdA, Oliveira AFd, Leite IdC, Valente JG, Gadelha ÂMJ, Portela MC, Campos MR. Transição epidemiológica e o estudo de carga de doença no Brasil. Ciência & Saúde Coletiva. 2004;9:897–908
15. WHO. Global status report on noncomunicable diseases 2010. Burden: mortality, morbidity and risk factors. 2010:9–31.
16. Ibrahim MM, Damasceno A. Hypertension in developing countries. Lancet. 2012;380(9841):611–9.
17. Pereira M, Lunet N, Azevedo A, Barros H. Differences in prevalence, awareness, treatment and control of hypertension between developing and developed countries. J Hypertens. 2009;27(5):963–75.
18. Picon RV, Fuchs FD, Moreira LB, Fuchs SC. Prevalence of hypertension among elderly persons in urban Brazil: a systematic review with meta-analysis. Am J Hypertens. 2013;26(4):541–8.
19. Paoliello MM, De Capitani EM. Environmental contamination and human exposure to lead in Brazil. Rev Environ Contam Toxicol. 2005;184:59–96. 20. Almeida Lopes ACBd, Navas-Acien A, Zamoiski R, Silbergeld EK, Carvalho
Mde F, Buzzo ML, Urbano MR, Martins Ada C, Jr., Paoliello MM. Risk factors for lead exposure in adult population in southern Brazil. J Toxicol Environ Health A. 2015;78(2):92–108
21. Souza RKT, Bortoletto MSS, Loch MR, González AD, Matsuo T, Cabrera MAS, Remondi FA, Yonamine CY. Prevalência de fatores de risco cardiovascular em pessoas com 40 anos ou mais de idade, em Cambé, Paraná (2011): estudo de base populacional. Epidemiologia e Serviços de Saúde. 2013; 22(3):435–44.
22. Instituto Brasileiro de Empresas de Pesquisa. Contagem da população. [http://www.ibge.gov.br/home/estatistica/populacao/contagem2007/default. shtm]. Accessed 28 July 2015.
23. SBH. Sociedade Brasileira de Hipertensão. VI Diretrizes BrasileIiras de Hipertensão. Revista Hipertensão. 2010;13(1).
24. Associação Brasileira de Empresas de Pesquisa. Critério de Classificação Econômica Brasil. http://www.abep.org/criterio-brasil. Accessed 12 July 2016. 25. Bocch EA, Marcondes-Braga FG, Bacal F, Ferraz AS, Albuquerque D, Rodrigues
D. Sociedade Brasileira de Cardiologia. Atualização da Diretriz Brasileira de Insuficiência Cardíaca Crônica. Arq Bras Cardiol. 2012;98(1supl 1):1–33. 26. Lorga A, Filho AL, D’Ávila A, Jr AR, Paola AAV, Pedrosa A, Costa ÁB, Peres A,
Grupi C, Cirenza C, et al. Diretrizes para Avaliação e Tratamento de Pacientes com Arritmias Cardíacas. Arq Bras Cardiol. 2002;79:1–50. 27. Friedewald WT, Levy RI, Fredrickson DS. Estimation of the concentration of
low-density lipoprotein cholesterol in plasma, without use of the preparative ultracentrifuge. Clin Chem. 1972;18(6):499–502. 28. STATACORP. Stata Statistical Software: Release 14. StataCorp LP. 2015. 29. Glenn BS, Stewart WF, Links JM, Todd AC, Schwartz BS. The longitudinal
association of lead with blood pressure. Epidemiology. 2003;14(1):30–6. 30. Moller L, Kristensen TS. Blood lead as a cardiovascular risk factor. Am J
Epidemiol. 1992;136(9):1091–100.
31. Weiss ST, Munoz A, Stein A, Sparrow D, Speizer FE. The relationship of blood lead and systolic blood pressure in a longitudinal study of policemen. Environ Health Perspect. 1988;78:53–56.
32. Hu H, Shih R, Rothenberg S, Schwartz BS. The epidemiology of lead toxicity in adults: measuring dose and consideration of other methodologic issues. Environ Health Perspect. 2007;115(3):455–62.
33. Silbergeld EK. Lead in bone: implications for toxicology during pregnancy and lactation. Environ Health Perspect. 1991;91:63–70.
34. Martin D, Glass TA, Bandeen-Roche K, Todd AC, Shi W, Schwartz BS. Association of blood lead and tibia lead with blood pressure and hypertension in a community sample of older adults. Am J Epidemiol. 2006;163(5):467–78. 35. Cheng Y, Schwartz J, Sparrow D, Aro A, Weiss ST, Hu H. Bone lead and
blood lead levels in relation to baseline blood pressure and the prospective development of hypertension: the Normative Aging Study. Am J Epidemiol. 2001;153(2):164–71.
36. Bost L, Primatesta P, Dong W, Poulter N. Blood lead and blood pressure: evidence from the Health Survey for England 1995. J Hum Hypertens. 1999;13(2):123–8. 37. Sharp DS, Osterloh J, Becker CE, Bernard B, Smith AH, Fisher JM, Syme SL,
Holman BL, T. J. Blood pressure and blood lead concentration in bus drivers. Environ Health Perspect. 1988;78:131–137
38. Kromhout D. Blood lead and coronary heart disease risk among elderly men in Zutphen, The Netherlands. Environ Health Perspect. 1988;78:43–6. 39. Scinicariello F, Abadin HG, Murray HE. Association of low-level blood lead and
blood pressure in NHANES 1999–2006. Environ Res. 2011;111(8):1249–57. 40. Agency for Toxic Substances and Disease Registry. Toxicological Profile for
Lead. [http://www.atsdr.cdc.gov/toxprofiles/tp13.pdf]. Accessed 12 July 2016.
41. Vaziri ND, Gonick HC. Cardiovascular effects of lead exposure. Indian J Med Res. 2008;128(4):426–35.
42. Schwartz J. Lead, blood pressure and cardiovascular disease in men. Arch Environ Health. 1995;50(1):31–7.
43. Pirkle JL, Schwartz J, Landis JR, Harlan WR. The relationship between blood lead levels and blood pressure and its cardiovascular risk implications. Am J Epidemiol. 1985;121(2):246–58.
44. U. S. (Environmental Protection Agency). Integrated Science Assessment for Lead. [http://cfpub.epa.gov/ncea/cfm/recordisplay.cfm?deid=255721-Download]. Accessed 14 Oct 2015.
45. Wang L, Wang H, Hu M, Cao J, Chen D, Liu Z. Oxidative stress and apoptotic changes in primary cultures of rat proximal tubular cells exposed to lead. Arch Toxicol. 2009;83(5):417–27.
46. Vaziri ND, Lin CY, Farmand F, Sindhu RK. Superoxide dismutase, catalase, glutathione peroxidase and NADPH oxidase in lead-induced hypertension. Kidney Int. 2003;63(1):186–94.
47. Farmand F, Ehdaie A, Roberts CK, Sindhu RK. Lead-induced dysregulation of superoxide dismutases, catalase, glutathione peroxidase, and guanylate cyclase. Environ Res. 2005;98(1):33–9.
48. Pande M, Flora SJ. Lead induced oxidative damage and its response to combined administration of alpha-lipoic acid and succimers in rats. Toxicology. 2002;177(2–3):187–96.
49. Martinez-Haro M, Green AJ, Mateo R. Effects of lead exposure on oxidative stress biomarkers and plasma biochemistry in waterbirds in the field. Environ Res. 2011;111(4):530–8.
50. Vaziri ND, Khan M. Interplay of reactive oxygen species and nitric oxide in the pathogenesis of experimental lead-induced hypertension. Clin Exp Pharmacol Physiol. 2007;34(9):920–5.
51. Vaziri ND. Mechanisms of lead-induced hypertension and cardiovascular disease. Am J Physiol Heart Circ Physiol. 2008;295(2):H454–465.
52. Cai H, Harrison DG. Endothelial Dysfunction in Cardiovascular Diseases: The Role of Oxidant Stress. Circ Res. 2000;87(10):840.
53. Vaziri ND, Rodriguez-Iturbe B. Mechanisms of Disease: oxidative stress and inflammation in the pathogenesis of hypertension. Nat Clin Pract Neph. 2006;2(10):582–93.
54. Loikkanen J, Naarala J, Vahakangas KH, Savolainen KM. Glutamate increases toxicity of inorganic lead in GT1-7 neurons: partial protection induced by flunarizine. Arch Toxicol. 2003;77(12):663–71.
55. Ding Y, Gonick HC, Vaziri ND. Lead promotes hydroxyl radical generation and lipid peroxidation in cultured aortic endothelial cells. Am J Hypertens. 2000;13(5):552–5. 56. Korashy HM, El-Kadi AOS. The role of redox-sensitive transcription factors
NF-κB and AP-1 in the modulation of the Cyp1a1 gene by mercury, lead, and copper. Free Radic Biol Med. 2008;44(5):795–806.
57. Barbosa Jr F, Sertorio JT, Gerlach RF, Tanus-Santos JE. Clinical evidence for lead-induced inhibition of nitric oxide formation. Arch Toxicol. 2006;80(12):811–6. 58. Scinicariello F, Yesupriya A, Chang MH, Fowler BA. Modification by ALAD of
the association between blood lead and blood pressure in the U.S. population: results from the Third National Health and Nutrition Examination Survey. Environ Health Perspect. 2010;118(2):259–64.
• We accept pre-submission inquiries
• Our selector tool helps you to find the most relevant journal
• We provide round the clock customer support
• Convenient online submission
• Thorough peer review
• Inclusion in PubMed and all major indexing services
• Maximum visibility for your research
Submit your manuscript at www.biomedcentral.com/submit