doi:10.3926/jiem.2009.v2n1.p128-152 ©© JIEM, 2009 – 2(1): 128-152 - ISSN: 2013-0953
The roles of communication process for an effective lean
manufacturing implementation
Perumal Puvanasvaran
1; Hamdan Megat
2; Tang Sai Hong
2; Muhamad Mohd.Razali
11
University Technical Malaysia (MALAYSIA);
2University Putra Malaysia (MALAYSIA)
[email protected]
;
[email protected]
;
[email protected]
Received October 2008 Accepted March 2009
Abstract:
Many companies are implementing lean manufacturing concept in order to
remain competitive and sustainable, however, not many of them are successful in the
process due to various reasons. Communication is an important aspect of lean process in
order to successfully implement lean manufacturing. This paper determines the roles of
communication process in ensuring a successful implementation of leanness in
manufacturing companies. All the information of lean manufacturing practices and roles of
communication in the implementation were compiled from related journals, books and
websites. A study was conducted in an aerospace manufacturing in Malaysia. A five-point
scale questionnaire is used as the study instrument. These questionnaires were distributed
to 45 employees working in a kitting department and to 8 top management people. The
results indicate that the degree of leanness were moderate.
Keywords:
leanness, communication process, aerospace company
1 Introduction
doi:10.3926/jiem.2009.v2n1.p128-152 ©© JIEM, 2009 – 2(1): 128-152 - ISSN: 2013-0953
United Kingdom organizations have accomplished lean manufacturing implementation successfully. A number of variables may have impacts on lean implementation, and management support plays an important role in a lean manufacturing implementation (Worley et al., 2006). However, since lean implementation involves employees at all levels, there is a need for a good communication process to enable a smooth flow of the process. One of the main challenges of communication is to ensure that the changes are being readily accepted and implemented by everyone at all levels.
Karlsson et al. (1996) stated that lean should be seen as a direction and the focus lies on the change in the determinants. The determinants that are able to reflect changes in an effort to become lean had been identified by Karlsson et al. (1997). It is essential to note that lean productions viewed a complex organizational principle that requires major changes in a company (Mathaisel et al., 2000). Hence, there is a positive relationship between investments in the supporting manufacturing infrastructure and actual changes towards lean manufacturing (Soriano-Meier et al., 2002).
1.1 Problem Statement
The company claims to have implemented lean manufacturing for about two years. The lean manufacturing practices that had been carried out are Continuous Improvement, 5’s and General Visual Management, Cellular Manufacturing, Value Stream Mapping, Total Productive Maintenance and Pull Production. Although management declared huge support for these practices, it has been noted that the communicative aspect is not emphasized in the implementation of leanness.
doi:10.3926/jiem.2009.v2n1.p128-152 ©© JIEM, 2009 – 2(1): 128-152 - ISSN: 2013-0953
1.2 Objective
The overall objective of this study is to evaluate the degree of leanness and communicative process employed in the implementation of leanness. The specific objectives of this study are:
To determine the degree of adoption of lean production principles in the organization.
To determine the level of communication process that supports
manufacturing infrastructure to become lean.
1.3 Significant of the study
The results of this study will show the degree of leanness implemented in the company and the roles played by communication process in lean implementation. This will help the company to identify the problems in the implementation of an effective lean manufacturing system. It can provide answers to questions such as: “How communication process can support leanness?”, “Where should we pay more attention to improve better communication of leanness implementation?” and “What should be done for a better communication in the implementation of lean process?” Consequently, the company is able to improve and sustain their lean manufacturing performance through a systematic communicative approach. Thus, it will increase and maintain company’s competitiveness in the industry. Besides that, a successful lean implementation by the company, supported by a systematic communicative approach will promote the lean manufacturing to other industries in Malaysia.
1.4 Scope of the study
doi:10.3926/jiem.2009.v2n1.p128-152 ©© JIEM, 2009 – 2(1): 128-152 - ISSN: 2013-0953
1.5 Hypotheses
The data generated will enable the testing of a number of hypotheses for this study. However the study will concentrate on these hypotheses:
H1: The claim that the company has adopted lean manufacturing principles by making actual changes in the direction of the lean manufacturing principles.
H2: Communication process plays important roles in lean production
programs together with the support of manufacturing infrastructure.
2 Literature review
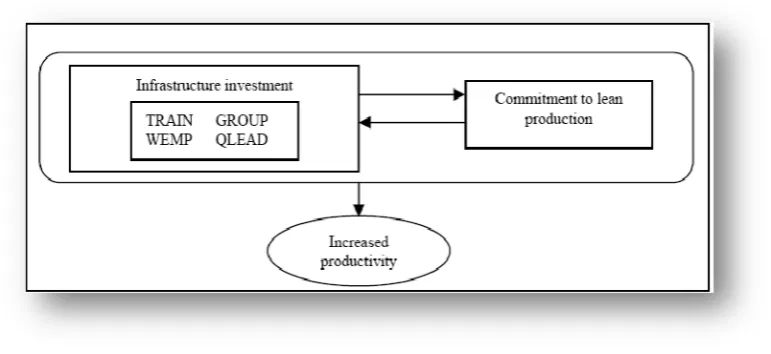
According to case studies conducted by Boyer, (1996) and Soriano-Meier et al. (2002), there are two major issues that will influence the implementation of lean manufacturing in a company. They are management commitment to lean manufacturing and supporting in manufacturing infrastructure (SMI). In their research, they focus on four infrastructural investments: Quality Leadership (QLEAD), Group Problem Solving (GROUP), Training (TRAIN), and Worker Empowerment (WEMP). Boyer (1996) mentioned that the support and emphasis which places on these infrastructural investments is considered to be a critical component which contributes to the success of lean production. Figure 1 illustrates the concept of lean producers who truly invest in the lean implementation.
doi:10.3926/jiem.2009.v2n1.p128-152 ©© JIEM, 2009 – 2(1): 128-152 - ISSN: 2013-0953
According to Boyer (1996), management that fails to embrace the implementation may interrupt the effort. Top management should not only demonstrate commitment and leadership, but it must also work to create interest in the implementation and communicate the change to everyone within the organization. Management must be connected to the project and involved in the lean manufacturing events. If employees feel that the management team does not respect their efforts, discouragement may exist and the lean manufacturing effort will fail. Though it is often desirable to drive change from the factory floor, it is important that a conversion to lean manufacturing be driven by the executive management team. On the other hand Gatchalian (1997) stated that the principles in TQM could only succeed if there is well-informed quality leadership that sustains the continuous improvement process.
Boyer, (1996) stated the successful implementation of lean production relies on well-trained employees. In a lean production environment, training is pivotal in order to develop a workforce, which is capable of shouldering the increased responsibilities, to develop multi-skilled workers, and to create an environment in which workers have the skills and ability to push for continuous improvement. In reference to Womack, et al. (1990), Boyer concluded that plants which allocate greater resources for the training of the workforce have been shown to have increased productivity.
Forrester, (1995) stated that lean manufacturing is usually accompanied by a shift towards exposure and problem solving. This changes calls for a new approach in problem solving. Boyer, (1996) mentioned that teamwork and group problem solving is a critical component of TQM and JIT.In tandem, teamwork and group problem solving serve to crash barriers and to improve the flow of information through a company, thus leading to improved productivity. Working as groups, while utilizing appropriate problem solving techniques, will also increase efficiency and pride in work improvement outputs (Gatchalian, 1997).
doi:10.3926/jiem.2009.v2n1.p128-152 ©© JIEM, 2009 – 2(1): 128-152 - ISSN: 2013-0953
There are three similar researches conducted by Karlsson et al. (1996), Boyer (1996) and Soriano-Meier et al. (2002) in different industries. Those researches will serve as apt guidelines for this project.
Karlsson et al. (1996) developed an operationalized model, which can be used to assess the changes taking place in an effort to introduce lean production. Authors have limited the factors that concern the work organization in the manufacturing part of a company. This model has been developed using available theory, and has also benefited from an empirical test. By referring to the book “The Machine that Changed the World”, authors had developed an operationalized model, which summarizes the important principles contained within lean production. The purpose is to find measurable determinants of what constitutes such a system in manufacturing company.
The testing of the model has been conducted in an international manufacturing firm producing mechanical and electronic office equipment. The company restructures the operations by using lean production as the model in late 1991.they spent first year on planning and preparation. In 1993, the physical and organizational changes started. The final model has implications both for research and practice. For research, it can be used as a model for operationalzing lean production in order to be able to study change processes properly. In practice, the model can be used as a checklist to assess the development taking place in an effort to become lean.
doi:10.3926/jiem.2009.v2n1.p128-152 ©© JIEM, 2009 – 2(1): 128-152 - ISSN: 2013-0953
The research sample consists of 491 metalworking industries. The instrument was pre-tested and then sent by mail to the manufacturing plants. The survey yielded 202 usable responses. Scale used which have been shown to be reliable and valid in previous research, and also evaluated two types of reliability, inter-item and inter-rater. The result of research shows that the correlations between each of the infrastructural investment variables and management commitment to JIT and TQM are significant. Regression used to determine the strength of the relationship between investment in infrastructure and commitment to lean production. Both of the results support research hypothesis that lean producers invest in the infrastructure of the firm in order to support their commitment to JIT and TQM.
On the other hand, Soriano-Meier et al., with the objective to develop the survey to examine the relationship between the main components of the Karlsson et al. (1996) conceptual framework, which are the adoption of lean production principles and managerial commitment to lean production. Beside that, the author also used the measurement of managerial commitment as based on a model developed by Boyer (1996).
The survey was completed by over 30 firms in the UK ceramics tableware industry and so represents a comprehensive overview of the state of play in that sector. The population was firms with at least 35 employees. 33 out of 36 of target firms agreed to participate and all completed the questionnaires. The sources of information were at two levels of the organization: top management and production and operation managers. Two different questionnaires were directed to each level. One set of questionnaire is for latter level, used to gauge the extent of adoption of lean production principles. Another set is for managing director, used to measure the level of commitment of management to lean production. The two groups of questionnaires measured different variables and, therefore, were analyzed independently.
doi:10.3926/jiem.2009.v2n1.p128-152 ©© JIEM, 2009 – 2(1): 128-152 - ISSN: 2013-0953
firms’ claims to the adoption of lean production and actual changes made in this direction. Finally, there is a positive relationship between investment in SMI and actual changes towards lean principles, and performance.
Meanwhile, the information related to the implementation of leanness must be clearly spelled out to everyone from top to bottom in the organization. This is very important as the communication process will pave way for people to accept the new concept and able to overcome resistance towards new changes in their work.
Communication is very important and is inseparable from the business environment. Little (1977), highlighted that “A substantial amount of the day to day communication that goes on in any business is spoken communication between individuals (face-to-face communication) or between individual and a small group (committee work, oral reporting to a board, instruction given to a group of subordinates etc.”
Warten L.Thomas (1985) pointed out that to achieve real success at workplace, one must be able to communicate what one knows. Even, Le Vassan (1994) has stressed that effective communication is certainly an added asset for the business sector to function in the economic network. It is important to use the technical knowledge to explore a problem and suggest ways of solving it. One must be able to assemble information, analyze it and report the findings in a manner that will lead it to more efficient procedures, better ways of doing things.”
3 Methodology
3.1 Questionnaire development
The questionnaire was developed by referring to previous researches conducted by Boyer, (1996) and Soriano-Meier et al., (2002) and Karlsson et al., (1996). The instrument can be adapted for use in aircraft industries although the target industries in the above researches vary.
There were two parts in the questionnaire. The first part was used to measure the degree of adoption of lean manufacturing principles and the degree of leanness of the company. The respondents will rate nine variables with the provided odd-numbered alternative scale. These nine variables were adopted from Soriano-Meier
doi:10.3926/jiem.2009.v2n1.p128-152 ©© JIEM, 2009 – 2(1): 128-152 - ISSN: 2013-0953
continuous improvement, zero defects, just-in-time, pull instead of push, multifunctional teams, decentralized responsibilities, integrated functions and vertical information functions. The response scale is 1 through 5, representing the range of no adoption, less adoption, partial adoption, do adoption and totally adoption.
The second part of the questionnaire was used to measure the managerial commitment and their support in the manufacturing infrastructures. The supporting manufacturing infrastructure measured is Worker Empowerment, Training, Group Problem Solving and Quality Leadership, which was stated by Boyer (1996). The first variable is rated by score range from 1 to 5 representing no emphasis, less
emphasis, moderate emphasis, do emphasis and extreme emphasis. The last three
variables rated with same score range but with different headings - are strongly
disagree, disagree, moderate, agree and strongly agree. In this part, the
respondents have to rate the management commitments to six lean practices mentioned in first chapter. The score range is from 1 to 5, representing no commitment, less commitment, partial commitment, do commitment and total commitment.
3.2 Pilot test
A pilot test was conducted to ensure the results of the questionnaire are valid and meet the objectives of this project. This is done by distributing questionnaire to two lean expertise of the company. A discussion was held with the respondents regarding the questionnaire and the feedback given by the respondents helped the researcher to edit and make changes to the questionnaire. Besides, based on the pre-test, total time spent to answer the questionnaire is ascertained.
3.3 Questionnaire modification
doi:10.3926/jiem.2009.v2n1.p128-152 ©© JIEM, 2009 – 2(1): 128-152 - ISSN: 2013-0953
3.4 Sending and receiving questionnaire
The questionnaire is directed to three levels of the company, which are, top management, middle management, and shop floor workers. For the top management level respondents, the questionnaires were answered by all heads of departments of the company. However, the questionnaire was limited to the last two levels of kitting department. The feedback was received within two weeks from a total of 53 respondents.
3.5 Data analyzing
In the first part of the questionnaire, the mean and standard deviation were computed with the scores of the nine variables. The mean is the value of the degree of adoption (DOA). Degree of leanness (DOL) was measured as the mean value of the nine separate variables in the model. Degree of commitment (DOC) was measured by the level of investment in supporting manufacturing infrastructure, as measured by Worker Empowerment, Training, Group Problem Solving and Quality Leadership.
There are a number of different reliability coefficients. One of the most commonly used is Cronbach’s alpha (Coakes, 2005). It is used to assess the internal consistency reliability of several items or scores that the researcher wants to add together to get a summary or summated scale score (Morgan et al., 2004). Cronbach’s alpha is based on the average correlation of items within a test if the items are standardized (Coakes, 2005). The alpha value should be positive and usually greater than 0.70 in order to provide good support for internal consistency reliability (Morgan et al., 2004).
doi:10.3926/jiem.2009.v2n1.p128-152 ©© JIEM, 2009 – 2(1): 128-152 - ISSN: 2013-0953
Linear Regression estimates the coefficient of the linear equation, involving one or more independent variables, which best predicted the value of the dependent variable. For each value of the independent variables, the distribution of the dependent variable must be normal. The variance of the distribution of the dependent variable should be constant for all values of the independent variable. The relationship between the dependent variable and each independent variable should be linear, and all observations should be independent (Morgan et al., 2004).
There are three major regression models, which are simultaneous regression, hierarchical regression and stepwise regression. These models differ in two ways: first, in the treatment of overlapping variability due to correlation of the independent variables, and second, in terms of the order of entry of the independent variables into the equation. Regression analysis was used to determine the strength of the relationship between the supporting manufacturing infrastructure variables and the commitments to lean manufacturing. Regression between the degree of adoption and the nine variables was also measured. With these correlation and regression analyses, the two hypotheses of the project will be proved or rejected.
4 Results
The response showed that all the workers and management are happy to take part in the study. The number of employees from kiting department that are willing to participate were only 35 people, which is 77.78% as some of them were busy with their own work and others have resigned, on leave, out station, or attending courses. On top of that, three feedbacks were rejected by researcher because the respondents rated the entire questions with the same answer or called patterned response bias, which is in line with Grandzol et al. (1998) opinion that this kind of feedback will affect the analysis of the result.
Feedback Number of employees Percentage
Accepted 40 75.47%
Rejected 3 5.66%
Excluded 10 18.87%
Total 53 100
doi:10.3926/jiem.2009.v2n1.p128-152 ©© JIEM, 2009 – 2(1): 128-152 - ISSN: 2013-0953
Based on the statistics in Table 1, there were 40 feedbacks accepted with 75.47%. Number of feedbacks rejected is 3, which is 5.66%. Total number of employees who were unwilling participants were 10 person or 18.87%. Therefore, the analysis of this study was based on 40 employees of the company. The higher number of people who want to take part in the study means that they are very positive towards the new changes and really understand what is happening in the department. This could happen only if there is a very good communication and interaction between the various levels of employees. A good communication process ensures that the employees were more receptive to changes and were willing to accept and carry out the new ideas.
Figure 2 indicates the percentage of the respondents based on their levels in the company. From the figure, the highest percentage of respondents is from bottom level, which is 57.5%, followed by middle level with 22.5%. The lowest percentage of respondents is from top level, which is only 20 %.
Figure 2. “Respondent’s Status in Percentage”.
4.1 Reliability
doi:10.3926/jiem.2009.v2n1.p128-152 ©© JIEM, 2009 – 2(1): 128-152 - ISSN: 2013-0953
degree of adoption and the items if deleted. The items represent the questions in the questionnaire.
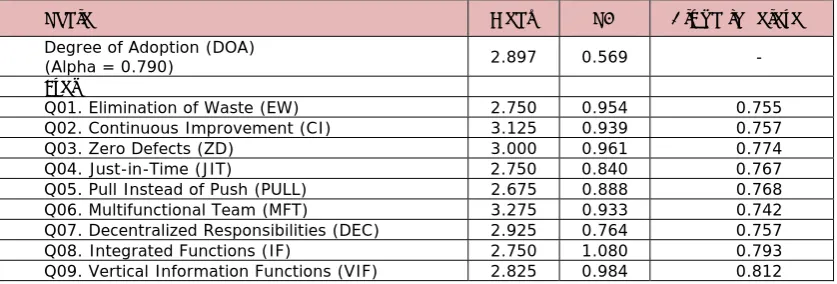
Table 4.4a shows that the Alpha value for degree of adoption is 0.790, which exceeds the threshold. With the exception of item Q09, Vertical Information Functions, the scale reliabilities are highest when all the nine items are included, which is 0.812. But the Alpha value just increased slightly, approximately 2.8% of increment, even after elimination of this item. Therefore the elimination needs not necessarily to be justified (Grandzol et al., 1998).
Scale Mean SD Alpha if deleted
Degree of Adoption (DOA)
(Alpha = 0.790) 2.897 0.569 -
Item
Q01. Elimination of Waste (EW) 2.750 0.954 0.755
Q02. Continuous Improvement (CI) 3.125 0.939 0.757
Q03. Zero Defects (ZD) 3.000 0.961 0.774
Q04. Just-in-Time (JIT) 2.750 0.840 0.767
Q05. Pull Instead of Push (PULL) 2.675 0.888 0.768
Q06. Multifunctional Team (MFT) 3.275 0.933 0.742
Q07. Decentralized Responsibilities (DEC) 2.925 0.764 0.757
Q08. Integrated Functions (IF) 2.750 1.080 0.793
Q09. Vertical Information Functions (VIF) 2.825 0.984 0.812
Table 2. “Reliability analyses of DOA of lean manufacturing principles (N=40)”.
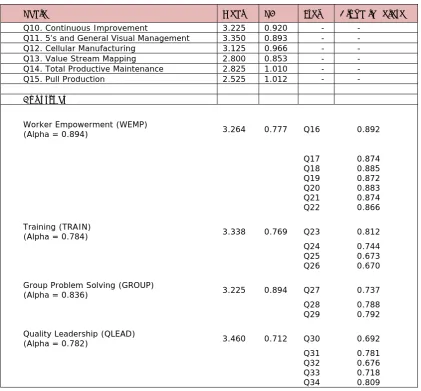
Meanwhile Table 3 shows the results of reliability analyses for each set of supporting manufacturing infrastructure construct indicators; Worker Empowerment, Training, Group Problem Solving and Quality Leadership. In addition, the mean and standard deviation for management commitment in each lean manufacturing practice are also indicated.
doi:10.3926/jiem.2009.v2n1.p128-152 ©© JIEM, 2009 – 2(1): 128-152 - ISSN: 2013-0953
4.2 Correlation
Correlation is the measure of the degree of association between two variables when both are measured on a series of objects (Bower, 2000). Spearman rho will be computed for both cases because the variables are not normally distributed (Coakes, 2005).
Scale Mean SD Item Alpha if deleted
Q10. Continuous Improvement 3.225 0.920 - -
Q11. 5’s and General Visual Management 3.350 0.893 - -
Q12. Cellular Manufacturing 3.125 0.966 - -
Q13. Value Stream Mapping 2.800 0.853 - -
Q14. Total Productive Maintenance 2.825 1.010 - -
Q15. Pull Production 2.525 1.012 - -
Construct
Worker Empowerment (WEMP)
(Alpha = 0.894) 3.264 0.777 Q16 0.892
Q17 0.874
Q18 0.885
Q19 0.872
Q20 0.883
Q21 0.874
Q22 0.866
Training (TRAIN)
(Alpha = 0.784) 3.338 0.769 Q23 0.812
Q24 0.744
Q25 0.673
Q26 0.670
Group Problem Solving (GROUP)
(Alpha = 0.836) 3.225 0.894 Q27 0.737
Q28 0.788
Q29 0.792
Quality Leadership (QLEAD)
(Alpha = 0.782) 3.460 0.712 Q30 0.692
Q31 0.781
Q32 0.676
Q33 0.718
Q34 0.809
Table 3. “Reliability analyses for management commitment in lean manufacturing practices and the SMI (N=40)”.
doi:10.3926/jiem.2009.v2n1.p128-152 ©© JIEM, 2009 – 2(1): 128-152 - ISSN: 2013-0953
Information Functions to degree of adoption is significant as well, where p is less than 0.05. As shown in table 4.5a, correlation between degree of adoption and Continuous Improvement has the largest correlation, where value r is equal to 0.70.
Variable EW CI ZD JIT PULL MTF DEC IF VIF
DOA 0.68** 0.70** 0.60** 0.49** 0.57** 0.53** 0.57** 0.48** 0.34* Predictor
variable
EW - 0.64** 0.52** 0.20 0.44** 0.47** 0.29 0.21 -0.01
CI - 0.38* 0.42** 0.29 0.45** 0.43** 0.07 0.20
ZD - 0.27 0.41** 0.39* 0.11 0.12 -0.01
JIT - 0.50** 0.55** 0.33* 0.13 0.06
PULL - 0.50** 0.31* 0.07 -0.17
MTF - 0.32* 0.04 0.07
DEC - 0.43** 0.44**
IF - 0.53**
VIF -
* p < .05; ** p< .01
Table 4. “Inter-correlation for DOA and predictors variables (N=40)”.
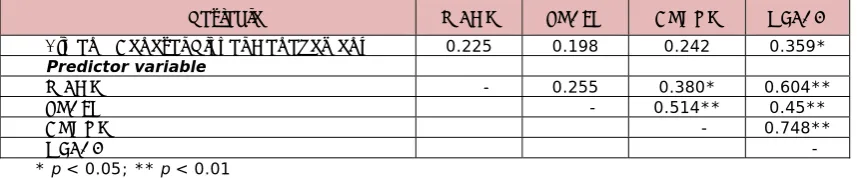
Table 5 indicates the correlation between the predictor variables and management commitment to 5’s General Visual Management. Quality Leadership was the only variable which significantly correlated to the management commitment, where r is equal to 0.359 with p less than 0.05. All predictor variables positively correlated to the management commitment.
Variable WEMP TRAIN GROUP QLEAD
5’s and General Visual Management 0.225 0.198 0.242 0.359*
Predictor variable
WEMP - 0.255 0.380* 0.604**
TRAIN - 0.514** 0.45**
GROUP - 0.748**
QLEAD -
* p < 0.05; ** p < 0.01
Table 5. “Inter-correlation for management commitment and predictors variables (N=40)”.
4.3 Regression
doi:10.3926/jiem.2009.v2n1.p128-152 ©© JIEM, 2009 – 2(1): 128-152 - ISSN: 2013-0953
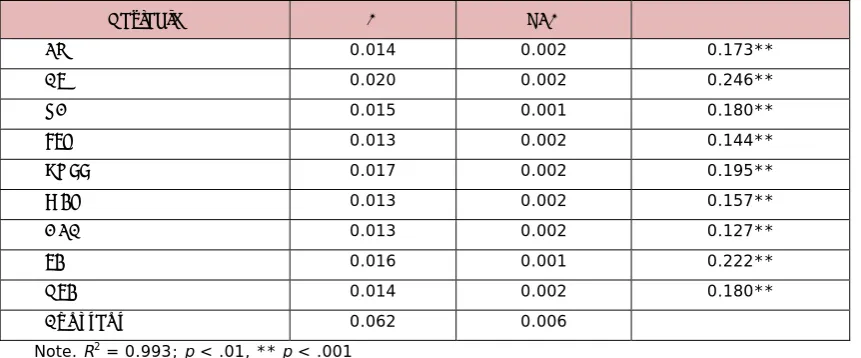
Simultaneous multiple regression was conducted to investigate the best predictors of degree of adoption. In simultaneous model, all independent variables enter the regression equation at once to examine the relationship between the whole set of predictors and the dependent variable (Coakes, 2005). This is because all the nine independent variables are significantly related to dependent variable. The beta coefficients are presented in the Table 6. Note that all nine variables significantly predict the degree of adoption when they are included. The adjusted R squares value was 0.993. This indicates that 99.3% of the variance in degree of adoption was explained by all nine variables.
The regression equation for this model to predict the degree of leanness of the company is stated in Equation 1. The equation also can be used to estimate the degree of adoption for other sample size.
Degree of adoption = 0.014*(EW) + 0.020*(CI) + 0.015*(ZD) + 0.013*(JIT) + 0.017*(PULL) + 0.013*(MFT) + 0.013*(DEC) + 0.016*(IF) + 0.014*(VIF) + 0.062
Equation 1. “Degree of adoption”
Where,
EW = Elimination of waste mean value
CI = Continuous Improvement mean value
ZD = Zero Defects mean value
JIT = Just-in-Time mean value
PULL = Pull Instead of Push mean value
MFT = Multifunctional Teams mean value
DEC = Decentralized Responsibilities mean value
IF = Integrated Functions mean value
VIF = Vertical Information Functions mean value
doi:10.3926/jiem.2009.v2n1.p128-152 ©© JIEM, 2009 – 2(1): 128-152 - ISSN: 2013-0953
the dependent variables. The independent variables are the supporting manufacturing infrastructure. The results of stepwise regression are given in table 7. The only variable selected to enter the model is Quality Leadership, which accounts for 39.4% of the variance in the dependent variable, and is significant at
p is less than 0.01.
Variable B SEB β
EW 0.014 0.002 0.173**
CI 0.020 0.002 0.246**
ZD 0.015 0.001 0.180**
JIT 0.013 0.002 0.144**
PULL 0.017 0.002 0.195**
MFT 0.013 0.002 0.157**
DEC 0.013 0.002 0.127**
IF 0.016 0.001 0.222**
VIF 0.014 0.002 0.180**
Constant 0.062 0.006
Note. R2 = 0.993; p < .01, ** p < .001
Table 6. “Simultaneous Multiple Regression Analyses Summary for EW, CI, ZD, JIT, PULL, MFT, DEC, IF, and VIF (N=40)”.
The other variables are excluded from the model. These are true with the result of correlation analyses, where Quality Leadership is the only related variables and contribute to the 5’s and General Visual Management. The regression equation for this model to predict the managerial commitment of the company is stated in Equation 2. The equation also can be used to estimate managerial commitment for other sample size.
Managerial Commitment = 0.494* (QLEAD) + 1.642
Equation 2. “Managerial Commitment”.
Where,
doi:10.3926/jiem.2009.v2n1.p128-152 ©© JIEM, 2009 – 2(1): 128-152 - ISSN: 2013-0953
Independent variables B SEB R2 F
QLEAD 0.494 0.187 0.394 6.964*
Constant 1.642 0.660
* p < 0.05
Table 7. “Stepwise regression for Management commitment to 5’s and General Visual Management with SMI (N=40)”.
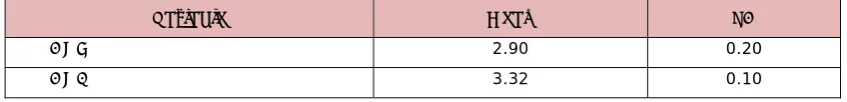
4.4 Degree of Leanness and Degree of Management Commitment
Degree of leanness (DOL) was measured as the average of the actual changes taking place as measured by the nine principles of lean manufacturing. Degree of managerial commitment (DOC) was measured by the level of investment in supporting manufacturing infrastructure, as measured by Worker Empowerment, Training, Group Problem Solving and Quality Leadership. Table 8 indicates the mean and standard derivation of degree of leanness and degree of commitment. The results indicate the degree of leanness of the company is moderate with mean value is 2.90±0.20. Meanwhile, the degree of commitment is moderate too, with mean value is 3.32±0.10.
Variable Mean SD
DOL 2.90 0.20
DOC 3.32 0.10
Table 8. “Mean and standard deviation of DOL and DOC (N=40)”.
4.5 Degree of the Roles Communication Process
doi:10.3926/jiem.2009.v2n1.p128-152 ©© JIEM, 2009 – 2(1): 128-152 - ISSN: 2013-0953
Variable Mean SD
CP 3.10 0.20
Table 9. “Mean and standard deviation of CP (N=40)”.
5 Discussion
Based on the results of correlation and regression in Table 3 and Table 5 Hypotheses 1 is acceptable. The results of this study show that the organization has adopted lean manufacturing principles and have been making actual changes in the direction of the lean manufacturing principles.
Continuous Improvement, Zero Defects and Multifunctional Teams were perceived highly by respondents, with mean value 3.125±0.939, 3.000±0.961 and 3.275±0.933 respectively (Table 2). The rest was less adopted in the organization. Thus the degree of adoption of the organization is low with mean value 2.897±0.569. Consequently, the degree of leanness is low as indicated in Table 7. This is because the organization is in the early stages of implementation of lean manufacturing practices and principles. The results are similar to the results of Soriano-Meier’s (2002) research, where degree of adoption of an organization is strongly related with the changes made in those nine variables.
Interestingly, all nine elements do contribute to degree of adoption (Table 5). The highest contribution is Continuous Improvement with B value equal to 0.020, significant with p is less than 0.01. Thus, the company can increase the degree of adoption by focusing in all variables especially in Continuous Improvement. Basically, there are two kinds of improvement, which are incremental and innovation.
doi:10.3926/jiem.2009.v2n1.p128-152 ©© JIEM, 2009 – 2(1): 128-152 - ISSN: 2013-0953
The significance level attained depends on several factors, but it cannot be assumed that high magnitude coefficients, of the order nearing unity, are statistically significant. One of the major influences is the number of pairs of readings or the sample size. A small sample size may produce a high coefficient, but it may not be significant. Conversely, with a large sample a significant correlation may be obtained even though no obvious relationship exists (Bower, 2000). Inappropriate, inadequate, or excessive sample sizes continue to influence the quality and accuracy of research (Bartlett et al., 2001).
Although there is only one manufacturing infrastructure, Quality Leadership, it significantly correlates with the management commitment, but the rest of the element has relationship with management commitment. This is because the correlation coefficient of all manufacturing infrastructure is in the range of -1 and +1. The zero correlation only occurs when the correlation coefficient is 0 (Bower, 2000). The result is similar with researches of Boyer (1996) and Soriano-Meier (2002), where both show that Quality Leadership having the largest correlation with managerial commitment.
There are several common errors that managers make when implementing lean manufacturing. Managers presume that lean manufacturing is not a comprehensive management system. For them, the application of lean manufacturing is limited to only a portion of company’s activities such as operation (Emiliani et al., 2005).
doi:10.3926/jiem.2009.v2n1.p128-152 ©© JIEM, 2009 – 2(1): 128-152 - ISSN: 2013-0953
6 Conclusion
The purpose of this paper is to evaluate the degree of leanness possessed by the company and the roles played by communication process in lean practice. The results show that the degree of leanness and degree of commitment in terms of communication is moderate for the company although the patterns of communication do exist. Primarily, the main findings show that the company is in their early stage to become lean, thus there is a need to keep their efforts for an effective communication process at all levels in order to be successful in lean manufacturing implementation. There is a need for everyone to be aware and understand the lean concept and the process of implementation. This is where the communication process plays a crucial role in ensuring the successful implementation of leanness. The company can increase their degree of adoption of lean manufacturing by putting efforts into the nine principles especially Continuous Improvement. The company should encourage the Quality Leadership in order to improve the managerial commitment.
This finding has implications for the company as it provides a mean to help them to measure its degree of commitment to lean manufacturing and its degree of adoption of lean manufacturing principles. The results of correlation and regression analyses have provided support to the first and second hypotheses. The finding signifies that there is a strong relationship between company’s adoption of lean manufacturing and actual changes made in nine variable of leanness. In addition, evidence proves that a good communication process supports the lean practices in manufacturing. The management should understand and emphasis the importance of the communication to successfully implement lean practice in their organization.
doi:10.3926/jiem.2009.v2n1.p128-152 ©© JIEM, 2009 – 2(1): 128-152 - ISSN: 2013-0953
Appendices: Questionnaire survey form (in English and Malay)
Please fill Top Level
the circle Middle Level
Bottom Level Category/
Kategori No
Rate the degree of adoption of the following lean production principles.
Nilaikan tahap pengamalan prinsip "Lean Production" berikut.
1 Elimination of waste
2 Continuous improvement
3 Zero defects
4 Just in time
5 Pull instead of push
6 Multifuctional teams
7 Decentralized responsibilities
8 Integrated functions
9 Vertical information systems
Rate the management commitment to the below lean practices.
Nilaikan penglibatan pengurusan dalam "Lean Practice" berikut.
10 Continuous Improvement/kaizen
11 5's and General Visual Management
12 Cellular Manufacturing
13 Value Stream Mapping
14 Total Productive Maintainance (TPM)
15 Pull Production/kanban Department : ……….
T o ta l Ad o p ti o n / Am at Diam a lkan Do A d op ti o n / Diam a lkan Le s s Ado p tion / Ku ra n g D iam alk a n No A d op ti o n / T id a k D iamal k a n M a na ge m e n t c o m m it m e nt/ Pe ng li b a ta n P e ng ur us an Parti a l A d opt ion/ Ser d ah an a Diam a lkan
f Le
doi:10.3926/jiem.2009.v2n1.p128-152 ©© JIEM, 2009 – 2(1): 128-152 - ISSN: 2013-0953
16 Giving workers a broader range of tasks.
Pekerja diberi lingkungan tugas yang luas .
17 Giving workers more planning resposibility.
Pekerja diberi lebih banyak tugasan dalam perancangan.
18 Giving workers more inspection/quality responsibility.
Pekerja diberi lebih banyak tugasan dalam pemeriksaan/qualiti.
19 Changing labor/management relationships.
Penambahbaikan hubungan pekerja/pengurusan.
20 Improving direct labor motivation.
Membaiki motivasi pekerja.
21 Improving supervisor training.
Membaiki latihan penyeliaan
22 Improving direct labor training.
Membaiki latihan pekerja.
23 Direct labor undergoes training to perform multiple tasks in the production process.
Pekerja melalui latihan untuk menjalankan pelbagai tugasan dalam proses pengeluaran.
24 Employees are rewarded for learning new skill.
Pekerja diberi peluang untuk mempelajar kemahiran baru.
25 Our plant has a high skill level, compared with our industry.
Kilang kami mempunyai tahap kemahiran tinggi berbanding dengan industri lain.
26 Direct labor technical competence is high in this plant.
Kecekapan teknikal buruh disini adalah tinggi.
27 Our palnt forms teams to solve problems.
Kilang kami mewujudkan pasukan untuk menyelesaikan masalah.
28 In the pass three years, many problems have been solve through team efforts.
Banyak masalah telah diatasi dalam tiga tahun sebelum secara berpasukan.
29 During problem solving sessions, all team members' opinions and ideas are considered before making a decision.
Dalam sesi penyelesaian masalah, semua pendapat dan idea ahli ditimbangkan sebelum keputusan dibuat.
30 All major department heads within our plant accept responsibility for quality.
Semua ketua jabatan dalam kilang kami bertanggungjawab terhadap qualiti.
31 Plant management provides personal leadership for quality improvement.
Pengurusan kilang memberi pimpinan khusus untuk kemajuan qualiti.
32 The top priority in evaluating plant management is quality performance.
Keutamaan dalam penilaian pengurusan dalam kilang kami ialah prestasi quality.
33 All major department heads within our plant work to encourage lean manufacturing.
Semua ketua jabatan utama dalam kilang kami menggalakan "Lean Manufacturing"
dipraktikan.
34 Our top management strongly encourages employees involvement in the production process.
Pengurusan atasan kami sangant menggalakan penglibatan pekerja dalam proses
doi:10.3926/jiem.2009.v2n1.p128-152 ©© JIEM, 2009 – 2(1): 128-152 - ISSN: 2013-0953
References
Bartlett, J. E., Kotrlik, J. W., & Higgins, C. C. (2001). Organizational Research: Determining Appropriate Sample Size in Survey Research. Information
Technology, Learning, and Performance Journal, 19(1): 43-50.
Bhasin, S. & Burcher, P. (2006). Lean Viewed as a Philosophy. International Journal
of Manufacturing Technology Management, 17(1):56 -72
Bower, J. A. (2000). Statistics for Food Science-VI: Correlation and Regression (Part A). Nutrition & Food Science, 30(6):295-299.
Boyer, K.K. (1996). An Assessment of Managerial Commitment to Lean Production.
International Journal of Operation & Production Management, 16(9):48 -59
Coakes, S. J. (2005). SPSS: Analysis without Anguish-version 12.0 for Windows, John Wiley & Sons Australia. Ltd, Queensland.
Emiliani, M.L. & Stec, D.J. (2005). Leaders Lost in Transformation. International
Leadership & Organization Development Journal, 26(5):370-387
Forrester, R. (1995). Implications of Lean Manufacturing for Human Resource Strategy. Work Study, 44(3): 20-24.
Gatchalian, M.M., (1997). People empowerment: the key to TQM success. The TQM
Magazine, 9: 429-433.
Grandzol, J.R., & M. Gershon, (1998). A survey instrument for standardizing TQM modeling research. Int. J. Quality Sci., 3: 80-105.
Karlsson, C., & Åhlström, P. (1996). Change processes towards lean production: The role of the management accounting system. Int. J. Operation and Production
Manage. 16: 42-56.
Le Vassan, M. (1994). Effectiveness of communication in business. Journal of
Educational Research, 4(1): 35-47.
Little, P. (1977). Communication in Business. 3rd Edition. London. Brown Company
doi:10.3926/jiem.2009.v2n1.p128-152 ©© JIEM, 2009 – 2(1): 128-152 - ISSN: 2013-0953
Morgan, G.A., Leech, N.L., Gloeckner, G.W., & Barret, K.C. (2004). SPSS for
introductory Statistics: Use and Interpretation Second Edition. Lawrence Erlbaum
Associates, Publishers:111-124.
Soriano-Meier, H., & Forrester, P.L. (2002). A Model for Evaluating the Degree of Leanness of Manufacturing Firms. Integrated Manufacturing System, 13(2):104-109.
Warten L.T. (1985). Technical Writing Purpose, Process and Form. California: Wadsworth Publishing Company USA.
Womack, J.P., Jones, D.T., & Roos, D. (1990). The Machine that Changed the
World. Emerald Group Publishing Limited.
Worley, J.M., & Doolen, T.L. (2006). The role of communication and management support in a lean manufacturing implementation. J. Management Decision, 44: 228-245.
©© Journal of Industrial Engineering and Management, 2009 (www.jiem.org)
Article's contents are provided on a Attribution-Non Commercial 3.0 Creative commons license. Readers are allowed to copy, distribute and communicate article's contents, provided the author's and Journal of Industrial Engineering and Management's names are included. It must not be used for commercial purposes. To see the complete