JIEM, 2017 – 10(4): 687-710 – Online ISSN: 2013-0953 – Print ISSN: 2013-8423 https://doi.org/10.3926/jiem.2147
Dynamic Impact of the Structure of the Supply Chain of Perishable
Foods on Logistics Performance and Food Security
Javier Arturo Orjuela Castro1 , Wilson Adarme Jaimes2
1Universidad Distrital Francisco José de Caldas, Bogotá (Colombia) 2Universidad Nacional de Colombia (Colombia)
[email protected], [email protected]
Received: October2016 Accepted: September 2017
Abstract:
Purpose: Understanding how the structure affects logistical performance and food security is critical in the supply chains of perishable foods (PFSC). This research proposes a system dynamics model to analyse the effects of structures: lean, agile, flexible and responsive, in the overall performance and of each agent of the PFSC.
Design/methodology/approach: Using a system dynamics model and design of experiments it is studied how the different structures and their combination, affect the behaviour of inventory, transportation, responsiveness, efficiency, availability and quality-safety of the fresh fruits supply chain and each echelon.
Findings: The studies of supply chains have been done for each structure in an independent way; investigations are scarce in supply chains of perishable foods. The structures modelled in this research do not show the better performance in all the metrics of the chain, neither in all agents for each structure. The above implies the presence of trade-offs.
Practical implications: Management by combining structures in the PFSC, improves logistics performance and contributes to food security.
Social implications: The agents of the FFSC can apply the structures found in this study, to improve their logistics performance and the food security.
Originality/value: The dynamics of individual and combined structures were identified, which constitutes a contribution to the discussion in the literature of such problems for FFSC. The model includes six echelons: farmers, wholesalers, agro-industry, third-party logistics operators and retailers. The dynamic contemplates deterioration rate to model perishability and others losses.
Keywords: perishable food supply chain structure, dynamic system, fruits
1. Introduction
A structure is an individual system of components that when relating to each other determinate the global behavior of the system (Giachetti, Martinez, Sáenz & Chin-Seng, 2003). The structure of the supply chain (SC) defines the function of each echelon and its processes. Structure and strategy influence each other (Aragón-Correa, Senise-Barrio & Matías-Reche, 1998). The proper selection of the supply chain structure (supply chain execution - SCE) allows an improvement in the performance of the SC.
Fisher (1997) established the strategy for the SC in light of the nature of demand. While for functional products (long life cycles and stable demand) the SC must be based on efficient processes, in innovative products (short life cycles and a highly unpredictable demand) the SC must be based on sensitive processes. Lee (2002) identified four structures for SCs: efficient, agile, responsive and risk-hiding. In turn, Gattorna (2015) indicates five generic SC types: lean, agile, fully flexible, collaborative Campaign. Perez, Caplice, Singh and Sheffi (2014) developed the Functional Strategy Map to describe a company's CS strategy, which is based on the company's core strategy and the strategic pillars that support it, from which it identifies the strategy and structure of the SC associated to the company.
Beulens (2001) focuses on identifying the appropriate design for the Poultry Supply Chain (SC); Cozzolino, Rossi and Conforti (2012) evaluated the agile and lean structure in the SC of food in a humanitarian logistics environment; Lyons and Ma’aram (2014) evaluates the classification proposed by Fisher in the food SCs in Greece, finding that lean or agile SC are applied depending on the type of food and the echelon of the chain.
A study of food SCs (SCF) should consider biophysical and organoleptic characteristics, shelf life, production time, transport conditions and storage (Aramyan, Ondersteijn, Van Kooten & Lansink, 2006). Orjuela-Castro, Calderón and Calderón (2007) evaluates value creation in the SC of physalis, Bourlakis, Maglaras and Fotopoulos (2012) evaluates value creation in Greek SCFs, later Bourlakis, Maglaras, Aktas, Gallear and Fotopoulos (2014), evaluates the sustainability of the sector through the performance measures of consumption, flexibility, responsiveness, product quality and total SC performance. A proposal on taxonomy for the evaluation of logistic performance in the SC is presented in Ruiz-Moreno, Caicedo-Otavo and Orjuela-Castro (2015), based on Orjuela-Castro and Adarme-Jaimes (2014), Aramyan et al. (2006) and Van der Vorst (2005), in which quality, logistical performance, responsiveness, efficiency and demand fulfilment stand out.
The perishability of food commodities generates losses; an estimated one-third of world food production is wasted or damaged (Gustavsson, Cederberg, Sonesson, Van Otterdijk & Meybeck, 2011). In food supply chains, there is a continuous change in the quality of the product from the moment the raw material leaves the grower, until the product reaches the consumer. The design of the supply chain (CS) of fresh food products, such as fruits, can not be achieved without taking into account the perishability and variability of the products in the chain, in order to deliver the product at the appropriate time, while ensuring the desired level of quality (Dabbene, Gay & Sacco, 2008a; Dabbene, Gay & Sacco, 2008b). Food supply chains are global networks, which encompass production, processing, distribution, and even elimination (Yu & Nagurney, 2013), they are different from other SC (Zanoni & Zavanella, 2012). The high perishability of food products causes loss of quality and profitability, food decrease and losses are unavoidable (Widodo, Nagasawa, Morizawa & Ota, 2006), therefore food products often need special, more advanced, transportation and storage solutions (Zhang, Habenicht & Spieß, 2003; Lowe & Preckel, 2004; Rong, Akkerman & Grunow, 2011). Globalization means greater distances between food production and places of consumption; it requires integration of food production and distribution along the chain (Cook, 2002).
90% of world fruit production (Manjavacas & FAO, 2012), developed countries absorb 80% of the world trade. Latin America and the Caribbean produce 32% (Miranda, 2011). In this context, a need arises to establish the appropriate structure for the fruit supply chains in countries like Colombia, logistics are considered a fundamental tool for increasing the competitiveness of fruit products, as it contributes to the management of trade from scattered places and to the conservation of products (Malorgio & Felice, 2014). In the literature review, no studies have been found that evaluate the effect of different structures on the logistic performance measures of SC of perishable fruit (SCPF). This article analyses the effect of the lean, agile, flexible and responsive structures in the logistical performance of the SCFP, applying system dynamics to the case study of the fruit supply chain in Cundinamarca-Bogotá, Colombia, specifically for the citrus fruits orange, tangerine and mango.
2. Type of Strategies for Supply Chains
Based on the review of the literature, the following are the characteristics and properties of the kind of structures.
2.1. SC Lean Structure
Achieves a low cost by ensuring that clients do not have more service than they require, that they are not over-served (Harrison & Van Hoek, 2008). These reduced costs are achieved by focusing on the basic processes, eliminating all that does not generate value and guarantee sequencing (Naylor et al., 1999; Gattorna, 2015).
2.2. SC Agile Structure
Focuses on rapid reconfiguration and responsiveness (Manson-Jones & Towill, 1999). Agility means using business and market knowledge to seize opportunities in a changing and unpredictable demand situation in volatile markets (Naylor et al., 1999). The agility requires of the company a way of acting, organizational structures, information systems and logistical processes (Christopher & Peck, 2004; Lee, 2002). The SC Agile handles innovative products, with volatile demand. What is essential for this structure is rapid reconfiguration and robustness, it must be able to respond quickly but in a controlled way (Manson-Jones & Towill, 1999). (Harrison & Van Hoek, 2008) argue that SC Agile is able to read and respond to an unpredictable demand and high variety, a chain that is in an oscillating flow. Companies with perishable products must manage fast and regular rates of supply, the agile chain has as a strategy to combine coverage and responsiveness (Gattorna, 2015; Lee, 2002).
2.3. SC Flexible Structure
Flexibility is defined by (Simchi-Levi, 2010) as the ability to respond to changes without increasing operations or the cost of the supply chain, with little or no delay in response time. The changes in production and logistics environments that require flexibility are: demand, prices, labour costs, exchange rates, technology, equipment availability, market conditions (Simchi-Levi, Schmidt & Wei, 2014). Flexible SCs require a robust network with the ability to adapt to changes and events, SC agents must be aligned and integrated (Stevenson & Spring, 2007), flexibility allows for increased security and stability without sacrificing efficiency (Qin, 2011). There are different attitudes toward flexibility in SCFs, (Van der Vorst et al., 2001) assures that food chains are inherently inflexible, because the quest for quality reduces flexibility. The perishability of fresh produce such as fruits and vegetables makes logistics and quality management difficult. On the other hand, consumers demand better sensory properties and a greater variety and food security (Aramyan et al., 2006), the seasonality of some fruits generates the need for flexibility in planting and in agro-industries.
2.4. SC Responsive Structure
while Lean means developing a value chain to eliminate all waste (including time) and ensure a level of sequencing. The operation of a responsive supply chain requires collaboration or integration of different agents (Gattorna, 2015), an evaluation of the effects of the integration of fruit supply chains can be observed in (Orjuela-Castro, Caicedo-Otavo, Ruiz-Moreno & Adarme-Jaimes, 2016).
3. Methodology
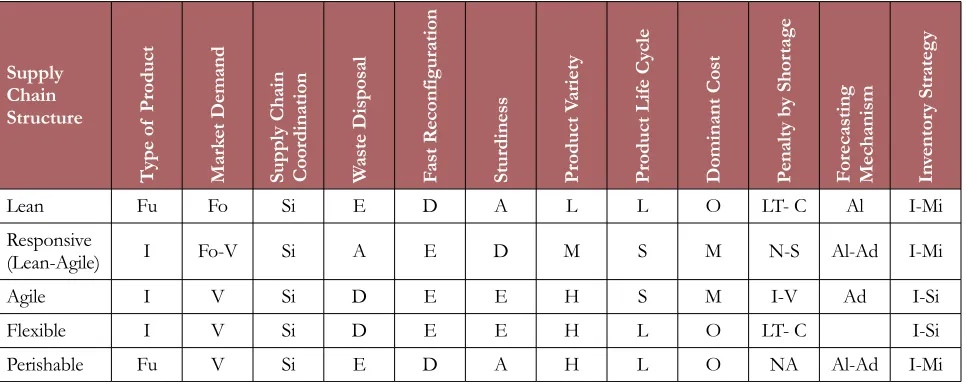
Through a systematic review of the literature, the variables and characteristics of the structures of the SCs were identified as shown in Table 1, from which a survey was developed for the agents of the three supply chains of fruits studied: orange, tangerine and mango. The survey included logistical variables associated with procurement, inventory, transportation and distribution, as well as variables of trade, forms and frequency of negotiation. By means of non-probabilistic snowball sampling, 24 producers, 42 retailers (marketplaces and shopkeepers), 12 agroindustry, 37 wholesalers, 7 supermarkets and 14 transporters were surveyed.
Supply Chain Structure T yp e of P ro du ct M ar ke t D em an d Su pp ly C ha in C oo rd in at io n W as te D is po sa l F as t R ec on fig ur at io n St ur di ne ss P ro du ct V ar ie ty P ro du ct L ife C yc le D om in an t C os t P en al ty b y Sh or ta ge F or ec as ti ng M ec ha ni sm In ve nt or y St ra te gy
Lean Fu Fo Si E D A L L O LT- C Al I-Mi
Responsive
(Lean-Agile) I Fo-V Si A E D M S M N-S Al-Ad I-Mi
Agile I V Si D E E H S M I-V Ad I-Si
Flexible I V Si D E E H L O LT- C I-Si
Perishable Fu V Si E D A H L O NA Al-Ad I-Mi
Fu: Functional; I: Innovative; Fo: foreseeable; V: Volatile; E: Essential; D: Desirable; Ar: Arbitrary; L: Low; H: High; L: Long; S: Short; M: Medium; O: Operational; M: Marketer; LT: Long-Term; C: Contract; RN: Right-Now, NS: not Shortage; Al: Algorithmic; AD: Advisor; I: inventory; Mi: Minimum; Ma: Maximum; S: Significant; NA: Not Allow.
Table 1. Characteristics of the SC structures
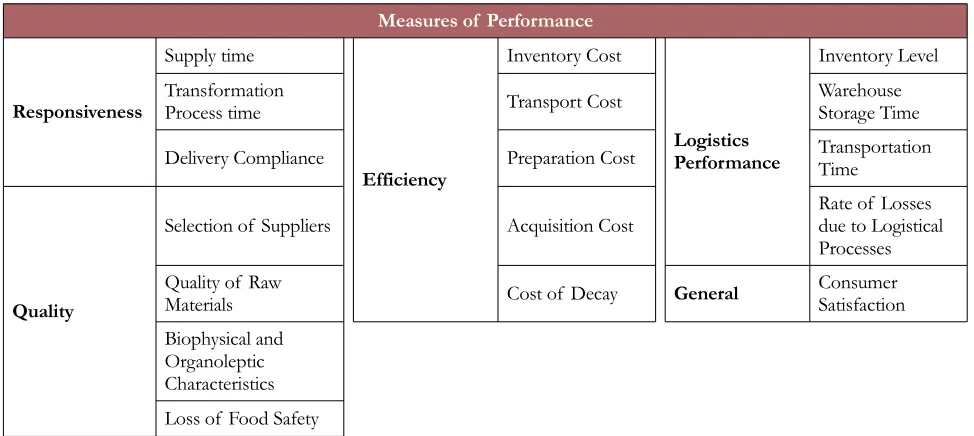
To measure the performance of the structures in SCs, they were defined as shown in Table 2.
Based on surveys and reports from Agronet, Faostat, Dane and Asohofrucol and Orjuela-Castro, Castañeda-Moreno, Canal-Roa and River-Velasco (2015), the SCs of the three fruits in
harvests (months), crop and postharvest losses (t), transport capacities, transit times between echelons (d), loading and unloading times, consumer population and consumption per capita for fresh fruit and pulp (g-inhabitant/d). Then a system dynamics model was developed using the iThink 9.1.3 software, from which the different scenarios of interest (structures) could be developed.
Measures of Performance
Responsiveness
Supply time
Efficiency
Inventory Cost
Logistics Performance
Inventory Level Transformation
Process time Transport Cost Warehouse Storage Time Delivery Compliance Preparation Cost Transportation Time
Quality
Selection of Suppliers Acquisition Cost Rate of Losses due to Logistical Processes Quality of Raw
Materials Cost of Decay General Consumer Satisfaction Biophysical and
Organoleptic Characteristics Loss of Food Safety
Table 2. Performance measures of the SCs studied
4. Description of the Model
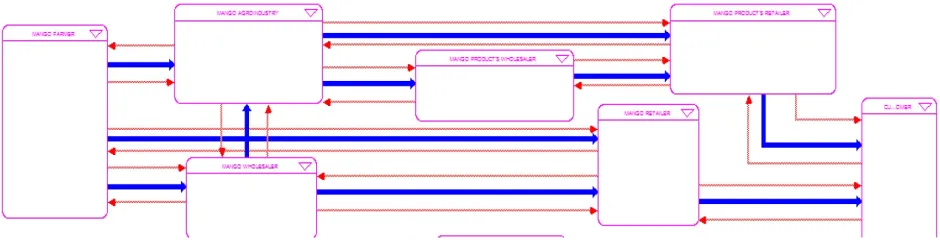
Figure 1. Supply Chain of pesishable Fruit, Colombia
4.1. Model Structure
The model for the supply chain of perishable fruits is formed by a set of echelons interconnected by flows and information (Figure 3). One echelon represents a set of agents of the same type, which are as a whole commercially related with other agents downstream and upstream in the chain (Figure 1). The relationships of interest are those associated with the logistics of the chain which is product by trade between agents. The information flows are present through the orders placed by the consumer (the demand) towards the other agents, upstream. The fresh fruit flows are generated from the producer (supply), downstream. The model balances supply-demand through the agents at the centre of the chain, agroindustry and traders, who practically fulfil a function of buffer or regulator. The logistic model of the PFSC, consists mainly of the following variables:
• Consumer demand: obtained from the per capita consumption of each fruit: orange, tangerine and mango, which varies according to the growth of the population of Bogota, demand behaves as a pull system.
• Producer supply: the fruit production depends on yield rates and the number of hectares sown by peasants, here the system behaves as a push system.
• Order generation: the agents at the centre of the SC review their downstream orders and compare them to their inventory, if they do not have enough inventory they place an order upstream.
life cycle of the fruit and is modelled with a delay. Each agent has a minimum level of inventory. The parameters were established by the surveys from each agent.
• Fruit sent: If the agent has enough inventories it will immediately send fruit downstream to fulfil the order. This is done with a delay, due to the processing time of the order. If the agent does not have enough inventories, the order may be breached.
• Fruit in transit: When the fruit leaves the inventory (warehouse) it is handed over for transport. It has been modelled for levels, which allows the determination of travel times and losses due to perishability during the transfer from one agent to another.
4.2. Dynamics Hyphotesis
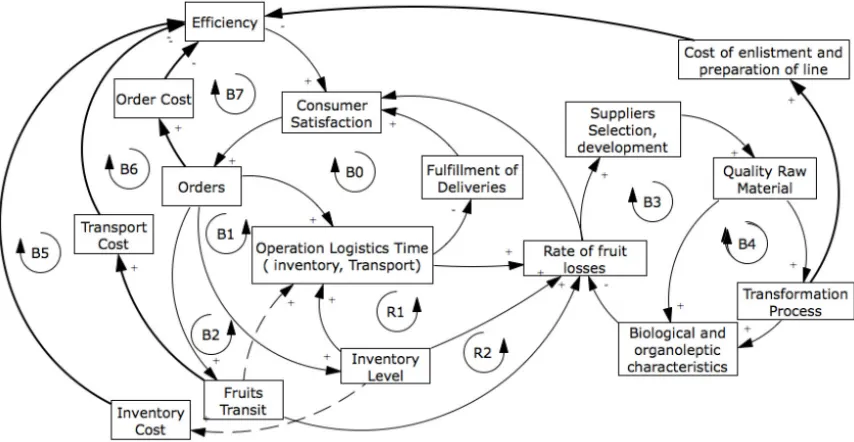
Having established the variables and measures of performance of interest, the causal diagram was constructed, in order to understand the relationships that govern the behaviour of the PFSCs. The causal diagram represented by loops (Figure 2), are shown and described below:
Figure 2. Causal diagram of the relationships between agents
improves for others it will deteriorate. The causal diagram (Figure 2), models the general behaviour of the performance measures variables (Figure 2) described below:
• Quality: Quality is mainly reflected in the losses, as it is important to measure food security. It is affected by several feedback loops: two cycles of positive feedback cycles or reinforcement (R1 and R2) and two negative feedback cycles, self-regulators or homeostatics (B3 and B4). R1: Consumer Satisfaction (CS) Orders (or) Inventory Level (IL) Rate of Fruit Losses (RFL) CS; R2: CSOR Fruits Transit (FT) RFTCS; Suppliers Selection and Development (SSD) -Quality Raw Material (QRM) - Transformation Process (TP) - Biological and Organoleptic Characteristics (BOC) - (SSD). Cycle B3 omits the agroindustry link (transformation process) but applies to the other actors.
• Response Capability: Conformed by selfregulating feedback loops B0, B1 and B2. B0: CS OR -Operation Logistic Time (OLT) – Fulfilment of Deliveries (FD) - CS; B1: CS-OR-IL-OLT-FD-CS. B2: CS-OR-FT-OLT-FD-CS-OR-IL-OLT-FD-CS.
• Efficiency of Logistics Operations: which affect the cycles B1, B2, R1, R2.
• Efficiency - Costs: which are derived from the cycles: Inventory Cost (B5), Transport Cost (B6) and Order Cost (B7). B5: CSORILInventory Cost (IC) ECS; B6: CS ORFT TCECS; B7: CS -O - -Order Cost (-OC) - E - CS.
Another measure of performance is the one related to customer satisfaction or consumer satisfaction in the case of the end customer. As can be seen in the cycles it is affected by all the factors.
The way in which one variable affects another is represented by arcs. A positive bow (+) when an increase in the preceding variable causes (cause) an increase in its successor variable (consequence) and a negative bow (-) when the decrease of the preceding variable causes a decrease of the successor variable.
4.3. Forrester’s Model
Figure 3. Model for 3 SCPF in iThink of the echelons, their material (blue) and information flows (red)
4.4. Model Equations
The system dynamics model includes flow equations, with level and auxiliary variables such as delays. Since it is a dynamic model the differential equations are used for flows and levels with respect to time. Logistics equations such as inventories, transportation, orders and losses as well as demand and supply are presented below. Examples are included for some echelons and for a fruit supply chain. The equations for inventory management are based on Sterman, 2000.
5. Discussion of Results
SCENARIO STRUCTURE
Variables Chains Current chain Agile Responsive Lean Flexible
Adjustment of production
Mango
1
1.25 0.75 0.75 1.25
Tangerine 1.44 0.56 0.56 1.44
Orange 1.24 0.76 0.76 1.24
Type of vehicles All chains 2 1 1 3 2
Use of the machines All chains 1 1.5 1.5 0.5 1
Order processing
adjustment All chains 1 0.5 0.5 2 0.5
Table 3. Changes of parameters for the scenarios
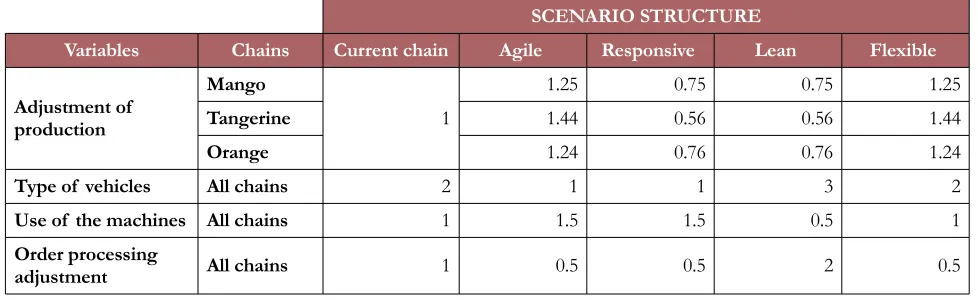
Performance measures for the three fruit chains, orange, mango and tangerine, are presented for the five structures: current, agile, responsive, lean and flexible. The tables are sorted by fruit and by the global measures of performance, in some cases they are shown for the chain and in others by agent. In addition, in order to evaluate the dynamics over time, the behaviour of the variables of the three chains are presented by performance measurement during a 10-year period. With the purpose of establishing the structure of the SCPFs in Cundinamarca-Bogota, scenarios were created. A first scenario models the current chain; the others simulate the other four structures. The Table 3 shows the variables used and the change in each scenario.
The assignment of values for the adjustment of the yield in the production assumed a normal distribution. The vehicle capacities for type 1,2, and 3 were 1, 5 and 10 tons, respectively. The machines work 2 shifts for the current one, and change as shown in Table 3. This was assigned to the process for the current chain, since it manages 100%, see graph for the other scenarios. These evaluations were performed based on the characteristics of each structure as shown in Table 1. Next the analysis by categories of the performance measurements is presented. The best performance measure has been highlighted.
5.1. Aggregated Results
Lead Time (day) Demand Fulfillment (%) Chanel 1 Chanel 2 Chanel 3 Mango Mango pulp
Current 0.79 0.52 1.12 94.17% 20.48%
Agile 0.55 0.29 0.68 95.61% 20.02%
Responsive 0.55 0.29 0.68 90.87% 19.77%
Lean 1.27 0.98 1.99 91.58% 20.43%
Flexible 0.58 0.31 0.7 95.94% 19.90%
Table 4a. Leadtime and Demand fulfilment for Mango
Lead Time (day) Demand Fulfilment (%) Chanel 1 Chanel 2 Chanel 3 Orange Orange pulp
Current 0.79 0.52 1.12 10.71% 18.16%
Agile 0.55 0.29 0.68 12.84% 20.92%
Responsive 0.55 0.29 0.68 8.02% 14.69%
Lean 1.27 0.98 1.99 8.03% 14.56%
Flexible 0.58 0.31 0.7 13.39% 21.63%
Table 4b. Leadtime and Demand fulfilment for Orange
Lead Time (day) Demand Fulfilment (%) Chanel 1 Chanel 2 Chanel 3 Tangerine Tangerine pulp
Current 0.79 0.52 1.12 95.35% 25.23%
Agile 0.55 0.29 0.68 95.26% 24.68%
Responsive 0.55 0.29 0.68 95.24% 24.54%
Lean 1.27 0.98 1.99 95.44% 25.52%
Flexible 0.58 0.31 0.7 95.25% 24.54%
Table 4c. Leadtime and Demand fulfilment for Tangerine
For the lead time, it is clear that the agile and responsive structures are the best, as was expected. As for meeting of demand, the best chain varies in the case of processed food. For mango, the current chain is the best one followed by lean, for orange the flexible is the best one, and for tangerine it is responsive. For fresh fruit, the flexible structure is the best one for mango and orange, while for tangerine it is lean.
Percentage Improvement Waste Inventory (Over Current) Mango
Farmer Agroindustry Wholesaler Retailer Chain
Agile 23.3% –2.3% 25.4% –0.2% 46.3%
Responsive –29.3% –3.1% –31.9% –0.3% –64.6%
Lean –30.9% 4.4% –34.2% 9.4% –51.4%
Flexible 29.7% –2.8% 32.3% –0.2% 59.0%
Table 5a. Waste Inventory for Mango
Percentage Improvement Waste Inventory (Over Current)
Orange
Farmer Agroindustry Wholesaler Retailer Chain
Agile 19.1% 15.2% 20.4% 19.9% 74.6%
Responsive –24.1% –19.1% –25.6% –25.0% –93.9%
Lean –23.6% –19.8% –25.1% –25.0% –93.5%
Flexible 24.0% 19.1% 25.6% 25.1% 93.8%
Table 5b. Waste Inventory for Orange
Percentage Improvement Waste Inventory (Over Current) Tangerine
Farmer Agroindustry Wholesaler Retailer Chain
Agile –2.2% 36.8% –0.3% 70.6% 104.9%
Responsive –2.7% –46.0% –0.1% –94.0% –142.8%
Lean 1.2% –46.1% 0.8% –89.4% –133.4%
Flexible –2.7% 46.0% –0.2% 88.3% 131.4%
Table 5c. Waste Inventory for Tangerine
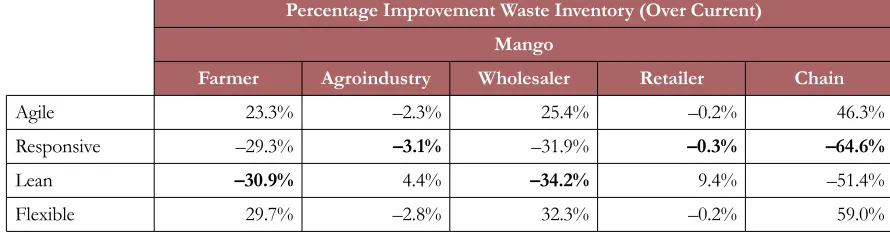
According to the total performance structures the best structure for losses caused in inventory is responsive. However, it differs between actors. For the farmer, responsive is better for orange and tangerine, while for mango it is lean. The differences can be seen in Table 5.
Percentage Improvement Waste Transport (Over Current) Mango
Farmer
-Wholesaler AgroindustryFarmer - Farmer -Retailer Wholesaler -Retailer Chain
Agile 23.34% –2.25% –0.25% –0.02% –18.30% Responsive –29.35% –3.07% –0.51% –0.03% 23.63%
Lean –30.94% 4.44% 10.67% 7.44% 23.06%
Flexible 29.74% –2.79% –0.30% –0.02% –23.60%
Table 6a. Waste Transport for Mango
Percentage Improvement Waste Transport (Over Current) Orange
Farmer
-Wholesaler AgroindustrFarmer -y
Farmer
-Retailer Wholesaler -Agroindustr y
Wholesaler
-Retailer Chain
Agile 19.16% 19.15% 19.15% –0.02% 20.36% –19.12% Responsive –24.08% –24.10% –24.10% –0.03% –25.59% 24.04% Lean –23.51% –25.65% –24.71% 2.55% –25.15% 23.87% Flexible 24.11% 24.09% 24.09% –0.03% 25.61% –24.05%
Table 6b. Waste Transport for Orange
Percentage Improvement Waste Transport (Over Current) Tangerine
Farmer
-Wholesaler AgroindustrFarmer -y
Farmer
-Retailer Wholesaler -Agroindustr y
Wholesaler
-Retailer Chain
Agile –2.61% –0.32% –0.03% –0.04% 33.26% –34.71% Responsive –3.26% –0.35% –0.03% 0.00% –48.90% 43.40% Lean 1.37% 1.34% 0.08% 0.06% –42.45% 43.39% Flexible –3.26% –0.37% –0.03% –0.02% 41.62% –43.41%
Table 6c. Waste Transport for Tangerine
Percentage Improvement Inventory (Over Current)
Orange Orange Pulp
Farmer Agroindustry Wholesaler Retailer Chain Agroindustry Wholesaler Retailer Chain
Agile 34.0% 11.5% 57.0% 1.6% 104.1% 20.7% 20.3% 18.8% 59.8%
Responsive –16.0% –31.8% –67.5% –20.2% –135.4% –23.2% –23.7% –25.5% –72.4%
Lean –29.9% –18.4% –70.3% –11.6% –130.2% –29.9% 2.4% –36.6% –64.1%
Flexible 50.8% 19.7% 82.6% 1.7% 154.8% 30.2% 29.6% 28.1% 87.8%
Table 7a. Percentage Change inventory for Mango
Percentage Improvement Inventory (Over Current)
Orange Orange Pulp
Farmer Agroindustry Wholesaler Retailer Chain Agroindustry Wholesaler Retailer Chain
Agile 44.40% 1.16% 15.14% 16.45% 77.15% 23.3% –2.3% 25.4% 46.3%
Responsive –3.34% –33.71% –27.20% –26.25% –90.50% –29.3% –3.1% –31.9% –64.6%
Lean –30.90% –19.52% –22.21% –19.37% –92.00% –30.9% 4.4% –34.2% –51.4%
Flexible 57.24% 2.30% 20.12% 21.73% 101.38% 29.7% –2.8% 32.3% 59.0%
Table 7b. Percentage Change inventory for Orange
Percentage Improvement Inventory (Over Current)
Tangerine Orange Tangerine
Farmer Agroindustry Wholesaler Retailer Chain Agroindustry Wholesaler Retailer Chain
Agile –36% 0% –48% 1% 70% –2% –2% –2% –6%
Responsive –48% 0% –44% 0% –92% –3% –2% –2% –7%
Lean –54% –2% –44% 1% –99% 2% –94% 41% –50%
Flexible 37% 0% 50% 0% 86% –3% –2% –2% –7%
Table 7c. Percentage Change inventory for tangerine
Percentage Improvement Transport (Over Current)
Mango Mango Pulp
Farmer Wholesaler Chain Agroindustry Wholesaler Chain
Agile 8.4% 0.8% 6.9% 20.8% 18.4% 20.0%
Responsive –31.4% –1.1% –25.2% –23.3% –25.7% –24.2%
Lean –13.9% –1.3% –11.3% –29.9% –84.9% –49.3%
Flexible 13.6% 1.0% 11.0% 30.4% 27.4% 29.3%
Table 8a. Percentage Change transport for mango
Percentage Improvement Transport (Over Current)
Orange Orange Pulp
Farmer Wholesaler Chain Agroindustry Wholesaler Chain
Agile 0.6% 29.0% 7.3% 22.3% 15.3% 19.9%
Responsive –37.5% –15.4% –32.3% –13.7% –18.8% –15.4%
Lean –20.8% –15.9% –19.6% –28.3% –88.0% –48.3%
Flexible 1.6% 37.7% 10.1% 28.8% 19.9% 25.8%
Table 8b. Percentage Change transport for Orange
Percentage Improvement Transport (Over Current)
Mango Mango Pulp
Farmer Wholesaler Chain Agroindustry Wholesaler Chain
Agile 30.6% 0.9% 30.2% –2.0% –21.0% –8.5%
Responsive –46.1% 0.0% –45.4% –2.4% –2.2% –2.3%
Lean –43.0% 0.1% –42.4% –1.2% 67.8% 22.6%
Flexible 38.7% –0.2% 38.2% –2.4% –2.2% –2.3%
Table 8c. Percentage Change transport for Tangerine
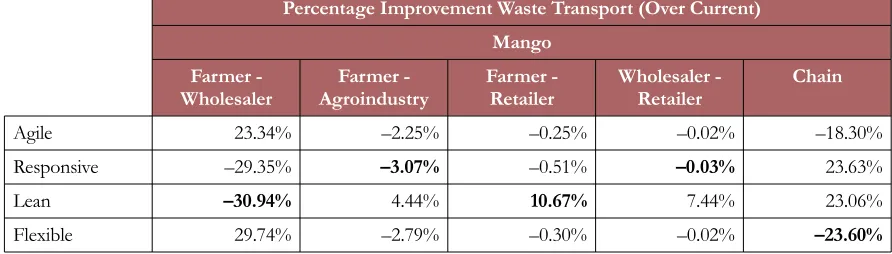
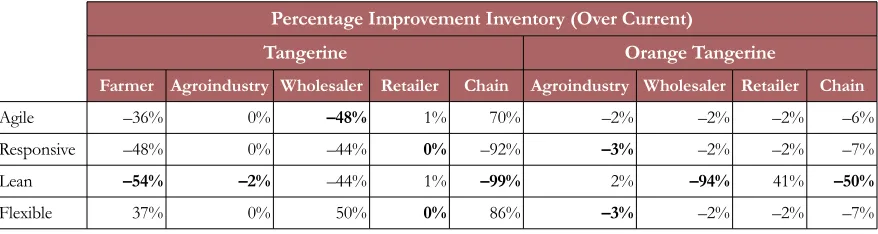
It is observed that the best structure for tangerine is the lean one, while for mango and orange the best one is the flexible.
Percentage improvement of cost over current, Mango
Purchase Inventory Waste Transportation Chain
Agile 16.8% 24.4% 24.3% 210.8% 24.3%
Responsive –22.0% –30.7% –30.5% 400.0% –30.5%
Lean –20.9% –32.7% –32.8% –50.0% –32.8%
Flexible 21.5% 31.0% 30.9% 0.0% 30.9%
Table 9a. Percentage Change cost for Mango
Percentage improvement of cost over current, Orange
Purchase Inventory Waste Transportation Chain
Agile 18.8% 19.0% 19.5% 210.8% 19.5%
Responsive –23.6% –23.9% –24.3% 400.0% –24.3%
Lean –23.6% –23.6% –24.1% –50.0% –24.1%
Flexible 23.6% 23.9% 24.3% 0.0% 24.3%
Table 9b. Pe.rcentage Change cost for Orange
Percentage improvement of cost over current, Tangerine
Purchase Inventory Waste Transportation Chain
Agile 34.5% 36.7% 36.7% 210.8% 36.7%
Responsive –43.1% –45.8% –45.8% 400.0% –45.8%
Lean –43.1% –45.9% –45.9% –50.0% –45.8%
Flexible 43.1% 45.7% 45.8% 0.0% 45.8%
Table 9c. Percentage Change cost for Tangerine.
The results are not conclusive, each agent has different interests depending on the chain and the performance measures, there is a trade-off.
5.2. Dynamic Analysis
6. Conclusions
Using a model under the system dynamics paradigm the impact of lean, agile, flexible and responsive structures on logistic performance in perishable food supply chains and food security was evaluated. The model was applied to the SC of mango, orange and tangerine and included characteristics of PFSC such as perishability.
The results show that the strategies improve the logistics behavior of the whole chain. However each strategy improves only some measures of logistic performance, not all. While some agents benefit others can be harmed which means that each agent of the chain would apply the best structure according to their own interests, to the detriment of the consumer. The lower levels of inventories and the greatest efficiency are achieved with the responsive and lean structures while the greater food in flow is achieved with the flexible structure. With regards to food security, the lean and responsive structure contributes with access as they are cost efficient, while the agile and flexible provide availability as they improve delivery speed and reduces losses. However, for the three SCs evaluated the responsive structure has the lowest losses in the whole SC and the flexible has the lowest transport losses.
The results derive from the need to carry out studies with mixtures of structures, complemented with trade-off analysis and with multiobjective models.
Acknowledgement
We thank Fredy, S., Morales, A., Laura, F. and Mejía, F. as well as all the students of the GICALyT group for their tenacity, integrity and dedication, the rigor with which they developed their work has become a great input to carry out this work.
Reference
Agarwal, A., Shankar, R., & Tiwari, M.K. (2006). Modeling the metrics of lean, agile and leagile supply chain: An ANP-based approach. European Journal of Operational Research, 211-225. https://doi.org/10.1016/j.ejor.2004.12.005
Agronet. http://www.agronet.gov.co/estadistica/Paginas/default.aspx
Aramyan, L., Ondersteijn, C., Van Kooten, O., & Lansink, A. (2006). Performance indicators in agri-food production chains. Quantifying the Agri-food Supply Chain, 47-64. https://doi.org/10.1007/1-4020-4693-6_5
Asohofrucol (2014). http://www.asohofrucol.com.co/fruta_detalle.php?id=64
Bourlakis, M., Maglaras, G., & Fotopoulos, C. (2012). Creating a “best value supply chain”? Empirical evidence from the Greek food chain. The International Journal of Logistics Management, 23(3), 360382. https://doi.org/10.1108/09574091211289228
Bourlakis, M., Maglaras, G., Aktas, E., Gallear, D., & Fotopoulos, C. (2014). Firm size and sustainable performance in food supply chains: Insights from Greek SMEs. International Journal of Production Economics, 152, 112-130. https://doi.org/10.1016/j.ijpe.2013.12.029
Christopher, M., & Peck, H. (2004). Building the resilient supply chain. International Journla of Logistics Management, 1-13.https://doi.org/10.1108/09574090410700275
Cozzolino, A., Rossi, S., & Conforti, A. (2012). Agile and lean principles in the humanitarian supply chain: The case of the United Nations World Food Programme. Journal of Humanitarian Logistics and Supply Chain Management, 2(1), 16-33. https://doi.org/10.1108/20426741211225984
Cook, R.L. (2002). The U.S. fresh produce industry: an industry in transition. Postharvest Technology of Horticultural Crops, (third ed.). Vol. 3311. Oakland, CA, USA: University of California Agriculture & Natural Resources,.
Dabbene, F., Gay, P., & Sacco, N. (2008a). Optimisation of fresh-food supply chains in uncertain environments. Part II: A case study. Biosystems Engineering, 99(3), 360-371. https://doi.org/10.1016/j.biosystemseng.2007.11.012
Dabbene, F., Gay, P., & Sacco, N. (2008b). Optimisation of fresh-food supply chains in uncertain environments. Part I: Background and methodology. Biosystems Engineering, 99(3), 348-350. https://doi.org/10.1016/j.biosystemseng.2007.11.012
DANE. (2014). Encuesta Nacional Agropecuaria.
www.dane.gov.co, https://www.dane.gov.co/index.php/agropecuario-alias/estadisticas-agricolas-y-pecuarias-ena
DANE. (s.f.). Estimación y proyección de población nacional, departamental y municipal total por área 1985-2020. http://www.dane.gov.co/files/investigaciones/poblacion/proyepobla06_20/Municipal_area_1985-2020.xls
Faostat. http://statistics.amis-outlook.org/data/index.html
Fisher, M. (1997). What is the Right Supply Chain for Your Product? Harvard Business Review, 105-116.
Gattorna, J. (2015). Dynamic Supply Chain (Vol. 3). Edingurgh, UK: Pearson Education Limited.
Giachetti, R., Martinez, L., Sáenz, O., & Chin-Seng, C. (2003). Analysis of the structural measures of flexibility and agility using a measurement theoretical framework. International Journal of Production Economics, 47-62. https://doi.org/10.1016/S0925-5273(03)00004-5
Gunasekaran, A., Lai, K.H., & Cheng, E. (2008). Responsive supply chain: A competitive strategy in a networked economy. Omega The International Journal of Management Science, 549-564. https://doi.org/10.1016/j.omega.2006.12.002
Gustavsson, J., Cederberg, C., Sonesson, U., Van Otterdijk, R., & Meybeck, A. (2011). Global food losses and food waste. Food and Agriculture Organization of the United Nations, Rome.
Harrison, A., & Van Hoek, R. (2008). Logistics Management and Strategy (3 ed.). Harlow: Pearson.
Lee, H. (2002). Aligning Supply Chain Strategies with Product Uncertainties. California Management Review Reprint Series. https://doi.org/10.2307/41166135
Lyons, A.C., & Ma’aram, A. (2014). An examination of multi-tier supply chain strategy alignment in the food industry. International Journal of Production Research, 527, 911-1925.
https://doi.org/10.1080/00207543.2013.787172
Lowe, T.J., & Preckel, P.V. (2004). Decision technologies for agribusiness problems: a brief review of selected literature and a call for research. Manufacturing & Service Operations Management, 6(3), 201-208. https://doi.org/10.1287/msom.1040.0051
Malorgio, G., & Felice, A. (2014). Trade and logistics: The fruit and vegetables industry. Mediterra 2014, 149-171.
Manjavacas, M. & FAO (2012). La producción mundial de fruta tropical.
http://www.fao.org/agronoticias/agro-noticias/detalle/es/c/159358/ (Accessed: February 2017).
Manson-Jones, R., & Towill, D.R. (1999). Total cycle time compression and the agile supply chain. International journal of production economics, 61-73. https://doi.org/10.1016/S0925-5273(98)00221-7
Miranda, D. (2011). Estado actual de fruticultura colombiana y perspectivas para su desarrollo. Revista Brasileira de Fruticultura, 199-205.
Myerson, P. (2012). Lean Supply Chain and Logistics Management. New York, EEUU: McGraw Hill.
Naylor, J.B., Naim, M.M., & Berry, D. (1999). Leagility: Integrating the lean and agile manufacturing paradigms in the total supply chain. International Journal of Production Economics, 107-118. https://doi.org/10.1016/S0925-5273(98)00223-0
Orjuela-Castro, J.A., Casilimas, W, & Herrera R.M. (2015). Impact analysis of transport capacity and food safety in Bogota. In Engineering Applications-International Congress on Engineering (WEA), 2015 Workshop on (1-7). Bogotá: IEEE-Xplore. https://doi.org/10.1109/WEA.2015.7370138
Orjuela-Castro, J.A., & Adarme-Jaimes, W. (2014). Identificación de asimetrías en los medios de almacenamiento and transporte en la cadena de frutas colombiana. Primer Congreso Internacional Industria y Organizaciones, Logística para la Competitividad (1-7). Bogotá: Universidad Nacional.
Orjuela-Castro, J.A., Castañeda-Moreno, I., Canal-Roa, J.L., & River-Velasco, J. (2015). La Logística en la Cadena de Frutas. Frutas y Hortalizas, 39, 10-15.
Orjuela-Castro, J.A., Caicedo-Otavo, A.L., Ruiz-Moreno, A.F., & Adarme-Jaimes, W. (2016). Efecto de los mecanismos de integración externa en el desempeño logístico de cadenas Frutícolas. Un enfoque bajo dinámica de sistemas. Revista Colombiana de Ciencias Hortículas, 10(2), 311-322.
Orjuela-Castro, J.A., Calderón, C., & Calderón, M.E. (2007). Análisis de la Cadena de Valor en las Estructuras Productivas de Uchuva y Tomate de Árbol en la Provincia de Sumapaz y el Distrito Capital. Ingeniería, 13(2), 4-12.
Orjuela-Castro, J.A., Herrera-Ramírez, M.M., & Adarme-Jaimes, W. (2017). Warehousing and transportation logistics of mango in Colombia: A system dynamics model. Revista Facultad de Ingeniería, 26(44), 71-84. https://doi.org/10.19053/01211129.v26.n44.2017.5773
Orjuela-Castro, J.A., Sepulveda-Garcia, D.A., & Ospina-Contreras, I.D. (2016). Effects of Using Multimodal Transport over the Logistics Performance of the Food Chain of Uchuva. Applied Computer Sciences in Engineering. Third Workshop on Engineering Applications, WEA. 165-177. https://doi.org/10.1007/978-3-319-50880-1_15
Palacio-Pelaéz, Á.E. (2014). Modelos productivos para la sostenibilidad y el desarrollo. Frutas & Hortalizas, Revista de La Asociación Hortifurticola de Colombia, 33, 5.
Perez, F., Caplice, C., Singh, M., & Sheffi, Y. (2014). Expresing a Supply Chain Strategy as a conceptual System. https://dspace.mit.edu/, http://hdl.handle.net/1721.1/103008 (Accessed: January 2017)
Qin, Y. (2011). On Flexible Strategy for Operation Risk in Supply Chain. Fourth International Joint
Rong, A., Akkerman, R., & Grunow, M. (2011). An optimization approach for managing fresh food quality throughout the supply chain. International Journal of Production Economics, 131(1), 421-429. https://doi.org/10.1016/j.ijpe.2009.11.026
Ruiz-Moreno, A.F., Caicedo-Otavo, A.L., & Orjuela-Castro, J.A. (2015). Integración Externa en las Cadenas de Suministro Agroindustriales: Una Revisión al Estado del Arte. Ingeniería, 20(2), 9-30.
Simchi-Levi, D. (2010). Operations Rules: delivering customer, value through, flexible operations. Cambridge: The Mit Press.
Simchi-Levi, D., Schmidt, W., & Wei, Y. (2014). From superstorms to factory fires: managing unpredictable supply-chain disruptions. Harvard Bursiness Review.
Srinivasan, M.M. (2012). Building Lean Supply Chain with the Theory of Constraints. New York, EEUU: McGraw Hill.
Sterman, J. (2000). Bussiness Dynamics: Systems Thinking. United States: McGraw Hill.
Stevenson, M., & Spring, M. (2007). Flexibility from a supply chain perspective: definition and review. International Journal of Operations & Production Management, 27(7), 685-713.
https://doi.org/10.1108/0144357071075+6956
Van der Vorst, J.G., Van Dijk, S.J., & Beulens, A.J. (2001). Supply chain design in the food industry. The International Journal of Logistics Management, 12(2), 73-85. https://doi.org/10.1108/09574090110806307
Van der Vorst, J. (2005). Performance measurement in agri-food supply chain networks. An overview. In Quantifying the Agri-food Supply Chain. Springer. 15-26.
Widodo, K.H., Nagasawa, H., Morizawa, K., & Ota, M. (2006). A periodical flowering– harvesting model for delivering agricultural fresh products. European Journal of Operational Research, 170(1), 24-43. https://doi.org/10.1016/j.ejor.2004.05.024
Yu, M., & Nagurney, A. (2013). Competitive food supply chain networks with application to fresh produce. European Journal of Operational Research, 224(2), 273-282. https://doi.org/10.1016/j.ejor.2012.07.033
Zanoni, S., & Zavanella, L. (2012). Chilled or frozen? Decision strategies for sustainable food supply chains. International Journal of Production Economics, 140(2), 731-736. https://doi.org/10.1016/j.ijpe.2011.04.028
Annex A
Dynamic Behaviour of the Performance Measures for the All Chains
Current Agile Responsive Lean Flexible
Demand Fulfilment Percentag e Fruit Fresh Demand Fulfilment Percentag eFruit Process
Cost order
Average Inventory
Transport
Wasted Inventory
Wasted Transport
Journal of Industrial Engineering and Management, 2017 (www.jiem.org)
Article’s contents are provided on an Attribution-Non Commercial 3.0 Creative commons license. Readers are allowed to copy, distribute and communicate article’s contents, provided the author’s and Journal of Industrial Engineering and Management’s