EFFECT OF BORON NUTRITION ON PADDY YIELD UNDER SALINE-SODIC SOILS
Syed Ishtiaq Hyder, Muhammad Arshadullah, Arshad Ali and Imdad Ali Mahmood*
ABSTRACT:- A field experiment was carried out to investigate the
-1
effect of different levels of boron (0.5, 1.0, 1.5 and 2.0 kg ha ) on growth, yield and ionic concentration of rice directly sown on raised beds under
-1
saline sodic soils (ECe=5.32 dS m , pH=8.52 and SAR=18.87) at Soil Salinity Research Institute, Pindi Bhattian, district Hafizabad, Punjab Pakistan during 2009 and 2010. Treatments were arranged in RCBD with three replications. The crop was harvested at maturity. Data on tillering,
-1
plant height, spike length, number of grains spike , 1000-grain weight, straw and paddy yields were recorded. Na, K, Ca and B concentration in grain and straw were estimated using atomic absorption spectroscopy.
-1
Tillering, number of grains spike , 1000- grain weight and paddy yield significantly (P
≤
0.05) increased at different levels of B. 1000-grain weight-1 -1
(31.7 g) and grain yield was the maximum (5.0 t ha ) at 2 kg B ha and 22% more than control treatment. Maximum plant height (155.7 cm) and
-1 -1
number of grains spike (125) were recorded with B application @ 1 kg ha . B concentration in grain increased with boron application. Positive correlation (r= 0.94) was found between B contents in grain and paddy grain yield. Economical analysis showed that maximum value cost ratio was
-1
(12.5:1) with the application of 1.5 kg B ha .
Key Words: Rice; Boron Application; Salt Affected Soil; Yield; Yield Components; Pakistan.
INTRODUCTION
Rice is highly valued cash crop that earns substantial foreign exchange. Rice is grown on 2.96 mha with production of 6.952 mt (GoP, 2009). Salinity poses threat to crop production in many areas of the world, including Pakistan (Greenway and Munns, 1980; Hasegawa et al., 2000; Ashraf and Foolad, 2007). It has been estimated that almost 40,000 ha of arable land in Pakistan is being lost due to salinity and the area is rapidly increasing each year
(Ahmad et al., 2006; Ashraf et al., 2008). A crop response to Boron (B) application under alkaline calca-reous soil is just expected as its availability in soil decreases with increasing pH above 7 (Wang et al., 2001). Besides, Ca in calcareous soil antagonizes B availability to crops and promotes B deficiency in plant. Soil texture pH, CaCO and organic 3 matter affect availability of B in soil and boron was suspected to be deficient in a number of Pakistani soils especially in rainfed areas (Sillanpaa, 1982). Dunn et al. (2005)
reported rice yield increases with B use in Missouri, USA. Experiments in China have demonstrated the value of applying urea plus boron rather than urea alone. The average yield increases due to urea and B over those achieved by urea alone was 10% for rice (Shorrocks, 1997). In Pakistan, Chaudhary et al. (1976) reported marked increases in rice yield with the application of boron. The objectives of this study was to investigate the effect of B application and its optimum economical dose on paddy yield under saline-sodic soils.
MATERIALS AND METHOD
Effect of different B levels (0.5, -1
1.0, 1.5 and 2.0 kg ha ) on growth, yield and ionic concentration of fine rice (Supper Basmati) under saline sodic soil at SSRI, Pindi Bhattian was studied during 2009 and 2010. The treatments were arranged in rando-mized complete block design (RCBD) with three replications. The treat-ments under investigation were: con--1 trol, 0.5, 1.0, 1.5 and 2.0 kg B ha . Basal dose of N, P O and K O @ 100, 2 5 2
-1
80 and 50 kg ha , respectively were applied to all treatments. Half of N and full dose of P and K were applied at the time of plantation. The remaining half N was applied at tillering stage. The crop was irrigated with tube well water throughout the growth period. Necessary plant protection measures were done whenever required. The crop was allowed to stand till maturity and data on tillering, plant height, spike -1 length, number of grains spike , 1000-grain weight, straw and paddy yields were recorded at the time of plant harvest. Plant samples were dried in oven at 60 ºC to a constant
weight and the dry matter yield was recorded. Ground plant samples were digested in perchloric-nitric acid (2:1 1N) mixture (Rhoades, 1982) to estimate Na, K, and Ca by atomic absorption spectroscopy. Boron was also measured both in plant tissues and grains. The data thus obtained were subjected for statistical analysis using MSTATC package.
RESULTS AND DISCUSSION
Growth and Yield
Data indicated that different levels of boron application to rice showed statistically significant effect on plant height, number of tillers, number of grains /spike, spike length and 1000-grain weight (Table 3). The maximum plant height (155.7 cm) was recorded in treatment
-1
receiving 1 kg B ha . The lowest height (147 cm) was recorded in control treatment. The maximum
Parameter Value
pH (1:1) 8.52
ECe (1:1) (dS m-1) 5.32
SAR(m.mole l-1)1/2 18.87
CaCO (%)3 23.01
Organic matter (%) 1.02
Sand (%) 63.00
Silt(%) 17.00
Clay(%) 20.00
Texture Class Sandy Loam
Table 1. Physico-chemical analysis
of the soil at SSRI Farm, Pindi Bhattian
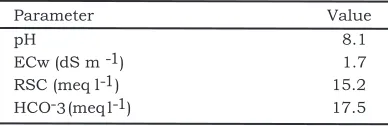
Parameter Value
pH 8.1
ECw (dS m -1) 1.7
RSC (meq l-1 ) 15.2
HCO-3(meq l-1) 17.5
number of tillers (28) was produced -1 in treatment receiving 1.5 kg B ha followed by treatment receiving 1 kg
-1
B ha . The maximum number of grain per spike (125) was recorded in -1 treatment receiving 1.0 kg B ha , followed by treatment receiving 0.5
-1
kg B ha (107). The positive effect of B on the number of grains per spike has also been observed by many workers (Jahiruddin et al., 1995; Mandal and Das, 1988; Abedin et al., 1994 and Rashid et al., 2002). The maximum 1000-grain weight (31.7g) was noticed in treatment receiving 2
-1
kg B ha . However 1000-grain weight achieved in treatment receiving 1 kg
-1
B ha were statistically at par (31 g). The straw and paddy yields increa-sed with increasing rate of boron and paddy yield was maximum with 2 kg
-1
B ha registering 22% more than that of control treatments. Paddy yield was also significantly affected by boron application, which ranged
-1
from 3.51 to 6.11 t ha . The highest -1 yield was obtained from 2 kg B ha (Khan et al., 2006). Ehsan-ul-Haq et al. (2009) reported that application of B improved all growth parameters i.e., tillering capacity, shoot and root length and shoot and root weight because of external B application @
-1
200-400ng ml in solution culture in the presence and absence of NaCl
-l
salinity. In shoot Na+ and Cl
decrea-sed; whereas K+: Na+ ratio improved because of B supplied to saline medium. Maximum straw yield (17.9
-1
t ha ) was recorded with the applica--1
tion of 1.5 kg B ha . The paddy yield significantly increased with the increase in B application. These results are in consonance to Jahirudddin et al. (1992), Abedin et al. (1994), Rekrasm et al. (1989) and Shah et al. (2011).
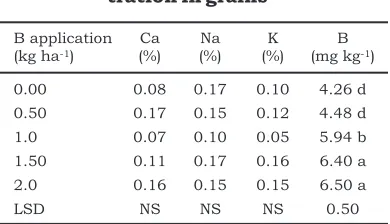
Ionic Concentrations
In straw, ionic concentration and grain were non significant except B concentration in straw and grain (Table 4). Maximum B -1 concentration in grain (6.5 mg kg ) was found with the application of 2
-1 -1
kg B ha followed by (6.4 mg kg ) in -1
1.5 kg B ha ; they are also statistically at par.
Data indicated significant
B application (kg ha-1)
Plant height (cm)
Tillers Panicle length (cm)
Grain
-1
panicle
1000-grain weight (g)
Straw yield (t ha-1)
Grain yield (t ha-1)
0.00 147.0 c 19.0 d 27.7 c 89.0 e 29.3 bc 12.2 e 4.1 e 0.50 150.3 b 22.7 c 30.3 ab 107.3 b 30.7 ab 14.1 c 4.3 d 1.0 155.7 a 25.3 b 29.3 b 93.0 d 31.0 a 16.3 b 4.5 c 1.50 151.7 b 28.3 a 30.7 ab 125.3 a 31.3 a 17.9 a 4.8 b 2.0 155.0 a 19.9 d 31.0 a 96.3 c 31.7 a 17.1 b 5.0 a
LSD 2.30 1.10 1.37 1.93 1.42 0.21 0.15
Table 3. Effect of B application on rice growth and yield (average of 2009 and
2010)
B application (kg ha-1)
Ca (%)
Na (%)
K (%)
B (mg kg-1)
0.00 0.08 0.17 0.10 4.26 d
0.50 0.17 0.15 0.12 4.48 d
1.0 0.07 0.10 0.05 5.94 b
1.50 0.11 0.17 0.16 6.40 a
2.0 0.16 0.15 0.15 6.50 a
LSD NS NS NS 0.50
Table 4. Effect of B on ionic
concen-tration in grains
Means followed by same letter do not differ significantly at P = 0.05
positive correlation (r= 0.94) between B contents in grain. The presence of significantly higher B contents in grain enhances paddy yield under saline sodic soil (Figure 1).
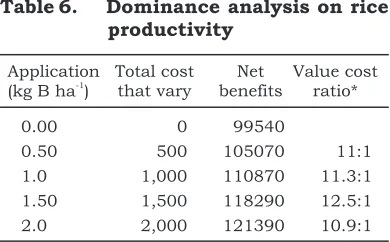
Economic Analysis
Economic viability of any intervention is must for adoption in field and is the basic theme of the research. All the agronomic practices and plant protection measures were
same. The input costs of treatments
-1 -1
receiving 0.5 kg B ha , 1 kg B ha ,
-1 -1
1.5 kg B ha and 2 kg B ha were Rs. 500, Rs.1000, Rs 1500 and Rs.2000, respectively. Net benefits attained by
-1 treatments receiving 0.5 kg B ha , 1
-1 -1 -1
kg B ha , 1.5 kg B ha and 2 kg B ha were Rs. 105070, 110870, 118290 and 121390, respectively which were 5, 11, 18 and 22 percent higher than control (Table 5). The contribution of B towards rice grain yield was investigated. Data (Table 6) indicated -1 treatments receiving 1.5 kg B ha attained the highest value cost ratio (12.5:1) followed by application of 1
-1
kg B ha (11.3:1).
The present study concludes that grain yield was maximum (5 t
-1 -1
ha ) with the application of 2kg B ha and 22% more than control treatment. Presence of significantly higher B contents in grain enhances grain yield under saline sodic soils. Economic analysis showed that it is highly attractive with value cost ratio 12.5:1.
6 6.5 7
5.5
5.5 y = 2.77 + 0.32 r = 0.94
5
5 4.5
4
4 4.5
-1
B contents in grain (mg kg )
-1
P
a
d
d
y
y
ie
ld
(
th
a
)
Figure 1. Correlation between B contents in grain and paddy yield
Parameter Control 0.50 kg 1.0 kg 1.50 kg 2.0 kg
-1 (kg ha )
Input cost 0 500 1000 1500 2000
Total cost that vary 0 500 1000 1500 2000
Yield grain -1
(kg ha )
-1 (kg ha )
4100 4300 4500 4800 5000
Yield adjusted 3690 3870 4050 4320 4500
Output Price -1
(Rs. kg ) 24 24 24 24 24
Yield straw 12200 14100 16300 17900 17100
Yield adjusted (10% low)
(10% low)
10980 12690 14670 16110 15390
Output price -1
(Rs. kg ) (Rs.)
(Rs.)
(Rs.) (Rs.)
1 1 1 1 1
Gross field benefits 99540 105570 111870 119790 123390
Net benefits 99540 105070 110870 118290 121390
Table 5. Economic analysis, partial budget analysis and dominance analysis of
LITERATURE CITED
Abedin, M.J. Jahiruddin, M. Hoque, M.S. Islam, M.R. and Ahmed, M.U. 1994. Application of boron for improving grain yield of paddy. Progress. Agric. 5: 75-79. Ahmad, M.S.A. Ali, Q. Bashir, R.
Javed, F. and Alvi, A. K. 2006. Time course changes in ionic composition and total soluble carbohydrates in two barley cultivars at seedling stage under salt stress. Pakistan. J. Bot. 38: 1457-1466.
Ashraf, M. and Foolad, M.R. 2007. Role of glycine betaine and praline in improving plant a b i o t i c s t r e s s r e s i s t a n c e . Environ. Exp. Bot. 59: 206-216. Ashraf, M. Athar, H.R. Harris, P.J.C.
and Kwon, T.R. 2008. Some p r o s p e c t i v e s t r a t e g i e s f o r improving crop salt tolerance. Adv. Agron. 97: 45-110.
Chaudhary, F.M. Latif, A. Rasheed, A. and Alam, S.M. 1976. Response of rice varieties to file application of micronutrients. Pakistan. J. Sci. 19: 134-139. Dunn, D. Stevens , G. and Kending,
A. 2005. Boron fertilization of rice with soil and foliar appli-cation. Online Crop Manag-ement. Doi:
10.1094/CM-2005-0210-01-RS.
Ehsan-ul-Haq, M. Kasuar, R. Akram, M. and Shahzad,S. M. 2009. Is boron required to improve rice growth and yield in saline environment. Pakistan J. Bot.13 (4): 1339-1350.
GoP, 2009. Agricultural Statistics of Pakistan. Ministry of Food, Agriculture and Livestock. Economic Wing. Government of Pakistan, Islamabad.
Greenway, J. and Munns, R. 1980. Mechanisms of salt tolerance in non- halophytes. Ann. Rev. Plant Physiol. 31: 149-190.
Hasegawa, P.M. Bressan, R.A. Zhu, J.K. and Bohnert, H.J. 2000. Plant cellular and molecular responses to high salinity. Ann. Rev. Plant Physiol. Plant Mol. Biol. 51: 463-499.
Jahiruddin, M. Ali, M.S. Hossain, M.A. Ahmed, M.U. and Hoque, M.M. 1995. Effect of boron on grain set, yield and some others of paddy cultivars. Bangladesh J. Agric. Sci. 22: 179-184.
Jahiruddin, M. Hoque, M.S. Hoque, A.K.M. and Roy, P.K. 1992. Influence of boron, copper and molybdenum on grain formation in paddy. Crop Res. 5: 35-42. Khan R. Gurmani, A. H. Gurmani, A.
R. and Zia, M. S. 2006. Effect of boron application on rice yield under wheat rice system. Intern. J. Agric. Biol. 8(6): 805-808. Mandal, A.B. and Das, A.D. 1988.
Response of paddy to boron application. Indian J. Agric. Sci. 58: 681-683.
Rashid, A. Rafique, E. Muhammad. S, Bughio, N. 2002. Boron deficiency in rainfed alkaline soils of Pakistan: incidence and genotypic variation in rapeseed-
Table 6. Dominance analysis on rice
productivity
* Value Cost Ratio between values of additional crop produce to the additional money spent on B fertilizer
Total cost that vary
Net benefits
Value cost ratio*
0 99540
500 105070 11:1
1,000 110870 11.3:1
1,500 118290 12.5:1
2,000 121390 10.9:1
Application -1 (kg B ha )
mustard. In: Goldbach, H.E. Hont, C.D. Nielsen, F.H. and Mecham, S.L. (eds.) Boron in plant and animal nutrition. Kluwer/ Plenum,New York, p.363-370.
Rerkasem, B. Saunders, D.A. and Dell, B. 1989. Grain set failure and boron deficiency in paddy. Thailand J. Agric. 5: 1-10.
R h o a d e s , J . D . 1 9 8 2 . C a t i o n Exchange Capacity: In Methods of Soil Analysis. Part 2. Chemical and microbiological properties. Page, A.L. (ed.). Amer. Soc. Agron., Madison, Wisconsin, USA. p. 149-158
Shah J. A. Memon, M. Y. Aslam, M. Depar, N. Sial, N.A. and Khan, P.
2011. Response of two rice varieties viz., Khushboo-95 and Mehak to different levels of boron. Pakistan J. Bot. 43(2): 1021 -1031.
S h o r r o c k s , V . M . 1 9 9 7 . T h e occurrence and correction of boron efficiency. Plant Soil, 193: 121-148.
Sillanpaa, M. 1982. Micronutrients and nutrient status of soils: A global study. FAO Soils Bull. No: 48. Rome.