Feasibility Study of Reducing the Total Dissolved Solids (TDS)
from Contaminated Water in Radish Plant (Raphanus Sativus)
Using Nano Activated Carbon and Zeolite
S. Hassanpour Aslania*, H. Ghafourianb, M. R. Ardakanic, S. Torabid
aDepartment of Agronomy, Karaj branch, Islamic Azad University, Karaj, Iran.
b Faculty of Science and Marine Technology, Tehran North Branch, Islamic Azad University, Tehran, Iran. cDepartment of Agronomy, Karaj branch, Islamic Azad University, Karaj, Iran.
dDepartment of Agronomy, Science and Research branch, Islamic Azad University, Tehran, Iran.
Abstract
Applying Nanoporous Materials is an appropriate method for improving chemical quality of the water due to high surface area, internal porous structure (porosity), high absorption capability of harmful gases and liquids, and capability of reactivating the surface. Therefore, actions were carried out in order to investigate the effect of Activated carbon and Zeolite on reducing the total dissolved solids in water to perform experiment in a randomized complete block design with four treatments and three replications in greenhouse. Results indicated that there are significant differences among various treatments of water in terms of change in the concentrations of chemical elements in water. Subsequently, we measured some traits in plant samples in order to evaluate the reaction of the radish plant related to changes in water quality resulting from use of these absorbers. Other characteristics did not show remarkable differences with the control sample based on the results of variance analysis related to plant samples with the exception of shoot’s chloride.
2013 JNS All rights reserved
Article history: Received 2/5/2013 Accepted 23/8/2013 Published online 1/9/2013
Keywords:
Activated carbon Zeolite
TDS Radish
*Corresponding author:
E-mail:
[email protected] Phone: 98 939 6178362
1. Introduction
In case of occurrence any phenomena in water such as creation of contaminant, TDS and PH levels of the water will be changed. Following up these changes will act as early warning signals in order to identify the problem. The most commonly used parameter to differentiate between saline water qualities is total dissolved
of new technologies for filtration, removing and recycling chemical substances from water as well. The purpose of the Nano activated carbon in title is Activated carboncontaining Nano-cavities; the most important of the bunch is Micro-porous carbon material. Hence, in this project activated carbon (Micro-porous organic) and zeolite (Micro-porous inorganic) were applied to investigate the feasibility of reducing the Total Dissolved Solids in water andalso evaluation of plant response to changes in water quality resulting from use of these adsorbent.
2. Materials and Methods
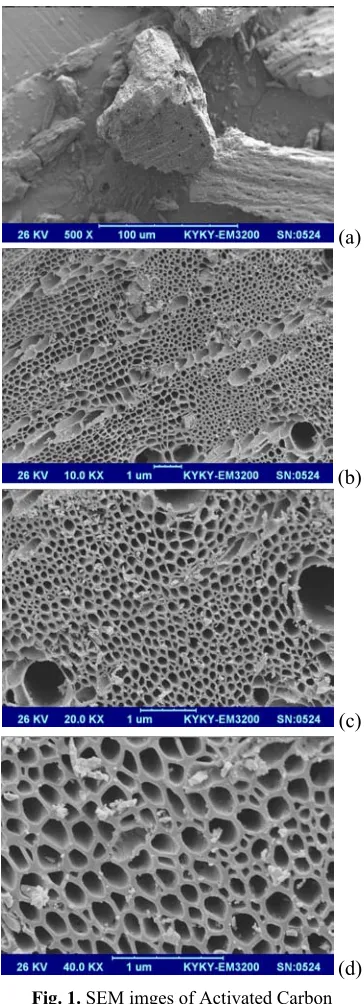
2.1. Preparation of Materials and Equipment Four plastic container of water with 60 liters volume, 65 cm height, with circular base with a 20 cm radius were prepared. We used cylindrical container to increase contact surface of zealots with water. By considering height and basal area of water tank, two cylindrical material containers with 52 cm height and a circular cross section with a 6 cm diameter were purchased. Quantity of the adsorbent was calculated in each cylinder by means (cylinder weight+ absorber weight), so weight of the empty cylinder, Cylinders filled with zeolite, Cylinders filled with zeolite and activated carbon were measured as 350,1000 and 880 g respectively. Hence 100 g of activated carbon for second tank, 650 g of zeolite and 530 g mixture of activated carbon and zeolite were used. For this Experiment, activated carbon was used with a pore sizes range between micro and meso (Fig. 1) and natural zeolite- clinoptilolite type- with grain size 0 to 3 mm (Fig. 2). Iodine Number has been measured According to ASTM D4607 standard method .The amount of adsorbed of Iodine Number was about 780 mg/g.
(a)
(b)
(c)
(d)
Fig. 1. SEM imges of Activated Carbon
Table 1. Comparison of Nanoporous materials
Carbon Zeolite
Micro - Meso Micro - Meso
Pore size
0.3 - 0.6 0.3 - 0.7
Porosity
Low – Average Low
Permeability
Low Weak
Strength
High Average – High
Thermal stability
High High
Chemical stability
High Low - Average
Cost
Long Long - Average
(a)
(b)
(c)
Fig. 2. SEM images of Zeolite
2.2. Run the Experiment in the Greenhouse This experiment was carried out in a randomized complete block design with four treatments and three replications. Four experimental treatments include the treatment control sample water, treatment control sample water plus activated carbon, treatment control sample water plus Zeolite, and treatment control sample water plus activated carbon and Zeolite. Cylinders containing activated carbon and zeolite were submerged inside water tanks one day before planting and were irrigated based on considered pattern. The next day, after planting
seeds and before irrigating vases, 1 liter water of each tank was sent to the laboratory for water analysis tests and subsequently samples were irrigated based on crop capacity of soil of vases. Water sampling and analysis for each water container were performed during first three days in succession; afterwards, only at the end of each week water analysis for each container were preceded. In this experiment, seeds were planted directly into the vases. The number of seeds in each vase after thinning (2 to 3 leaf stage) in all vases was similar to plantlets number. Necessary care considered until the end of plant growth period. During laboratory stages and after completion of growth period, plant samples were harvested and morphological measurements and plant decomposition experiments were implemented.
2.3. Measurements Related to Water Analysis In order to measure Electrical Conductivity (EC) of water, 20 ml of sample transferred to a glass tube and then electrical conductivity of the water samples was measured by conductivity meter. Since it is impossible to measure the concentration of total dissolved solids (TDS); electrical conductivity (EC) of water samples were measured through using a conductivity meter, and then, TDS were determined from the following empirical relationships. TDS (mg/lit) = 640 × EC (ds/m). In order to measure the PH of water, 20 ml samples were transferred to a glass tube and then the PH of the water samples was measured by PH Meter.
2.4. Measurements Related to Plant
,the roots and shoots (stems and leaves) each plant sample were transferred into the oven for 48 hours at 70 ° C. Afterwards, samples were taken out from the oven and their dry weight were determined by a digital scale. To determine the chloride in plant, 0.5 gr of plant sample and 50 ml distilled water were transferred into a glass tube and the sample was stirred for half an hour. Then, extracted substances were purified by filter paper and chloride of the plant samples was measured by chloride-meter apparatus. In order to measure the sodium in plant, 2 0.001 g dried plant sample were placed into a silica or porcelain cruise and transferred into an oven with ordinary temperature. Control and extract samples were diluted by cesium chloride solution (solution 1) and with cesium chloride + aluminum chloride (solution 2) a 9/1 ratio, depending on the acid used in order to digestion. Then, amount of sodium in extracted substances and control samples and a series of standard solutions were determined by means of flame photometry method with propane flame in the air in wavelength of 589 nm. Sodium concentration in the solution will be obtained by plotting the calibration curve. In order to measure the sulfur in plant, 15 ml of extracted solution and Series of standard solutions transferred into a 50 ml container (Erlenmeyer flask) and 2ml of Acacia gum solution 25% were added. 1gr barium chloride crystal was added and was left for a minute. Then, 8 ml distilled water was added and agitated until the crystals completely were dissolved. Absorption ratio was monitored and recorded at 420 nm meanwhile 3 to 8 minutes from the beginning.
2.5. Data Analysis
Analysis of data was performed by means of MSTATC software and comparing averages through Duncan method in the range of 5%. Charts were prepared in Excel software by use of the variance analysis.
3. Result and discussion
Based on results obtained from variance analysis table related to chemical elements of water (Table 2) in various treatments, only change ions bicarbonate, calcium, magnesium and hardness are not significant. Results obtained from variance analysis of EC and TDS changes in water samples showed that there are significant differences among water treatments. Making comparison between averages through Duncan method in the range of 5% showed that each of those treatments is classified as a distinct group. According to chart A and B (Fig. 3), activated carbon and zeolite treatment as well as zeolite treatment showed EC and TDS increase in water compared with control sample. This is due to mineral nature of zeolite and releasing metallic ions from zeolite structure in water. Although reducing EC & TDS in water samples by activated carbon not striking but do not show with control sample significant difference. Appropriate concentration of TDS for drinking water and agricultural water are less than 500 mg/lit and 1200 mg/lit respectively thus despite of increases in TDS concentration through two of treatments it is usable for agricultural sector. [2] Results of PH variance analysis indicated that there is significant difference in at least one samples water treatment. By comparing averages through Duncan method in the range of 5% it was found that treatments are categorized in two distinct groups. According to chart C (Fig. 3), activated carbon and zeolite treatment and zeolite treatment do not affect water PH do not show any differences with control sample. PH of water became alkaline in activated carbon treatment and showed increase because of active carboxylic groups in the route of activated carbon pores and due to dissolving them in the water.
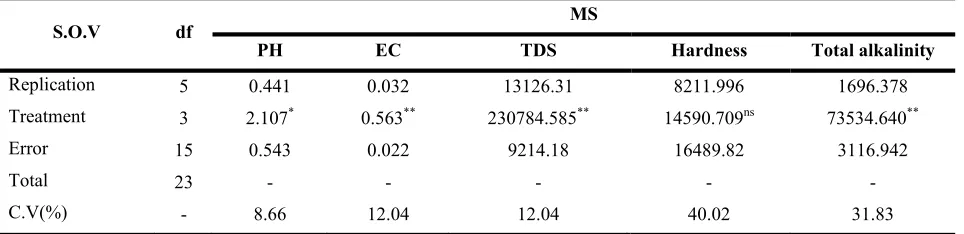
Table 2. Analysis of variance for chemical elements in water
S.O.V df MS
PH EC TDS Hardness Total alkalinity
Replication 5 0.441 0.032 13126.31 8211.996 1696.378
Treatment 3 2.107* 0.563** 230784.585** 14590.709ns 73534.640**
Error 15 0.543 0.022 9214.18 16489.82 3116.942
Total 23 - - - - -
C.V(%) - 8.66 12.04 12.04 40.02 31.83
nsnot significant, * significant in level 5%, ** significant in level 1%
Continues Table 2. Analysis of variance for chemical elements in water
S.O.V df
MS
SO4-2 CL- HCO
3-2
Plural
Anions Mg
+2 Ca+2 Na+ Plural
Cations
Replication 5 12663.3 1123.183 6560.835 1113.269 668.875 850.488 934.068 1052.813 Treatment 3 36477.108** 10504.375** 7341.885ns 92450.169** 909.008ns 990.014ns 40480.704** 38761.15**
Error 15 4186.518 392.959 7018.305 5186.797 500.883 691.608 1715.955 1016.422
Total 23 - - - -
C.V (%) - 58.96 10.51 30.40 12.55 64.21 37.90 32.00 13.58
nsnot significant, * significant in level 5%, ** significant in level 1%
Table 3. Analysis of variance traits measured in radish plant
S.O.V
MS
df
Total fresh weight
Total dry weight
Total yield
fresh weight
root
Dry weight
root
yield root
Fresh weight shoot
Dry weight
shoot
Replication 2 333.954 4.329 262.565 20.284 0.308 15.594 250.811 2.359
Treatment 3 59.239ns 1.262ns 45.471ns 23.034ns 0.059ns 21.048ns 118.274ns 1.629ns
Error 6 87.208 1.674 66.160 8.585 0.137 6.874 35.622 0.899
Total 11 - - - -
C.V(%) - 9.40 11.51 9.23 13.68 13.74 14.00 7.62 11.09 nsnot significant, * significant in level 5%, ** significant in level 1%
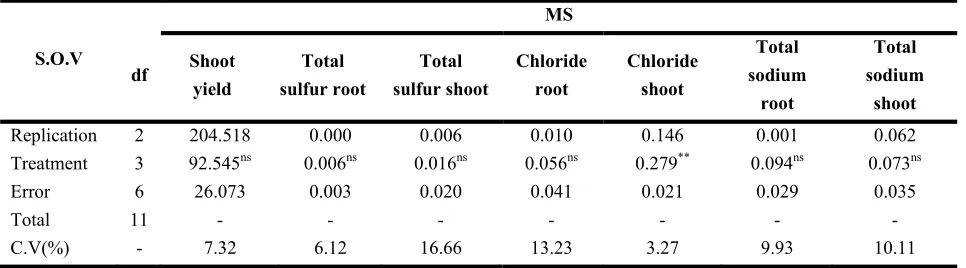
Continues Table 3. Analysis of variance traits measured in radish plant
S.O.V
MS
df Shoot
yield
Total sulfur root
Total sulfur shoot
Chloride root
Chloride shoot
Total sodium
root
Total sodium
shoot
Replication 2 204.518 0.000 0.006 0.010 0.146 0.001 0.062
Treatment 3 92.545ns 0.006ns 0.016ns 0.056ns 0.279** 0.094ns 0.073ns
Error 6 26.073 0.003 0.020 0.041 0.021 0.029 0.035
Total 11 - - - -
C.V(%) - 7.32 6.12 16.66 13.23 3.27 9.93 10.11 nsnot significant, * significant in level 5%, ** significant in level 1%
Fig. 4. The reaction of radish plant to change of water quality will result use of activated carbon and zeolite. a Cl concentration in shoot (%).
4. Conclusions
Treatments were in contact with water used inside the tanks during running this experiment while the water was not in flow. Hence, the reaction of activated carbon and zeolite facing with current water could be different. Water used for this experiment is of good quality suitable for
diversity, low cost and unique characteristics compared with inorganic adsorbents such as zeolite. Activated carbon is a durable substance which its structural lattice will retain the strength for a long time in alkaline and acidic condition. Some advantages of activated carbon and zeolite are no entrance of structural compounds of these adsorbents into the plant.
Acknowledgment
Deputy of soil & Water & Industry, Jihad-e-Agriculture Ministry. Office affairs of water and soil, jihad agriculture ministry. Office of development new systems of irrigation, jihad agriculture ministry. Research institute of
technical and engineering, jihad agriculture ministry. Research institute of soil and water, jihad agriculture ministry. Organization of parks and green space, Karaj municipalities.
References
[1] J. Paul Guyer, P.E., R.A., Engineering SoundBite: Water Desalination, United States government, 2010.
[2] Health Canada. Guidelines for Canadian Drinking Water Quality: Chemical and Physical Parameters.2007.