Journal of Hydraulic Structures J. Hydraul. Struct., 2016; 2(1):1-11 DOI: 10.22055/jhs.2016.12646
Riprap sizing for scour protection at river confluence
Elham Ghanbari Adivi1 Mahmood Shafai Bajestan2 Jalil Kermannezhad3
Abstract
River confluence is a common feature of most irrigation and drainage channels and river systems, where tributary conflicts the main channel. In these section, rapid changes in velocity and discharge, sediment distribution and flow turbulent result in a deep confluence scour, a bar point in the separation zone at downstream of junction corner and finally vortex flow. Thus, the main goal of this study is to conduct a series of experimental tests to investigate the required size of rocks to control the scour hole. The results show that for a constant ratio discharge, Qr, the size of riprap in the incipient motion increases with decreasing in tailwarer depth. In other words, for any rock size the tailwater depth required for incipient motion increases with increasing the ratio of discharge, Qr. For each constant ratio discharge, or, the size of riprap in the incipient motion increases with increasing in tailwater velocity, Vt. Finally, some equations are presented for predicting the size of rocks and the proposed equations has been compared with existing ones.
Keywords: River Confluence, Riprap, Scour hole, Junctions.
Received: 12 December 2015; Accepted: 15 June 2016
1. Introduction
Confluences are the basic building blocks in river networks at all scales. When, two rivers merge at a confluence, rapid changes in fluid velocity and turbulence intensity cause changes in the bed geometry. Usually, a deep scour hole and a depositional point bar are present at the confluence. One important phenomenon that has been overlooked in previous studies is the progressive penetration of the scour hole into the tributary channel. This progressive penetration may jeopardize the structural safety of the lateral channel in the proximity of the main channel. The flow pattern, scour and sedimentation in confluences are complex and have attracted the
1 Department of Water Science Engineering, Shahrkord University, Shahrkord, 09166077037 [email protected] (Corresponding author)
2 Department of Water Science Engineering, Shahid Chamran University, Ahwaz, [email protected]
3
Department of Water Science Engineering, Lorestan University, Khoram Abad,attention of many researchers. Previous researches on river channel confluences can be classified into two main groups. The first group consists of theoretical and experimental studies focusing on flow characteristic without the inclusion of sediment transport, such as Webber and Greated in 1966 [1], Lin and Soong in 1979 [2], Best and Reid in 1984 [3], Ramamurthy et al. [4], Hager [5], Gurram et al. [6], Hsu et al. [7,8], Bradbrook et al. [9], Lane et al. [10], Weerakoon et al. [11], Biron et al. [12], Weber et al. [13] and Huang et al. [14]. These studies considered parameters such as depth ratio, separation zone dimensions, hydraulic jump conditions or three-dimensional flow effects. The second group includes the analysis of sediment transport (Mosley [15], Best [16], Roy et al. [17], Rhoads and Kenworthy [18], Rhoads and Sukhodolov [19], Bryan and Kuhn [20], Boyer et al. [21], Parsons et al. [22], Ghobadian and Shafai Bejestan [23], Ghobadian [24], Ghanbari Adivi and Shafai Bejestan [25]) Concentrating on confluence scour, sediment transport and bed morphology, effects of bed discordance, shear layer turbulence and mixing. The effects of confluence angle and momentum and discharge ratios have been taken into account in several studies but the effects of tail water depth and bed grain size have received less attention. There is no significant published attempt in the previous studies for developing a relation for predicting the suitable value of stable stone; and this is why the focus of our paper is on this important issue.
These phenomena cause failure in the structure near the confluence area, changes in the river morphology and it causes problem for navigation. Therefore, it has to be made to control the scouring which are the main cause of facing problems. Among the measuring techniques which should be taken into consideration is the use of rocks. Due to three- dimensions of flow and sediment structure at river confluence, investigation on scouring and sedimentation in this area should be possible by physical modeling. Thus the main goal of this study is to conduct a series of experimental tests to investigate the required size of rocks for controlling the scour hole, in other words the purpose of this study is to investigate the factors affecting the stability of the riprap, that used to control erosion at the confluence of the rivers and control sediment transported to the downstream of confluent. To accomplish this goal, over 78 tests were conducted in the flume of the hydraulic laboratory of Shahid Chamran University.
2.
Dimensional analysisIn river confluence, many variables can affect the scour hole and point bar dimensions and maximum penetration of scour hole into the tributary channel. To develop a general relation for predicting maximum value of penetration of scour hole into the tributary channel, one may consider the following dependence:
0
)
,
,
,
,
,
,
,
,
,
,
,
,
,
,
,
,
,
,
,
,
(
Q
1Q
2Q
3y
ty
uy
bg
wB
1B
2B
3S
0n
D
50 sF
s g
f
(1)In these equations Q1, Q2 and Q3 are flow discharges in the lateral channel and in the main channel upstream and downstream of the confluence, respectively. B1, B2 and B3 are the corresponding channel widths which are equal and constant , θ is the confluence angle, So is the bed slope, both of them are constant.
The riprap is uniform there for the impact of resistance angle φ, geometric standard deviation σg and sediment particle shape factor Fs can be ignored. σ is Surface tension of water.
0
)
,
,
,
,
,
,
,
,
,
,
,
,
(
Q
1Q
2Q
3y
ty
uy
bg
wB
D
50 s
f
(2)[25].
0
)
,
,
,
,
,
,
,
,
Re
,
,
(
50 50 50 1 2 33
s b u t b u b t u t gD
y
D
y
D
y
y
y
y
y
y
y
Q
Q
We
F
f
(3)The depth of flow upstream of the confluence, yu and depth of lateral channels, yb are affected by depth of flow downstream of the confluence, yt; therefore, yuand ybcan be removed. Fg is the densimetric Froude number and Re3 is the Reynolds number downstream of the river confluence. Fg is computed as Vt/[g (Gs-1) D50]0.5, with Vt being the flow velocity downstream of the confluence, g the acceleration of gravity. Gs the specific gravity of the sediment (Gs = ρs/ ρw ), D50 the median particle size and ρs density viscosity of sediment, while Re is equal to VtYt ρw/μ with ρw and μ representing density and dynamic viscosity of water, respectively. Considering that stability number (S.N) and Fg show the effect of gravity on the flow hydraulic, But because of the importance of (S.N) in particle stability analysis, Fg can also be disregarded. Weber number downstream of the connection point, We3 is disregarded because Weber in open channel is negligible. All experimental tests in this study have been carried out under subcritical conditions and therefore the bed slope has no significant effects on the flow patterns [6]. For high Reynolds number and rough boundaries, the Reynolds number effect can also be disregarded. Therefore, Eq. 3 is reduced to the following form:
) /D y , /Q g(Q =
S.N 2 1 t 50 (4)
Equation 4 is the basis for the analysis of the experimental data.
3. Experimental setup and methodology
The experimental setup consists of a main flume 9 m long with 70 cm deep for the first 2.4 m and 40 cm for remaining 7 m with 35 cm wide and a lateral flume 3 m long, 40 cm deep and either 25 or 35 cm wide. Both flumes had a horizontal slope. At the upstream end of each flume a stilling box was installed to reduce the kinetic energy of the entrance flow.
A head tank provides a constant discharge to both stilling boxes. The amount of Discharge is measured by an electronic flow meter with an accuracy of 0.01 L sec-1. At the end of the main
Figure1. Plan view of experimental set up
4. Results and discussion
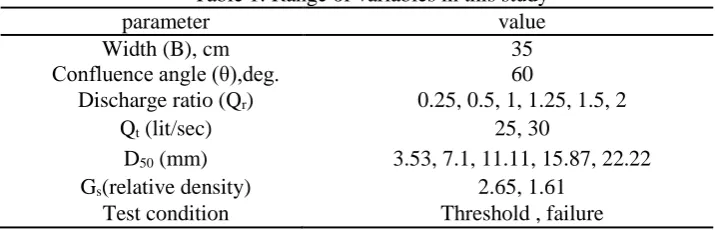
In this investigation, 78 experiments on stability number were carried out. Table 1 shows the range of the relevant parameters and dimensionless variables covered by the experiments.
Table 1: Range of variables in this study
parameter value
Width (B), cm 35
Confluence angle (θ),deg. 60
Discharge ratio (Qr) 0.25, 0.5, 1, 1.25, 1.5, 2
Qt (lit/sec) 25, 30
D50 (mm) 3.53, 7.1, 11.11, 15.87, 22.22
Gs(relative density) 2.65, 1.61
Test condition Threshold , failure
Effect of flow ratio (Qr) on the stability number (S.N)
it changes. It has played an important part in the motion of particles. Therefore threshold of particle motion (or failure) occurs at a lower velocity. Based on the relation’s stability number, with decreasing at the velocity, the stability number is reduced. It was observed that at the constant flow rate, although there are larger particles, threshold motion is higher but stability number is reduced at this situation.
lit/s) 30 = Q , 2.65 = G (
: s t
c
0.9 1.3 1.7 2.1
0.0 0.5 1.0 1.5 2.0 2.5
(S
.N)
c
(Qr)c
D50=3.525 mm D50=7.14 mm
D50=11.11 mm D50=15.87 mm
1.5 1.9 2.3 2.7
0.0 0.5 1.0 1.5 2.0 2.5
(S
.N)
f
(Qr)f
D50=3.525 mm
D50=7.14 mm
D50=11.11 mm
lit/s) 25 = Q , 2.65 = G ( : a
Figure 2 (a-d). Variation of stability number (S.N) with flow rate (Qr)
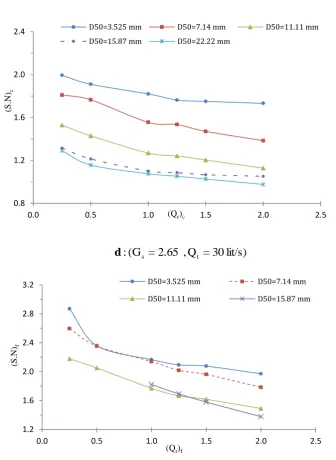
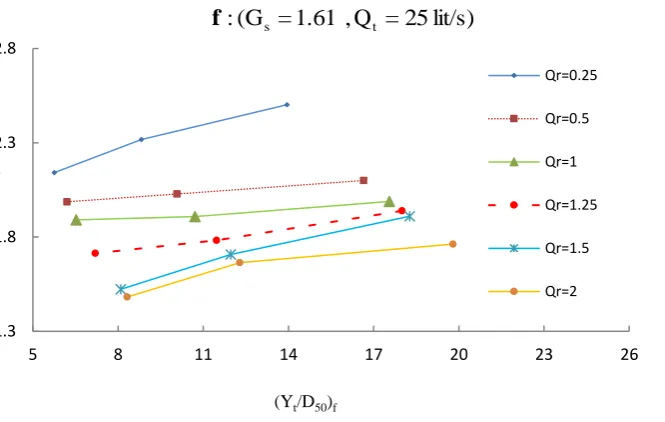
Effect of flow ratio (Yt/D50) on the stability number (S.N)
Rate of tailwater depth to particle size (Yt/D50), is one of the another parameter that affects on stability number in both threshold and failure condition.
According to these figures (3: a-f) at a constant flow ratio, with increasing (Yt/D50) (proportional to the decrease in particle diameter) stability number is enhanced, because with reducing the particle diameter the resistance force due to the weight and threshold motion of it is reduced but, Because of the particle diameter decreases, observed that the threshold velocity of the particle diameter (stability number) is decreasing in this situation. This trend results from a decrease in the momentum of the lateral channel when the flow ratio decreases (all other
0.8 1.2 1.6 2.0 2.4
0.0 0.5 1.0 1.5 2.0 2.5
(S
.N)
c
(Qr)c
D50=3.525 mm D50=7.14 mm D50=11.11 mm
D50=15.87 mm D50=22.22 mm
1.2 1.6 2.0 2.4 2.8 3.2
0.0 0.5 1.0 1.5 2.0 2.5
(S
.N)
f
(Qr)f
D50=3.525 mm D50=7.14 mm
D50=11.11 mm D50=15.87 mm
lit/s) 30 = Q , 2.65 = G (
: s t
d
parameters being constant) and then increases at stability number.
lit/s) 25 = Q , 2.65 = G (
: s t
a
0.5 1.0 1.5 2.0
0 10 20 30 40 50 60 70 80
(S
.N)
c
(Yt/D50)c
Qr=0.25 Qr=0.5 Qr=1 Qr=1.25 Qr=1.5 Qr=2
0.8 1.3 1.8 2.3
5 15 25 35 45 55 65
(S
.N)
f
(Yt/D50)f
Qr=0.25 Qr=0.5 Qr=1 Qr=1.25 Qr=1.5 Qr=2
lit/s) 25 = Q , 2.65 = G (
: s t
b
0.8 1.3 1.8 2.3
0 10 20 30 40 50 60 70 80 90 100
(S.
N)c
(Yt/D50)c
(Qr=0.25)
Qr=0.5
Qr=1
Qr=1.25
Qr=1.5
Qr=2
1.2 1.7 2.2 2.7
0 10 20 30 40 50 60 70 80 90
(S.
N
)f
(Yt/D50)f
Q=0.25
Qr=0.5
Qr=1
Qr=1.25
Qr=1.5
Qr=2
1 1.4 1.8
8 11 14 17 20 23 26 29 32
(S.
N)c
(Yt/D50)c
Qr=0.25
Qr=0.5
Qr=1
Qr=1.25
Qr=1.5
Qr=2
lit/s) 30 = Q , 2.65 = G (
: s t
c
lit/s) 30 = Q , 2.65 = G (
: s t
d
lit/s) 25 = Q , 1.61 = G (
: s t
e
lit/s) 25 = Q , 1.61 = G (
: s t
f
Figure 3 (a-f). Variation of stability number (S.N) with rate of tailwater depth to particle size
(Yt/D50)
Fig. 4: Observed values of stability number of riprap at the channel confluence versus predicted values by Eq. 5
Stability number equation
To develop a relation to predict the maximum particle size of stable riprap into the tributary channel at the river confluences, the following equation was obtained by multiple regressions on the experimental data (r = 86%):
(-0.119) c r 0.209 c 50 t
c
=
0.722(Y
/D
)
.
(Q
)
(S.N)
(5)1.3 1.8 2.3 2.8
5 8 11 14 17 20 23 26
(S.
N)f
(Yt/D50)f
Qr=0.25
Qr=0.5
Qr=1
Qr=1.25
Qr=1.5
Qr=2
0.8 1.2 1.6 2.0 2.4
0.8 1.2 1.6 2.0 2.4
m
ea
su
re
m
ent
(S
.N)
c
(S.N)C prediction
R2=86% RMSE = 5.5
+20%
The range of applicability of Eq. 5 is given by the values of Table 1 and it must be noted that it is valid only when there is no movement of bed material upstream of the channel confluence.
In order to investigate the accuracy of Eq. 5, the observed values of relative stability number have been plotted against the predicted values and the results are presented in Fig. 4. As it can be seen from this figure most of data are between the 80% confidence bands statistical analyses. The relative error of the equation is about 14%. This means that Eq. 5 can be applied as a guide in the prediction of maximum size of stable riprap into the tributary channel at river confluences. The form of Eq. 5 clearly shows that the flow ratio has a negative effect while the other parameters (Yt/D50), have positive effect on the relative stability of riprap particle.
5. Conclusion
In this study a general dimensionless equation for the prediction of maximum particle size of stable riprap into the tributary channel at river confluences has been developed. A series of 78 experimental tests with constant confluence angle and width at both channels, and also different discharge ratio (Qr) and relative density (Gs) in an asymmetrical confluence have been conducted to test the proposed formulation. The results showed that the stability number of riprap into the tributary channel increases with increasing the ratio of tailwater depth to particle size (Yt/D50); while it decreases with increasing the ratio of lateral channel discharge to main channel discharge at upstream of the confluence. A relationship has also been introduced that has a 14% relative error for predicting stable particle diameter of riprap into the tributary channel.
References
1. N.B. Webber, and C.A. Greated, 1966. An investigation of flow behavior at the junction of rectangular channel. Proc. Instn. Civ. Engres., 34: 321-334.
2. J.D. Lin and H.K. Soong, 1979. Junction losses in open-channel flows. Water Resour. Res., 15: 414-418.
3. J.L. Best and I. Reid, 1984. Separation zone at open-channel junctions. J. Hydraulic Eng., 110: 1588-1594.
4. A.S. Ramamurthy, L.B. Carballada and D.M. Tran, 1988. Combining open channel flow at right angled junctions. J. Hydraulic Eng., 114: 1449-1460.
5. W.H. Hager, 1989. Transition flow in channel junctions. J. Hydraulic Eng., 115: 243-259. 6. S.K. Gurram, K.S. Karki and W.H. Hager, 1997. Subcritical junction folw. J. Hydraulic
Eng. ASCE, 123: 447-455.
7. C.C. Hsu, F.S. Wu and W.L. Lee, 1998. Flow at 90 equal-width open-channel junction. J. Hydraulic Eng. ASCE, 124: 186-191.
8. C.C. Hsu, W.J. Lee and C.H. Chang, 1998. Subcritical open-channel junction flow. J. Hydraulic Eng. ASCE, 124: 847-855.
9. K.F. Bradbrook, P.M. Biron, S.N. Lane, K.S. Richards and A.G. Roy, 1998. Investigation of controls on secondary circulation in a simple confluence geometry using a three-dimensional numerical model. Hydrol. Processes, 12: 1371-1396.
11. S.B. Weerakoon, Y. Kawahara and N. Tamai, 1991. Three-dimensional flow structure in channel confluences of rectangular section. Proceedings of 24th Congress of International Association for Hydraulic Research, September 1991, Madrid, Spain, pp: 373-380. 12. P.M. Biron, A. Richer, D.A. Kirkbride, G.A. Roy and S. Han, 2002. Spatial patterns of
topography at a river confluence. Earth Surf. Processes Land Forms, 28: 913-928. 13. L.J. Weber, E.D. Schumate and N. Mawer, 2001. Experimentals on flow at a 90°
open-channel Junction. J. Hydraulic Eng. ASCE, 127: 340-350.
14. J.L. Huang, L.J. Weber and G.L. Yong, 2002. Three-Dimensional numerical study of flows in open-channel junctions flow. J. Hydr. Engrg., 128: 268-280.
15. M.P. Mosley, 1976. An experimental study of channel confluences. J. Geol., 85: 535-562. 16. J.L. Best, 1988. Sediment transport and bed morphology at river channel confluences.
Sedimentology, 35: 481-498.
17. A.G. Roy, R. Roy and N. Bergeron, 1988. Hydraulic geometry and changes in flow velocity at a river confluence with coarse bed material. Earth Surface Processes Land forms, 13: 583-598.
18. B.L. Rhoads and S.T. Kenworthy, 1998. Time-averaged flow structure in the central region of a stream confluence. Earth Surface Processes Landforms, 23: 171-191.
19. B.L. Rhoads and A.N. Sukhodolov, 2001. Field investigation of three-dimensional flow structure at stream confluences: 1.Thermal mixing and time-averaged velocities. Water Resour. Res., 37: 2393-2410.
20. R.B. Bryan, and N.J. Kuhn, 2002. Hydraulic conditions in experimental rill confluences and scour in erodible soils. Water Resour. Res., 38: 1-22.
21. C. Boyer, A.G. Roy and J.L. Best, 2006. Dynamics of a river channel confluence with discordant beds: Flow turbulence, bed load sediment transport and bed morphology. J. Geophys. Res., 111: F04-F04.
22. D.R. Parsons, J.L. Best, S.N. Lane, O. Orfeo, J.R. Hrady and R. Kostaschuk, 2007. Form roughness and the absence of secondary flow in a large confluence-diffluence rio parana, argentina. Earth Surface Processes Landforms, 32: 155-162.
23. R. Ghobadian, and M. Shafai Bejestan, 2007. Investigation of sediment patterns at river confluence. J. Applied Sci., 7: 1372-1380.
24. R. Ghobadian, 2007. Investigation of flow, scouring and sedimentation at river-channel confluences. Ph.D. Thesis, Department of Hydraulic Structures, Shahid Chamran University, Ahwaz, Iran.