I.
Introduction
S
IRI (Apple), Cortana (Microsoft), Alexa (Amazon), Bixby (Samsung) - these are the names of virtual personal assistants that the user can communicate with using his/her voice. They are still far from the perfectly intelligent entities that can be seen in science fiction stories but they have a very important feature - they are able to understand human speech, to interpret it correctly and to execute user‘s commands or requests - for example to open an application, to create and to send a dictated e-mail or to find out on the internet the closest restaurants in the neighborhood and then to reply to the user in the human speech. The companies that stand behind their development do not hide the fact that they are working on another important feature implementation - the ability to recognize emotions in human speech.Machine recognition of emotions in a human voice is another step towards real artificial intelligence and implementation of voice assistants is just one of its many potential uses. The advantages that the emotional recognition system could bring are evident in many areas, for example user-computer interaction, medicine or the business sphere. At first let’s deal with the basic terms related to the topic of the article as are emotions and their expressions which can be found and identified in a human voice.
The oldest researches of neuroscientists and psychologists have shown that human emotions play a big role in decisions making [5]. The relationship between emotions and decision is two-sided - the
result of the decision affects emotions and, on the contrary, emotional state affects the decisions, this means that decision is to a certain degree predictable.
This paper is divided into several parts. The section Related work presents similar researches that have affected research in this scientific field and, of course, they have influenced this work too. The third section introduces the theoretical background of the problematics. The fourth section presents a novel approach to the emotional state recognition and classification. The fifth section deals with the results of the experiment and subsequently is presented a discussion and conclusion of the paper.
II.
Related Work
Exact definitions for terms of emotion and emotional state in the explored scientific field do not exist. The term emotion is defined by psychologists, pedagogues and neuroscientists in different ways [1],
[6], [13]. Depending on external or internal stimulus and on the way of perception, there are used different strategies for emotional state classification. Most commonly used classifications are the Ekman’s Classification and the Russell’s Circle Model. The defined next approaches are used depending on the assessment method, for example, emotional state categorization, so-called dimensional approach, assessment the emotional state by another qualified person (most often by psychologist) [8]:
1. Categorical approach,
2. Dimensional approach, 3. Appraisal-based approach.
Keywords
Voice Analysis, PRAAT, EMOREC, Emotional State Identification, Classification.
Abstract
During the last decades the field of IT has seen an incredible and very rapid development. This development has shown that it is important not only to shift performance and functional boundaries but also to adapt the way human-computer interaction to modern needs. One of the interaction possibilities is a voice control which nowadays can‘t be restricted only to direct commands. The goal of adaptive interaction between man and computer is the human needs understanding. The paper deals with the user's emotional state classification based on the voice track analysis, it describes its own solution - the measurement and the selection process of appropriate voice characteristics using ANOVA analysis and the use of PRAAT software for many voice aspects analysis and for the implementation of own application to classify the user's emotional state from his/her voice. In the paper are presented the results of the created application testing and the possibilities of further expansion and improvement of this solution.
Voice Analysis Using PRAAT Software and
Classification of User Emotional State
M. Magdin*, T. Sulka, J. Tomanová, M. Vozár
Constantine the Philosopher University in Nitra, Faculty of Natural Sciences, Department of Computer
Science, Tr. A. Hlinku 1, 949 74 Nitra (Slovakia)
Received 31 October 2018 | Accepted 17 January 2019 | Published 15 March 2019
* Corresponding author.
E-mail address: [email protected]
All strategies for emotional states determining have, when focused on a dimensional approach, common the term valence. When is the emotional state classification considered as a psychological process, for instance, during emotion determining from speech, then valence is a variable that determines a size of change of the emotional state (e.g. from the positive level to the negative one). In case of dimensional or more precisely multidimensional approach is used for emotional state measurement and classification another variable arousal. A multidimensional approach model (Fig. 1) using these two variables is described by [2], and there is a number of works using two-dimensional models to emotional state classification too [4], [22], [10].
Fig. 1. Arousal-valence dimensional approach [2].
Using Arousal-valence dimensional approach model it is possible to characterize most of the emotional states that can be recognized from speech.
However, a long time ago [19], the authors have pointed to the fact that it is equally important, except valency and degree of excitement in the voice, to deal with how long this state persists. That is the reason why there is to two-dimensional model added the third dimension – time. The main reason is that according to Ekman’s theory, emotion is a reaction to external stimuli, and therefore it is necessary to consider not only the emotional state that occurred, but what caused it and how long it lasted too. However, use of the approach of Scherer et al. is limited to automatic emotional state recognition only (real-time) because it causes many other research questions [21].
Most of the existing systems have been developed by using recordings of fully developed emotions but real emotions are not always obvious and can overlap each other. The recordings of different emotions are contained in speech databases. Nowadays, there is no official standard database which observe to comparing the results of different researches and methods used to recognizing emotions [12]. Emotions recognition researches are focused on recognizing only 5-6 emotions because most of databases do not cover wider spectrum of emotions [23].
Although variables valence and arousal are measurable items, emotions recognition systems can be influenced by the spoken language because values of these two variables do not match for different languages (when we read the same text in English, German or Chinese, measured values will be different). According to [11], valence can be better measured on the basis of semantic properties, while variable arousal is better measurable on the basis of acoustic functions. In ideal case, these two variables should be completely independent from the language [12]. They should be sufficient to be used in real situations too - they should recognize emotion in speech despite the noise and the din [12]. In the fourth section is presented a way how to prevent these problems by using the necessary characteristics analysis.
III. Theoretical Background
Trend of the emotional state classification from speech (from sound track) as was shown above in the Related work section will have an increasing character. However, similarly as in case of the emotional state classification e.g. from the user’s facial features it is necessary to carry out a number of researches focused on the different phases of the recognition process: detection, extraction and the classification itself. The detection phase means sound analysis, the aim of which is to separate the spoken word (voice) from the other sound part of the soundtrack. The extraction phase includes the selected (necessary) soundtrack parts extracting and the analysis. The classification is the last and, essentially, the most important part of the whole process because it represents the first and quite serious problem which occurs in the detection phase right from the start. Word emotion is commonly used in many meanings and it is difficult to define objectively what the emotion actually is and when it really occurs [18]. Current psychological theories and models of emotions due to their common features can be characterized by so-called models:
1. Dimensional models: One-dimensional [7], Multidimensional
[16], [17].
2. Discrete models: Circular [15], Models of Basic Emotions [9].
3. Meaning-oriented models: Lexical models, Social constructivist models.
4. Component models [14].
To sum up the previous ideas, in the models mentioned above the most frequent emotions recognition and classification studies focus only on 5-6 emotions recognition because most of databases do not cover their wider spectrum [23]. As the basic model, Ekman’s Classification (happiness, surprise, anger, disgust, fear, sadness) is most commonly used in research.
Most of the existing systems listed in the Related work section dealing with the emotional state classification from the voice track were created using recordings of fully developed emotions but the actual emotions are not always obvious and can overlap. The recordings of various emotions are contained in speech databases because of the classification phase needs, similarly, for example, as in the case of the emotional state classifying from extracted parts of the face. Currently, there are available various robust databases (simulated, induced and natural) that contain photographs of people. Using the photographs of people faces it is possible to implement the classification phase using SVM, neural networks, HMM, Bayes classifier or other techniques and methods.
However, as mentioned above, in the case of emotional state classification from the voice track there is no standard database currently available to compare the results of different researches and methods that are used for emotions recognition and classification [12]. This is, however, a serious problem of the classification phase, since systems recognizing and classifying emotions can be influenced by the language of speaker. As an example, the English word “okay”, depending on the situation, can express admiration, consent or disinterest. Ideally, these systems should be completely language – independent. [12]. Human voice is characterized by several features. The basic ones are:
F0 - the basic frequency of voice that contains the tonic and rhythmic characteristics of speech and is dependent on lexical content
[3].
Intensity - in practice, it is expressed by the acoustic pressure level and its unit is decibel. The human ear perceives intensity subjectively because it perceives the volumes of certain frequencies differently.
Jitter and shimmer - the term jitter means the cyclical changes of basic frequency. Changes are not perceived as changes of voice height but of voice quality. Shimmer indicates similar cyclical changes of energy. They require counting of the voice basic frequency during consecutive periods [20].
IV. Novel Approach of The Emotional State Recognition
and Classification
In the Theoretical background section the various features that can significantly affect recognition of emotional state and then its classification are mentioned. But not all of the characteristics are sufficient or necessary to emotional state recognition and classification from the voice. From this reason, it is necessary to determine exactly the importance of these characteristics. In this case has been used the PRAAT program that is designed for scientific analysis and speech synthesis, it also allows own scripts writing and exporting the results to files. In this program were created two scripts:
1. voice_analysis.praat, 2. measure_characteristics.praat.
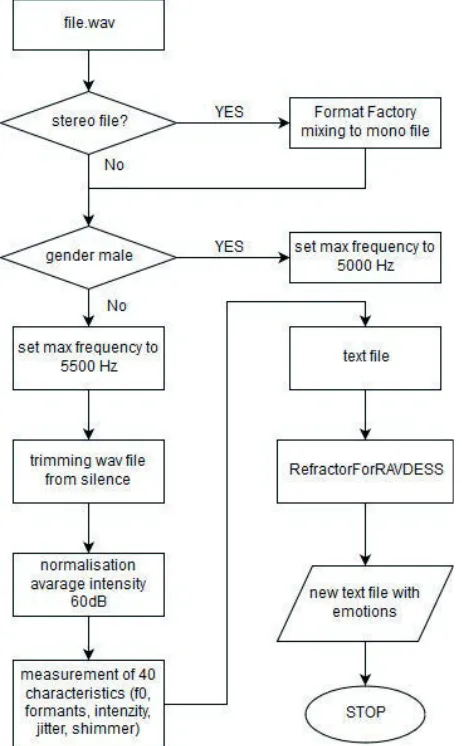
The flow chart in Fig. 2 is a complete description of the pipeline to process and extract relevant features from audio waveforms.
Fig. 2. The flow chart of process for extract relevant features from audio
waveforms.
Inputs of the script voice_analysis.praat are selected .wav files. This script will export to output file next items: the first will be the header with the names of the measured attributes and into next lines will be written a .wav file name and then 40 measured values separated by the tabs. The script will choose a .wav file, then, before measurement, the script will edit the .wav file so that its average intensity is 60 dB and then the script will strip the silence. This is a form of normalization and the purpose is to prevent errors caused by files of varying intensity and longer passages of silence. High intensity values are typical for strong emotions such as anger but the intensity is greatly influenced, for example, by the recording technique, by settings or by the speaker distance from the microphone. In case of no correction, it could happen that the sadness expressing recording in which the speaker is close to the microphone will get the same intensity as the anger expressing recording of other speaker who is further away from the microphone. On the other hand, this correction also has an unwanted negative effect - recordings become less dynamic. Passages that contain silence without noise affect the intensity too - in some cases the intensity may reach negative values, so the silence is cropped off. We attempted to set cropping in PRAAT so that no pauses between words were cut. Created script measures 40 different characteristics (F0, formants, intensity, jitter and shimmer) for each of the input files.
The limitations could not be avoided - the script cannot be used to measure characteristics when the .wav files are mixed from men’s and women’s recordings; it is necessary to set the gender in the input dialogue after running the script. The reason of this limitation is that there must be used a different maximum frequency for men (5000 Hz) and for women (5500 Hz) when searching formants, otherwise the output may be incorrect. Because of the same reason, it is not possible to use the script to measure the children’s voice characteristics because when searching formants it is necessary to use the frequency 8000 Hz. So, this possibility was not implemented because it was not possible to obtain child recordings for testing the application. The last limitation was caused by the fact that the function for silence cropping requires a mono track. Because of this reason if the files are recorded in two channels as stereo, the file must be pre-mixed into one mono channel before running the script. In the presented solution, was used the FormatFactory program to pre-mix stereo files.
The second script measure_characteristics.praat is a modification of the first script and it was created after the most appropriate characteristics were identified by ANOVA analysis. This script won’t write a header with the names of the attributes but only the gender abbreviation - M for men and Z for women, in comparison with the first script. Then it will not measure all 40 characteristics but only the top 15 according to the analysis. There are the same limitations for both scripts.
A. RefactorForRAVDESS
When choosing the characteristics, the need to group the measured values according to emotions came out. It was a reason for simple auxiliary console application creating. It is written in C# and is called RefactorForRAVDESS. The name of this application is derived from the audiovisual database created at the Ryerson University in Toronto. It is free available database of 12 male and 12 female voice tracks of actors. The actors in these soundtracks imitate eight emotions - neutral emotion, peace, sadness, happiness, anger, fear, surprise and disgust that correlate with emotions according to the Ekman’s classification. All emotions except neutral were recorded with two levels of expression - normal and strong expression. Each emotion is recorded 192 times, neutral 96 times, because it has only a normal degree of expression1. Files in the RAVDESS database are named according to key which can give us a lot of information, for instance, to identify emotion.
Created application RefactorForRAVDESS will read the output file from PRAAT program, in each its row will overwrite the name of the original .wav file to the emotion, and a new version of the file will be saved into the same folder as the original output file is stored. The files with characteristics prepared this way are ready to be used by ANOVA analysis.
B. Welch’s Corrected ANOVA Analysis and Results
There was necessary to select from 40 measured characteristics only a few ones which can help to distinguish emotions as good as possible. Our assumption was that the characteristics tend to cluster around certain values depending on specific emotion and the purpose was to use this feature to select characteristics. The goal was to choose the characteristics that are as diverse as possible for different groups. The characteristics were chosen separately for men and women because it was assumed that key emotional expressions may be different for women and men.
There are many ways and algorithms determined for characteristics selection, one of them is to use a single-factor analysis of variance, otherwise called ANOVA. This analysis is based on unpaired t-test principle which compares the data of two groups. ANOVA is an extension of this analysis for more groups. During testing there is determined the dependence of the quantitative variable, that measures characteristics in this case, from the categorical variable, that is emotion. Emotion will be an independent variable in the analysis and the characteristics will become dependent variables, not the opposite, because the emotion is primary and the characteristics will not influence the speaker’s emotional state, but they result from it. However, only the characteristics with the largest variance between groups allow the prediction of unknown emotions.
In ANOVA analysis F criterion expresses the rate of variance which is the ratio of the variance of the values between the groups and the variance of the values within the groups. An ideal case is the highest value F that means the largest variance between the groups and small variance within the groups. The use of ANOVA analysis assumes that several conditions are satisfied. Measurements results must be independent, they have to have a normal distribution and equality of the variances must be met. Meeting the first condition is relative because there is no test that would identify independence but it depends on the focus of research, on the data acquisition and measurement way. If two statistical files are created, one consisting of men and the second consisting of women, and they will be analyzed each one separately, then one set consists of twelve speakers demonstrating seven different emotions and each emotion is represented by 96 recordings, except neutral which is represented by 48 recordings. It is clear, from these numbers, that one speaker had to show one emotion more times, what indicates dependence of the samples. However, the specific case of emotion observed is a unique combination of several conditions under that it was recorded into the .wav file - the speaker, the sentence that he says, the degree of his/her expression (normal and strong expression) and the repetition (even if the speaker tries to repeat the same sentence with the same expression, the measured values of the characteristics won’t be the same). It is also necessary to consider the goal of the analysis: the characteristics are measured for a small group of recordings that is available, with the aim to find any pattern (degree of variance between groups). This will be the starting point for generalization of different people in different conditions or in different languages that will be tested.
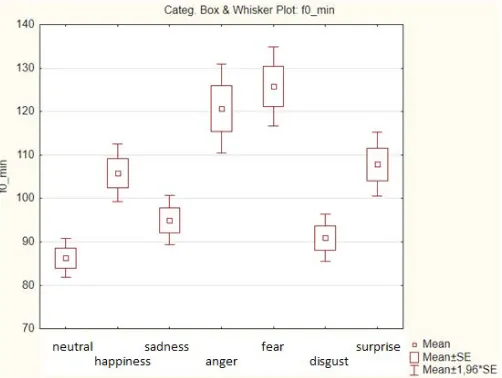
Random selection also supports independence - randomly were chosen about 73% of the recordings of each emotion - 35 recordings of neutral emotion and 70 recordings of each of other emotions. Another problem occurs when the condition of equality of variances, as shown in Fig. 3, it is not always fulfilled, as was confirmed by the Leven
test. This problem can be solved by using Welch’s corrected ANOVA analysis that does not require equality of variances.
Fig. 3. Example - condition of equality of variances of characteristics f0_min
is not fulfilled.
The last condition, which is also not always met, is the normal distribution of variables, but the robustness of the ANOVA test allows to bypass this condition by using a sufficiently large statistical set.
The analysis was performed using the STATISTICA tool and the characteristics were sorted according to the Welch’s F from the largest to the smallest value. Of the 40 characteristics, have been selected 15 best rated men and women. It has been selected the 15 best rated features for men and women from 40 features. The features selected for men were:
f1_min, f1_max, f1_range, f1_median, f1_q1, f1_q3, f1_variance. intensity_min, intensity_max, intensity_range, intensity_median, i1_q1, i1_q3, i1_variance. jitter_ppq5, jitter_ddp, shimmer_apq5, shimmer_ddp.
The assumption that the selected features will vary depending on gender was satisfied - nine of them are identical, but on a different position in sorted lists mentioned above.
Explanation of characteristics:
F0: values are measured in Hertz.
• f0_min –the minimum F0 value of the voice recording, • f0_max – the maximum F0 value of the voice recording, • f0_range – differences between maximum and minimum,
• f0_median – the median of the F0 values,
• f0_q1 – the value of the first quartile of the F0 values,
• f0_q3 – the value of the third quartile of the F0 values, • f0_variance – the standard deviation F0,
• f0_slope – absolute value of average slope F0.
Formants F1, F2, F3: values are measured in Hertz. For second and third formants the same characteristics are measured.
• f1_min – the minimum value of the first formant, • f1_max – the maximum value of the first formant,
• f1_range – differences between maximum and minimum of the first formant,
• f1_median – the median of the values of the first formant,
• f1_q3 – the value of the third quartile of the values of the first formant,
• f1_variance – the standard deviation.
Intensity: values are measured in decibels. • intensity_min – minimum value of intensity,
• intensity_max – maximum value of intensity,
• intensity_range – r differences between maximum and minimum value of intensity,
• intensity_median – the median of intensity values, • i1_q1 – the value of the first quartile of intensity,
• i1_q3 – the value of the third quartile intensity, • i1_variance – standard deviation of intensity.
Jitter: values are measured as a percentage.
• jitter_ppq5 – five-point PPQ (periodic perturbation quotient), the mean absolute value of the difference of the period and its average, and its four closest neighbors, divided by the average length of the period,
• jitter_ddp – the mean absolute value of the difference between successive values divided by the average period.
Shimmer: values are measured as a percentage.
• shimmer_apq5 – five-point APQ (amplitude perturbation quotient), the mean absolute value of the difference of the period of amplitude and average of this amplitude, and its four closest neighbors, divided by the average of amplitude, • shimmer_ddp – the average absolute value of difference
between successive amplitudes.
C. EmoRec
The application EmoRec was written using the programming language C# in order to further process of PRAAT program outputs and evaluate the unrecognized emotions. EmoRec is WPF application with graphical interface and was created in Microsoft Visual Studio Community 2017. The program uses .NET Framework 4.7. The application works in two modes - learning mode and recognition mode of unknown emotions.
Fig.4. EmoRec – learning mode.
The learning mode (see Fig. 4) creates a database from the cases in which the values of the features have been determined for the known emotion. This mode requires a .txt input file where the first line contains a single letter - the gender abbreviation. The abbreviation (“Z” for women and “M” for men) is obligatory because EmoRec creates a database separately for men and women. So, later during emotions determining
it is not necessary to find out whether the line contains a record of a woman or of a man. The remaining rows contain name of the emotion and specific numerical values of fifteen features that have reached the best F value in ANOVA analysis. When creating a database, it is possible to attach the lines into an existing database or overwrite an existing one. If the database does not exist, it will be created. When inserting a .txt file, the integrity check will be performed first and the database will be recorded only if the input file has the required structure.
The recognition mode of unknown emotions assumes as input a similar .txt file - the first line contains the gender abbreviation, the other lines contain name of the original .wav file and the measured numerical values of the attributes. Similarly, the integrity check will be performed. In this tab, it is also possible to set the type of test to be performed and the tolerance.
D. Emotion Determination Algorithm (K-NN)
EmoRec will select a male or a female database according to the first line of the input file. Then the program sequentially reads the rows from the input file and values of the attributes of unknown emotions compares by using a certain degree of tolerance with the values stored in the database. Sequentially, one row of the input file is compared with all rows in the database.
If the program finds a value in the database that matches the value of the unknown emotion within the tolerance, it increases the emotion evaluation value that is in the corresponding row of the database. At the end, the unknown emotion will be determined as the emotion with the largest evaluation value. Then the program works with the next lines of the input file. The result is exported to a .txt file with the .wav filenames and corresponding emotions.
In the principle was used the K-NN algorithm. This algorithm locates the case in the property space and compares it with the k-nearest neighbors, which are the samples of training dataset. Then the same tag is assigned to the property of the same class if it is a known neighbor. The result of ranking is decided by a majority of k-nearest neighbors.
The type of the test determines how many attributes will be compared. The 5-test means the comparison of the best five attributes, the 10-test compares the best features and the 15-test compares all the characteristics. The tolerance coefficient determines how much the value in a database can differ from the value from input file so that the result was evaluated as a match. In the program, it is possible to set the tolerance onto 1%, 3%, and 5%.
V. Experiment 1 - Results of the Tests with Different
Databases
Three different databases were selected to test the application. The data for the known case database for EmoRec was obtained using the measure_characteristics.praat script and the RefactorForRAVDESS program from the same part of the RAVDESS database which was also used for the features selection. Each of the databases fulfilled its role in testing. The RAVDESS database was used to test reliability in identifying the unknown emotions of the same speakers on which the program was trained, SAVEE database tested the reliability in case of testing the files with worse audio quality, noise and unwanted sounds and EMO-DB database was used to test files that were recorded in another language.
TABLE I. Example of EMO-REC Program Results
Supposed emotion
(%) Ne Ha Sa An Fe Di Su
exchange
Detected emotion
Ne 23.07 0.00 7.69 0.00 0.00 7.69 0.00 2.56
Ha 7.69 19.23 15.38 15.38 23.07 7.69 11.53 13.46
Sa 15.38 11.53 15.38 7.69 3.84 23.07 11.53 12.17
An 7.69 26.92 15.38 19.23 19.23 15.38 11.53 16.02
Fe 0.00 3.84 7.69 23.07 34.61 3.84 0.00 6.41
Di 46.15 23.07 26.92 19.23 0.00 30.76 3.84 19.87
Su 0.00 15.38 11.53 15.38 19.23 11.53 61.53 12.18
Success 29.12
On the diagonal of the table (see Table I) it is possible to see percentages of the cases in which the emotion was determined correctly. It can be deduced from the columns percentage of the cases that emotion was exchanged by another emotion (the emotion was determined incorrectly). For example, sadness was determined to be neutral emotion in 7.69% of cases. The sum of values in each column of predicted emotions is 100%. Column Exchange shows how often in average the emotion was exchanged by another one. The disgust was incorrectly determined instead of any of another emotions averaged in 19.87% of cases. Success rate is an average of diagonal values and represents the overall average of success determinations of this test for this group.
A. RAVDESS Database
For the testing were used 27% data of the database that were not previously used to attributes selecting and creating of database of known cases for EmoRec. The smallest success rate of emotions determination was reached by neutral emotion. This emotion was almost never correctly determined, even if testing by this database achieved the best results among all three testing’s. The explanation of this problem is that at such a low tolerance (5%), neutral emotional state is often changed with the emotional state - calmness. This is a problem, because then it is not possible to use Ekman’s classification but the Russell model.
Testing of men reached an average success rate from 25.81% to 35.71% and testing of women reached an average success rate from 21.98% to 34.64%. For both, men and women, the best result was achieved by the 15-test with 5% tolerance (see Table II, Table III). The best-determined emotion for men in this test was anger in 61.53% of cases, followed by happiness in 53.84% of cases and disgust in 46.15% of cases. The worst-determined emotions were fear and surprise, both were correctly determined in 26.92% of cases. Neutral emotion in this test was never correctly determined, most often it was classified as sadness. Surprise and sadness were incorrectly determined as happiness, surprise in 34.61% of cases and sadness in 30.76% of cases.
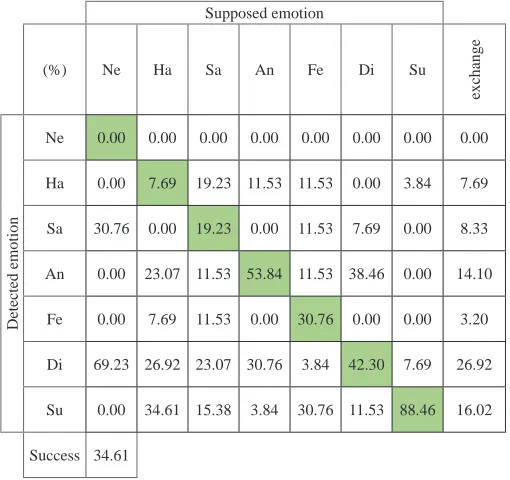
Whilst for men it was the surprise classified correctly only in a few cases, the results for women were totally the opposite, the surprise was correctly classified in 88.46% of cases. The success rate for next two emotions was a bit lower. The anger was correctly classified in 53.84% of cases and the disgust in 42.30% of cases. Neutral emotion
was classified as disgust in 69.23% of cases. The happiness was correctly classified only in 7.69% of cases. The disgust and the anger were exchanged between each other. The fear and the happiness were often classified as a surprise (see Table III).
TABLE II. RAVDESS – The 15-Test with 5 Percent Tolerance, Men
Supposed emotion
(%) Ne Ha Sa An Fe Di Su
exchange
Detected emotion
Ne 0.00 0.00 0.00 0.00 0.00 0.00 0.00 0.00
Ha 7.69 53.84 30.76 15.38 19.23 0.00 34.61 17.95
Sa 46.15 7.69 34.61 0.00 19.23 26.92 3.84 17.31
An 23.07 19.23 19.23 61.53 26.92 26.92 23.07 23.07
Fe 0.00 3.84 3.84 0.00 26.92 0.00 11.53 3.20
Di 0.00 0.00 7.69 19.23 0.00 46.15 0.00 4.49
Su 23.07 11.53 3.84 3.84 7.69 0.00 26.92 8.33
Success 35.71
TABLE III. RAVDESS – The 15-Test with 5 Percent Tolerance, Women
Supposed emotion
(%) Ne Ha Sa An Fe Di Su
exchange
Detected emotion
Ne 0.00 0.00 0.00 0.00 0.00 0.00 0.00 0.00
Ha 0.00 7.69 19.23 11.53 11.53 0.00 3.84 7.69
Sa 30.76 0.00 19.23 0.00 11.53 7.69 0.00 8.33
An 0.00 23.07 11.53 53.84 11.53 38.46 0.00 14.10
Fe 0.00 7.69 11.53 0.00 30.76 0.00 0.00 3.20
Di 69.23 26.92 23.07 30.76 3.84 42.30 7.69 26.92
Su 0.00 34.61 15.38 3.84 30.76 11.53 88.46 16.02
Success 34.61
B. SAVEE Database
should play audio files, visual files and audio-visual files, and assign one emotion to each file. In the case of sound files these people were able to determine emotions correctly on average in 66.5% of cases, in visual files cases in 88.0% and in combination of sound and visual aspect case in 91.8% of cases. In case of sound recordings the disgust was most often classified instead of neutral emotion and the fear was determined instead of the sadness and the surprise. The happiness and the surprise were exchanged between each other.
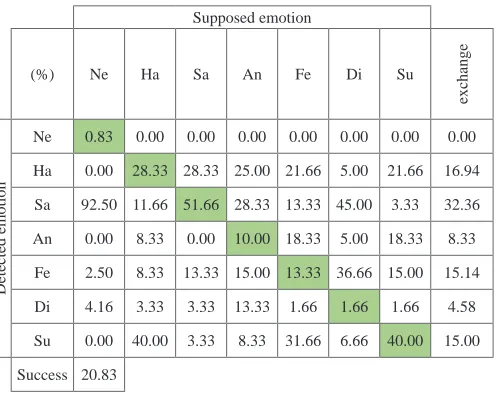
The created application with this database has achieved significantly worse results than with the database RAVDESS. The average success rate ranged from 17.38% to 20.83%. The best result was achieved in the 5-test with 5% tolerance (see Table IV), the sadness was correctly determined in 51.66% of cases and the surprise in 40% of cases but disgust was correctly classified only in 1.66% of cases - this emotion was mostly incorrectly determined as the sadness and the fear. The worst result was reached for the neutral emotion which was determined as the sadness in 92.5% of cases. The happiness was classified as the surprise in 40% of the cases, while the surprise was in 21.66% of cases determined as the happiness and this is the similarity with the subjective evaluation conducted by the University of Surrey.
TABLE IV. SAVEE – Evaluation of the 5-Test with 5% Tolerance
Supposed emotion
(%) Ne Ha Sa An Fe Di Su
exchange
Detected emotion
Ne 0.83 0.00 0.00 0.00 0.00 0.00 0.00 0.00
Ha 0.00 28.33 28.33 25.00 21.66 5.00 21.66 16.94
Sa 92.50 11.66 51.66 28.33 13.33 45.00 3.33 32.36
An 0.00 8.33 0.00 10.00 18.33 5.00 18.33 8.33
Fe 2.50 8.33 13.33 15.00 13.33 36.66 15.00 15.14
Di 4.16 3.33 3.33 13.33 1.66 1.66 1.66 4.58
Su 0.00 40.00 3.33 8.33 31.66 6.66 40.00 15.00
Success 20.83
C. EMO-DB Database
The EMO-DB or otherwise Berlin Database of Emotional Speech was recorded in 1997 and 1999 at the Technical University of Berlin. As well as the previous two databases, this database is also included among simulated databases. It was recorded by five men and five women. The database contains neutral emotion, anger, disgust, fear, happiness, sadness and boredom.
The created application was tested with this database mostly because of the reason that the emotion recognition ideally should not be influenced by the spoken language, and this database is recorded in German language that is significantly different from English. Another special feature of this database is that it does not contain emotion surprise and contains emotion boredom. During testing, we skipped the files with the emotion boredom because the created application was not able to recognize this emotion and this emotion would always be misclassified as one of the Ekman’s basic emotions.
Even this database did not match the best result reached with the RAVDESS database. As well as with the previous two databases, almost no neutral emotion was classified at all but there occurred several interesting phenomena. After evaluating the tests performed by men group it was found out that: in the 5-test with 3% tolerance the best- classified emotions were the happiness in 40.74% of cases,
sadness in 48% of cases and the anger in 36.66% of cases. Disgust and sadness were exchanged between each other, anger was classified in many cases as the happiness or the surprise (see Table V).
In the 10-test and in the 15-test the success rate of the anger and the disgust determining began to increase rapidly, while other emotions were correctly classified only in very few cases and were exchanged with two mentioned emotions. This means that the anger and the disgust are very well distinguishable between each other, but the other emotions aren’t at all. In the 15-test the anger was correctly determined in 86.66% of cases and the disgust was determined with 100% success rate (see Table VI).
TABLE V. EMO-DB – Evaluation of the 5-Test with 3 Percent Tolerance, Men
Supposed emotion
(%) Ne Ha Sa An Fe Di Su
exchange
Detected emotion
Ne 0.00 0.00 0.00 0.00 0.00 0.00 0.00 0.00
Ha 7.69 40.74 0.00 25.00 25.00 0.00 11.54 11.54
Sa 64.10 3.70 48.00 0.00 19.44 63.63 30.17 30.17
An 2.56 11.11 8.00 36.66 13.88 0.00 7.11 7.11
Fe 2.56 7.40 0.00 5.00 16.66 18.18 6.63 6.63
Di 23.07 11.11 44.00 1.66 13.88 18.18 18.74 18.74
Su 0.00 25.92 0.00 31.66 11.11 0.00 11.45 11.45
Success 24.53
TABLE VI. EMO-DB - Evaluation of the 15-Test with 5 Percent Tolerance, Men
Supposed emotion
(%) Ne Ha Sa An Fe Di Su
exchange
Detected emotion
Ne 0.00 0.00 0.00 0.00 0.00 0.00 0.00 0.00
Ha 2.56 0.00 0.00 0.00 2.77 0.00 1.07 1.07
Sa 12.82 0.00 4.00 0.00 5.55 0.00 3.67 3.67
An 30.76 70.37 32.00 86.66 47.22 0.00 36.07 36.07
Fe 2.56 3.70 4.00 0.00 11.11 0.00 2.05 2.05
Di 51.28 25.92 60.00 13.33 30.55 100.00 36.22 36.22
Su 0.00 0.00 0.00 0.00 2.77 0.00 0.46 0.46
Success 28.89
TABLE VII. EMO-DB – Evaluation of 15-Test with 5 Percent Tolerance, Women
Supposed emotion
(%) Ne Ha Sa An Fe Di Su
exchange
Detected emotion
Ne 0.00 0.00 0.00 0.00 0.00 0.00 0.00 0.00
Ha 0.00 4.54 13.51 7.46 6.06 5.71 6.55 6.55
Sa 10.00 2.27 2.70 0.00 0.00 5.71 3.60 3.60
An 15.00 63.63 35.13 65.67 39.39 31.42 36.91 36.91
Fe 2.50 4.54 2.70 5.97 15.15 0.00 3.14 3.14
Di 72.50 13.63 29.72 5.97 30.30 54.28 30.42 30.42
Su 0.00 11.36 16.21 14.92 9.09 2.85 9.07 9.07
Success 21.63
VI. Discussion of the Experiment 1
The experiments were performed as the 5-test, the 10-test and the 15-test combined with 1%, 3% and 5% tolerance with each database for both genders (except the SAVEE database that does not include women’s records), together were realized 45 tests. EmoRec did not achieve good results in the tests, its average success rate of all tests was in 24.58% of cases. In all tests, neutral emotion was determined as the worst. It was most often classified as the sadness in case of RAVDESS and SAVEE databases and as the disgust in case of EMO-DB. On average, neutral emotion was correctly determined only in 2.92% of cases. Exchange with the sadness may be caused by the fact that the sadness is characterized by low intensity and monotony. On the contrary, the anger was classified as the best, in 40.45% of cases, and the disgust in 39.31% of cases. These two emotions often achieved over 50% success rate in the individual tests but in the case of EMO-DB they were incorrectly determined as the other emotions. According to the emotion determination success rate are these two emotions followed by these ones: the surprise in 34.74% of cases, the sadness in 22.64% of cases, the happiness in 18.91% of cases and the fear in 17.82% of cases.
The average success rate was negatively influenced by the low success rate of neutral emotion determination and by the low success rate of the tests with SAVEE database which is recorded in significantly lower quality. An interesting situation occurred during testing with EMO-DB in German language when only two emotions were very well distinguishable. This phenomenon could be caused by the difference of the German language from English. The best results were achieved with the same database as the program was trained for. The results could be also affected by a various number of samples, for example, EMO-DB contains only 11 recordings of the disgust emotion for men but 35 for women.
It is necessary to remark that success rate in real conditions would probably be even lower because all three databases that were tested, the EmoRec was recorded by actors, so it was simulated. The problem of real-life recordings is their gathering, the presence of background noise and the fact that people often do not show emotions openly and with full intensity - they tend to hide their real emotional state.
Considering the reached low success rate, it is requisite to classify the critical parts in the solution process that could be improved.
VII.
Experiment 2 – Use of Neural Networks and
Testing the Databases
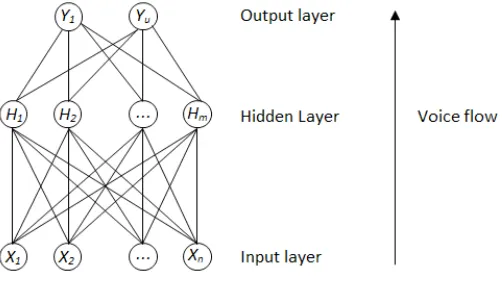
From the results of Experiment 1, we can see that using the K-NN algorithm we has obtain a very low overall success rate of recognition of the emotional state. The classifier is considered successful if the overall average recognition rate is more than 80%. For this reason, we decided to change the algorithm used and use a different type of classifier. In present existing lot number of classifiers that are successfully used in recognition process (for example, in face detection and subsequent classification of the emotional state). Most often they are Hidden Markov Model (HMM), Naive Bayes classifier, Neural Nets or Support Vector Machine.
In the voice recognition and the classification of emotional state we can used all these classifiers. However in contrast to HMMs, Neural Nets create no premise about feature statistical properties and therefore where used as recognition models with high successful rate in emotion classification process for speech recognition.
For this reason, we decided to use to increase the overall success of classification phase the Artificial Neural Network. The voice flow (Fig. 5) that is representing as input data is a matrix of the features extracted from the speech inputs. The output data represent the emotional states. The percentage of input data represent the 7 various categories of Ekman classification for neural nets training. These data is validate and test chosen randomly. The training dataset find the optimal weights for each feature and the validation dataset debug the parameters of a classifier. The final model of neural net is tested using test set for estimation of the error rate.
Fig. 5. Example of typical Artificial Neural Network.
To create of this network, we used a verified algorithm from Luigi Rosa (http://www.advancedsourcecode.com/neuralspeech.asp). This algorithm was written for Matlab. The test set verifies the final model and estimates the error rate. The default value for training set is 90% (the required quality) and 10 % is for error rate. We use in initially the default values but in next step the concrete count of hidden layers is chosen. The rule is: the more layers, the better the result. But to other side this rule complicated the system - we must the network trained several times.
We repeated the experiment with the same input conditions (same tests with the same tolerance). In case of the 15-Test with 5% tolerance, we achieved a total success rate of 93.26% for men. The exchange between individual emotional states was not as major when as using the K-NN algorithm (see Table VIII). Here we have achieved a total success rate of 94.66%. The exchange was in interval from 0.00-1.48.
TABLE VIII. RAVDESS – Evaluation of 15-Test with 5 Percent Tolerance, Women
Supposed emotion
(%) Ne Ha Sa An Fe Di Su
exchange
Detected emotion (Men)
Ne 95.34 0.00 0.00 0.00 0.00 0.00 0.00 0.00
Ha 0.12 89.84 0.89 3.21 5.32 0.12 0.26 1.65
Sa 3.21 5.63 91.16 0.00 3.19 0.95 1.28 2.38
An 0.56 1.27 1.62 95.41 2.34 1.12 0.14 1.16
Fe 0.00 1.41 1.32 0.00 87.89 2.31 0.36 0.90
Di 0.21 0.53 2.37 0.17 0.28 95.23 0.00 0.59
Su 0.56 1.32 2.64 1.21 0.98 0.27 97.96 1.16
Success 93.26
Detected emotion (W
omen)
Ne 96.12 0 0 0 0 0 0 0.00
Ha 0.23 93.45 0.21 2.32 2.38 0 1.6 1.12
Sa 0.35 3.28 98.25 1.42 3.01 0.21 0.63 1.48
An 1.27 1.29 0.91 94.23 1.28 0.62 0 0.82
Fe 0.61 1.01 0.14 1.17 91.41 1.14 0 0.68
Di 0.12 0.56 0.17 0.25 1.04 97.14 5.74 1.31
Su 1.3 0.41 0.32 0.61 0.88 0.89 92.03 0.74
Success 94.66
TABLE IX. SAVEE – Evaluation of 15-Test with 5 Percent Tolerance, Women
Supposed emotion
(%) Ne Ha Sa An Fe Di Su
exchange
Detected emotion
Ne 91.25 0 0 0 0 0 0 0.00
Ha 2.18 94.62 2.87 1.23 3.66 2.32 1.75 2.34
Sa 1.35 1.37 93.24 0.23 1.01 0.41 0.11 0.75
An 1.37 0.84 1.25 95.17 0.98 0.37 0.14 0.82
Fe 1.05 1.25 0.33 1.53 92.14 0.14 0.13 0.74
Di 1.97 1.35 1.21 0.98 1.24 96.41 0.52 1.21
Su 0.92 0.57 1.1 0.86 0.97 0.35 97.35 0.80
Success 94.31
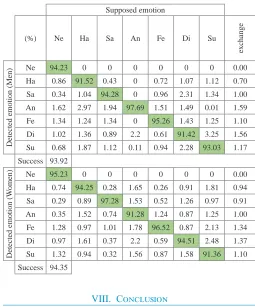
The similar results have been obtained also when we used the EMO-DB database. However, we only show results from the 15-Test with 5% tolerance (see Table X).
The K-NN algorithm in classification phase calculates on the basis at the nearest neighbour’s (limit values). This algorithm can be used successfully for facial detection and subsequent classification. The algorithm recognize only a very high limit value, therefore algorithm does not work properly. However our goal was to classify emotional states that can be easily changed (for example, happiness and surprise).
Therefore, the results of experiment 1 obtained very low success rate. In Experiment 2, Neural Networks have proven to be an appropriate means to increase overall success.
TABLE X. EMO-DB – The 15-Test with 5 Percent Tolerance, Men and Women
Supposed emotion
(%) Ne Ha Sa An Fe Di Su
exchange
Detected emotion (Men)
Ne 94.23 0 0 0 0 0 0 0.00
Ha 0.86 91.52 0.43 0 0.72 1.07 1.12 0.70
Sa 0.34 1.04 94.28 0 0.96 2.31 1.34 1.00
An 1.62 2.97 1.94 97.69 1.51 1.49 0.01 1.59
Fe 1.34 1.24 1.34 0 95.26 1.43 1.25 1.10
Di 1.02 1.36 0.89 2.2 0.61 91.42 3.25 1.56
Su 0.68 1.87 1.12 0.11 0.94 2.28 93.03 1.17
Success 93.92
Detected emotion (W
omen)
Ne 95.23 0 0 0 0 0 0 0.00
Ha 0.74 94.25 0.28 1.65 0.26 0.91 1.81 0.94
Sa 0.29 0.89 97.28 1.53 0.52 1.26 0.97 0.91
An 0.35 1.52 0.74 91.28 1.24 0.87 1.25 1.00
Fe 1.28 0.97 1.01 1.78 96.52 0.87 2.13 1.34
Di 0.97 1.61 0.37 2.2 0.59 94.51 2.48 1.37
Su 1.32 0.94 0.32 1.56 0.87 1.58 91.36 1.10
Success 94.35
VIII.
Conclusion
The emotions determining from the user’s voice is a complex issue and its solution used to be ambiguous and complicated. Different people have different voices and the creation of general rules for emotions determining is not elementary. The best results in this area are achieved by neural networks and the systems that combine the emotions determining from voice, from facial expression and other biometrics. Although the purpose of the current researches focused on emotions determining methods is to find the best one, it is clear that this area will have huge potential of being used in the future. Number of emotions models which define various emotions contribute to the complexity of this problem solution. In principle, the more emotions are trying to recognize, the harder it is to achieve high success rate of classification.
In this paper it was attempted to propose and implement solution novel approach that has been tested under various conditions. The voice recordings were analyzed, and selected the most appropriate attributes. A novel application was created that is able to determine the emotions from voice. Using neural networks, the overall success rate was about 94%, which can be considered a very good result. The greatest challenge for the future remains the creation of a system that will be able to determine the emotions reliably in real time and in real situations under not always suitable conditions for proper measurement and the evaluation of the attributes.
References
[2] Baron-Cohen, S. “The Eyes as Window to the Mind.” American Journal of Psychiatry, vol. 174, no. 1, pp. 1-2, 2017, doi:10.1176/appi. ajp.2016.16101188.
[3] Busso, C., S. Parthasarathy, A. Burmania, M. Abdelwahab, N. Sadoughi, and E. M. Provost. “MSP-IMPROV: An Acted Corpus of Dyadic Interactions to Study Emotion Perception.” IEEE Transactions on Affective Computing, vol. 8, no. 1, pp. 67-80, 2017.
[4] Cowie, R. “The enduring basis of emotional episodes: Towards a capacious overview”, 2015 International Conference on Affective Computing and Intelligent Interaction, ACII 2015, pp. 98. 2015. doi:10.1109/ ACII.2015.7344557.
[5] Damasio, A. R. “Descartes’ error: emotion, reason, and the human brain. “ New York : Avon Books, 1994.
[6] Davletcharova, A., et al. “Detection and Analysis of Emotion from Speech Signal.”Procedia Computer Science, vol. 58, pp. 91-96, 2015, doi:10.1016/j.procs.2015.08.032.
[7] Duffy, E. “An Explanation of “emotional” Phenomena without the use of the Concept emotion.” Journal of General Psychology, vol. 25, no. 2, pp. 283-293, 1941.
[8] Ekman, P. “What Scientists Who Study Emotion Agree about.”
Perspectives on Psychological Science, vol. 11, no. 1, pp. 31-34, 2016, doi:10.1177/1745691615596992.
[9] Ekman, P. “Respect in a Pinch.” Science, vol. 337, no. 6099, pp. 1173. 2012. doi:10.1126/science.337.6099.1173.
[10] Haq, S., T. Jan, M. Asif, A. Ali, and N. Ahmad. “Speaker-Dependent Human Emotion Recognition in Unimodal and Bimodal Scenarios.”
Proceedings of the Pakistan Academy of Sciences, vol. 52, no. 1, pp. 15-25, 2015.
[11] Karadogan S. and Larsen J. “Combining Semantic and Acoustic Features for Valence and Arousal Recognition in Speech.” in Proceedings of IEEE 3rd International Workshop on: Cognitive Information Processing, Baiona, pp. 1-6, 2012.
[12] Koolagudi, S. G., Y. V. S. Murthy, and S. P. Bhaskar. “Choice of a Classifier, Based on Properties of a Dataset: Case Study-Speech Emotion Recognition.” International Journal of Speech Technology, vol. 21, no. 1, pp. 167-183, 2018, doi: 10.1007/s10772-018-9495-8.
[13] Kragel, P. A., et al. “Decoding Spontaneous Emotional States in the Human Brain.” PLoS Biology, vol. 14, no. 9, 2016, doi:10.1371/journal. pbio.2000106.
[14] Lövheim, H. “A New Three-Dimensional Model for Emotions and
Monoamine Neurotransmitters.” Medical Hypotheses, vol. 78, no. 2, 2012, pp. 341-348.
[15] Perlman, M. and G. Lupyan. “People can Create Iconic Vocalizations to Communicate various Meanings to Naïve Listeners.” Scientific Reports
vol. 8, no. 1, 2018, doi: 10.1038/s41598-018-20961-6.
[16] Revathi, A., N. Sasikaladevi, R. Nagakrishnan, and C. Jeyalakshmi. “Robust Emotion Recognition from Speech: Gamma Tone Features and Models.” International Journal of Speech Technology, 2018, doi:10.1007/ s10772-018-9546-1.
[17] Sharar, S. R., A. Alamdari, C. Hoffer, H. G. Hoffman, M. P. Jensen, and D. R. Patterson.. “Circumplex Model of Affect: A Measure of Pleasure and Arousal during Virtual Reality Distraction Analgesia.” Games for Health Journal, vol. 5, no. 3, pp. 197-202, 2016, doi:10.1089/g4h.2015.0046.
[18] Shi, Y., K. A. Peng, B. Chen, Y. Gong, J. Chen, Y. Li, and Q. -J Fu. “Interaction between Speech Variations and Background Noise on Speech Intelligibility by Mandarin-Speaking Cochlear Implant Patients.”
Speech Communication, vol. 104, no. 89-94, 2018, doi:10.1016/j. specom.2018.09.007.
[19] Smith, J., A. Tsiartas, V. Wagner, E. Shriberg, and N. Bassiou. 2018. “Crowdsourcing Emotional Speech”. ICASSP, IEEE international conference on acoustics, speech and signal processing – proceedings. 5139 p. 2018. doi:10.1109/ICASSP.2018.8462224.
[20] Swain, M., A. Routray, and P. Kabisatpathy. “Databases, Features and Classifiers for Speech Emotion Recognition: A Review.” International Journal of Speech Technology, vol. 21, no. 1, pp. 93-120, 2018, doi: 10.1007/s10772-018-9491-z.
[21] Trabelsi, I., D. B. Ayed, and N. Ellouze. “Evaluation of Influence of Arousal-Valence Primitives on Speech Emotion Recognition.”
International Arab Journal of Information Technology, vol. 15, no. 4, 2018, pp. 756-762.
[22] Truesdale, D. M. and M. D. Pell. “The Sound of Passion and Indifference.”
Speech Communication, vol. 99, pp. 124-134. 2018, doi:10.1016/j. specom.2018.03.007.
[23] Uribe, A., A. Gómez, M. Bastidas, O. L. Quintero, and D. Campo. “A Novel Emotion Recognition Technique from Voiced-Speech.” Paper presented at the 2017 IEEE 3rd Colombian Conference on Automatic Control, CCAC 2017 - Conference Proceedings. 2017. doi:10.1109/CCAC.2017.8276451.
M. Magdin
He works as a professor assistant at the Department of Computer Science. He deals with the theory of teaching informatics subjects, mainly implementation interactivity elements in e-learning courses, face detection and emotion recognition using a webcam. He participates in the projects aimed at the usage of new competencies in teaching and also in the projects dealing with learning in virtual environment using e-learning courses.
T. Sulka
He graduated bachelor's degree in Applied Informatics.
His research area is speech analysis, identification and classification of emotional state from speech.
J. Tomanová
She works as a professor assistant at the Department of
Computer Science. Her research area is the field of formal
languages theory and automats, computer graphics and problems of computational complexity of algorithms.
M. Vozár
![Fig. 1. Arousal-valence dimensional approach [2]](https://thumb-us.123doks.com/thumbv2/123dok_us/9703495.1953542/2.612.60.283.184.345/fig-arousal-valence-dimensional-approach.webp)