Cablegation: IV. The Bypass Method and Cutoff
Outlets to Improve Water Distribution
Dennis C. Kincaid, W. D. Kemper
MEMBER MEMBER
AS AE ASAE
ABSTRACT
T
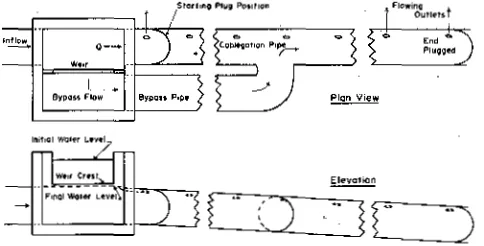
WO techniques of improving the water distribution characteristics of cablegation systems are proposed and evaluated. The bypass method, which largely eliminates the problem of end effects, involves starting the plug at the first outlet and initially bypassing most of the flow to the downstream end of the pipeline, which is plugged. As the plug moves down the pipe, the bypass flow gradually decreases to zero. This method nearly equalizes the inflow distribution to all furrows and allows the use of a constant outlet opening size. The bypass can be accomplished by using a parallel bypass pipe and weir, or with a flow-through bypass plug. The bypass plug appears to be the lower cost method and is as effective as the weir in controlling the bypass.
The second technique deals with the low outlet flows during the final stages of a "set" which are insufficient to reach the end of the furrows such that excess water is applied to the upper ends of the furrows. Two types of cutoff outlets, a gravity valve and a siphon type outlet were designed to abruptly cut off the flow at about the same time that runoff ceases, thus maximizing the uniformity of infiltration. The cutoff outlets are recommended for soils having relatively high sustained intake rates.
INTRODUCTION
A low cost method of automating surface irrigation utilizing a single pipe for conveyance and distribution was first described by Kemper et al. (1981) in the first paper of this series. The sysem is called "cablegation" because it uses a cable-controlled plug moving through a "gated" pipe to continuously move an irrigation set across a field. The pipe is installed on a slope, and the gates or outlets sized to deliver the water to the furrows at the approximate desired stream sizes.
An inherent characteristic of this system is that the flow to each furrow begins at a maximum rate and gradually decreases with time to zero. This gradual "cutback" inflow rate has an effect on the furrow advance rates and infiltration distribution unlike other systems. Because of the hydraulic complexity of the system a computer model was developed to evaluate the system and to enable design simulations to be made. The system hydraulics, and the simulation model were described along with designs for several field situations in a second paper (Kincaid and Kemper, 1982). The major input variables used in the model are total flow
Article was submitted for publication in January, 1983; reviewed and approved for publication by the Soil and Water Div. of ASAE in December, 1983.
Contribution from the USDA-ARS.
The authors are: DENNIS C. KINCAID, Agricultural Engineer, and W. a KEMPER, Supervisory Soil Scientist, Snake River Conservation Research Center, Kimberly, ID.
rate, pipe size, pipe slope(s), plug travel speed(s), outlet spacing(s), furrow spacing, furrow length(s), plug travel speed(s), and parameters for a time-based infiltration function. The model predicts inflow rates to each furrow and predicts the final distribution of infiltrated water over the field. Various design options and modes of operation can be tested before a system is installed.
Variability of inflow and infiltration rates, measured water distribution, and other data from the first field system were presented in the third paper in the series (Goel et al., 1982). The effect of deviations from designed pipe slope on inflow rates were also evaluated. The reader is referred to the previous papers for detailed descriptions of the system, its performance and the development of the simulation model which is used in this paper.
Two potential problems became apparent when attempting to obtain uniform application with this system. First, the problem of obtaining adequate irrigation for the furrows near the inlet and distal ends of the gated pipe line. Kincaid and Kemper (1982) discussed this problem extensively. Secondly, since the furrow inflow rate gradually approaches zero, runoff ceases at some point and the wetting front "backs up". The remainder of the inflow is applied as excess water to the upper ends of the furrows. (Fig. 11 shows hydrographs illustrating this effect). This paper addresses these problems and provides methods to improve water distribution with the cablegation system. The analysis will be limited to rectangular fields and constant pipe slope, although the methods could be applied to all cablegation systems.
The main objective of this paper is to present and discuss hydraulic concepts. The mechanical aspects are developed only far enough to support the hydraulic analysis.
BYPASS METHOD
Water must flow in a furrow for a minimum length of time to obtain the desired average depth of intake. This presents a problem when initiating an irrigation. With constant inflow, the plug must be started some distance down the pipe, and held stationary for an initial set time before its travel begins. This results in a shorter "set" time for the first few furrows than for those farther downstream. Kincaid and Kemper (1982) compensated for shorter set times by using larger outlets which increase the stream sizes. The larger streams give more rapid advance and increased overall intake. The problem can be eliminated by starting the plug at the first outlet and using a variable inflow rate which increases in relation to the number of outlets passed by the plug.
Sterlinw Plug P.M°. Flowina Outietsii
End Plugged
Plan View
last few furrows. Furrows in the upstream portion of this last "set" receive water for longer than average times. Again, the outlet sizes can be varied to partially compensate for the unequal set times. Alternatively, the total flow rate can be gradually decreased as if the flow were being progressively transferred to another cablegation system.
Dealing with the upper and lower end effects separately has led to complications in design and operation of cablegation systems. The problem at the lower end is the inverse of that at the upper end. However, by combining the end effects they can largely be eliminated. For rectangular fields with uniform pipe slope, the following "bypass" technique allows the use of uniform outlet size and constant inflow rate. The technique involves starting the plug at the first outlet and initially bypassing most of the flow to the downstream end of the pipe, which is plugged. The bypass flow is distributed at the lower end. As the plug moves down the pipe, the bypass flow gradually decreases until all of the flow is distributed behind the moving plug and flow from the first orifice has stopped. As the plug approaches the lower end, the previously wetted furrows will receive a second flow of water distributed in the same manner as in the upper furrows. When the plug reaches the end of the pipe, the irrigation is complete. Two methods have been developed to control the bypass in a desired manner — the bypass weir and the bypass plug.
Bypass Pipe and Weir
A method of bypassing part of the flow through a
parallel pipe which connects back into the main pipe at
or beyond the distance the plug has moved when the flow at the first outlet stops is shown schematically in Fig. 1. The bypass pipe must usually be as large as the main pipe in order to carry nearly all of the flow initially. The bypass flow rate is controlled by an overflow weir. The bypass flow is diverted upstream from the first outlet. In order to eliminate the upstream end effect, the bypass flow should be controlled such that the piezometric head at the plug remains constant.
The desired head-discharge relationship for the bypass weir (with constant outlet size) is determined by the following procedure. Let
k
and qi denote the head and outlet flow at the ith outlet from the pipe inlet, when the plug is positioned past the Nth outlet and q ; = h, = 0. Since the head at the plug is constant, the head at the Kth outlet upstream of the plug is the same when the plug is upstream of the Nth outlet as when the plug is downstream of the Nth outlet. The index i = N — number of outlets flowing. The bypass weir is designed, in effect,by moving the plug upstream and determining an incremental weir width, Wi, as the plug passes each outlet and the bypass flow and head increases.The bypass weir head is denoted by Hi, the corresponding weir flow is Q, and Hi = Q, = 0. The bypass flow for a particular value of i is,
Qi-j ci • [1]
j=1
and the corresponding weir head measured from the weir crest is,
Hi = hi — hvi hvi [2]
where h,, is the velocity head in the pipe upstream from the ith outlet. The weir crest is placed at an elevation, kr above the first outlet, and h ,1 is the inlet velocity head when the .bypass flow is zero. The entrance loss is neglected. Thus, when the head on the weir is zero, the bypass flow is zero and q 1 = 0. This procedure results in a series of points (Hi, Q1), i = 1,N describing the desired weir relationship. An equation giving the total weir flow, Q„ at head, 11,, is,
Qi i-1
CE W. (H.—H. 1) \l/ Hi—(Hj Hj-17j=2
2
+Wi(Hi-Hi_1) 1.5
2
[ 3 ]
where W, is an incremental weir width occurring between heads Hi and Hm . Equation [3] is the orifice equation applied incrementally with a contraction coefficient C w. Units are Qiin m3/s, W and H in m, and q 9.81 m/s2. Equation [3] is solved successively for values of W i, i = 2,N (W 1 = 0). For each successive value of i, the entire summation in equation [3] is recalculated, and then the value of W, is calculated for the known values of Q, and H.
A series of lab tests were conducted using sharp edged metal weir plates to verify equation [3]. The tests resulted in a value of Cw = 0.61. Measured weir flows were within 5 percent of those calculated by the above method.
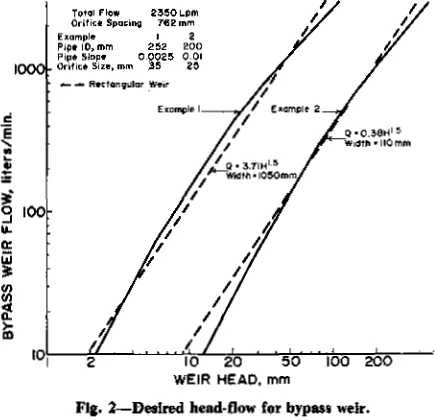
The following simulated examples illustrate the method. The input parameters are given in Table 1. The solid lines in Fig. 2 show the desired head-flow relationships for bypass weirs for the two examples. The
TABLE 1. INPUT PARAMETERS FOR DESIGN OF BYPASS WEIR
Ex. 1 Ex, 2
Pipe I.D., mm 252 200
Pipe slope 0.0025 0.01
Hazen-Williams C 150 /60
Total inflow, Lpm 2350 2350
Outlet size, mm 35 25
Outlet spacing. mm 762 762
Maximum outlet flow. I,pm 57 57
Maximum outlet head, mm 120 450
Maximum No. of flowing outlets 85 75
Fig. 1--Schematic layout of bypass pipe and weir.
Intake equation Furrow length, in Applied depth, gross, mm Plug speed
Z 10.3 T0-7+ 5.33, Tinhre, Z in Lim 400
Total Flow 2390 Lon Orifice Sparing 78 2 mrn Example I 2 Pipe 10, mm 252 200 Pipe Mop. 0.0025 0.0I Grit ire Size, mm 35 23
E
a
0 Lo-w
ua
to
4
10 20 50 100 200
WEIR HEAD, mm
5.1mq:ie. I 2 Pip* Slope 00025 0.01
Pipe Sae, mm 252 200 Weir Crest Elm, mm 31 79
350
300
250
E 200
Ill 150
Fteclaagalar Weir
0 200 400 600 800 1000 1200 1400 1600 1800
WIDTH. mm 100
50
Gr prs
i 180
170 160 E 150 E 140 1- 130
a.
w
•
120 D 110 100 150a-- 150
a_
<r 140
130 120 110
100 20 40 60 80 100 120 140 18•180 200
FURROW NUMBER
Gem
E. 2
Ne
Fig. 4—Gross and net water application using a rectangular bypass weir.
Net
Fig. 2—Desired head-flow for bypass weir.
dashed straight lines in Fig. 2 are for rectangular weirs of the widths shown.
Both of these examples use the same total inflow rate, outlet spacing, and outlet flows. Example 2 uses a steeper pipe slope to produce higher heads than example 1. The computed orifice flow and head at the orifice nearest to the plug are given in Table 1. The computed weir width curves which produce the desired head-flow curves are shown as solid lines in Fig. 3. The vertical scale in Fig. 3 was expanded for clarity. The weir shapes are similar for both cases, with a wide area near the bottom and narrow at the top. The desired flow-head relationships can be approximated to the extent indicated in Fig. 2 by rectangular weirs of the widths shown in Fig. 3. The weir crest elevations above the first outlet are given in Fig. 3, which when added to the maximum weir head equal the maximum orifice head.
The distribution of gross and net (gross application minus runoff) water application on a rectangular field consisting of 200 furrows was simulated using the rectangular bypass weir discharge equations from Fig. 2 and the intake-time relation shown in Table 1. The total infiltrated depths for the lower end are computed by assuming that the intake opportunity time is cumulative for the two successive applications. The results are shown in Fig. 4. The plug speed given in Table 1 was calculated
Fig. 3—Bypass weir shapes.
to produce an average gross application of 150 mm. The gross and net applications at the upper end are nearly uniform as shown in Fig. 4. Thus, the rectangular weir appears adequate to eliminate the initial end effect with constant outlet size. The variation in gross and net application at the lower end is due to the fact that as the total bypass flow decreases, friction losses in the down stream portion decrease. This causes the head and flow distribution to be more heavily weighted toward the extreme lower end. This effect results in variations of
± 10 to 15% from the average application. This variation can be reduced by adjusting outlet sizes near the lower end. The dotted lines in Fig. 4 show how the applications were affected in example 1 by reducing the outlet size from 35 mm to 30 mm for the last 15 outlets. The net application was significantly improved and further outlet size adjustment could make the net application essentially uniform.
During the 1983 season, three systems were installed with the bypass pipe and weir and operated satisfactorily for several irrigations. Adjustable width rectangular weirs were used to handle different flow rates.
Bypass Plug
The second bypass method uses a flow-through plug to bypass a variable portion of the flow to the lower end of the pipe. The bypass pipe and weir are unnecessary since all the flow remains in the main pipe. The hydraulics are slightly different than the weir method since the bypass occurs at the plug rather than at the upstream end. The requirement that the head at the plug remain constant is no longer valid, although the head should remain nearly constant as will be seen. The main hydraulic requirement was that the plug must have a large enough maximum opening to accommodate the high initial flows with the allowable head loss. The desired characteristics of the plug were initially unclear. The bypass plug development involved (a) designing a mechanically workable plug, (b) running laboratory tests to determine its hydraulic characteristics, and (c) using the computer model to evaluate the bypass and water distributions obtained in similated field tests.
250 mm PVC Pipe
160 Con 1T01 Link
omen, ion cam • I 0 • 7'0 • 320
S
55
10 20 30 40 50 PLUG TRAVEL DISTANCE, 5, meters C
70 Fig. 5—Wheel controlled bypass: cross section.
designed to gradually close the butterfly gate as the plug moves down the pipe. Initially, an attempt was made to control the gate with a head sensitive mechanism, however this was abandoned in favor of a mechanical control by which the gate opening was made a function of travel distance. The mechanism shown in Figs. 5 and 6 proved to be practical and gives the desired control. The plug body is supported and centered in the pipe by wheels. The front wheels are small plastic support wheels. The rear friction drive wheels are fixed to a horizontal shaft and control the gate through a gear-driven screw linkage. The plug components can be designed to close the butterfly gate from any given initial opening in the desired travel distance by adjusting the wheel size, gear ratio, screw thread pitch and the linkage distances. The linkage is adjusted so that when the gate is completely closed, the traveling nut has moved onto the reduced portion of the rotating shaft, allowing the wheels to rotate freely as the plug continues to move down the pipe.
Two sizes of the bypass plug, the 200 mm (8 in.) diameter shown in Figs. 5 and 6 and a 150 mm (6 in.) diameter, were tested in the laboratory to determine their hydraulic characteristics. A flow coefficient is defined as,
Fig. 6—Rear view of wheel controlled bypass ping.
mechanism were changed significantly from that shown, equation [61 may not be accurate for high flow rates. The same mechanism was used for both the 200 mm and 150 mm plug size. By sizing the gaskets and adjusting the wheels, the 150 mm plug can be used in both 200 mm and 250 mm pipes, and the 200 mm plug can be used in 250 mm and 300 mm pipes. Since most cablegation systems thus far installed have used pipe sizes between 200 and 300 mm (8 to 12 in.), the two bypass plug sizes will serve most systems.
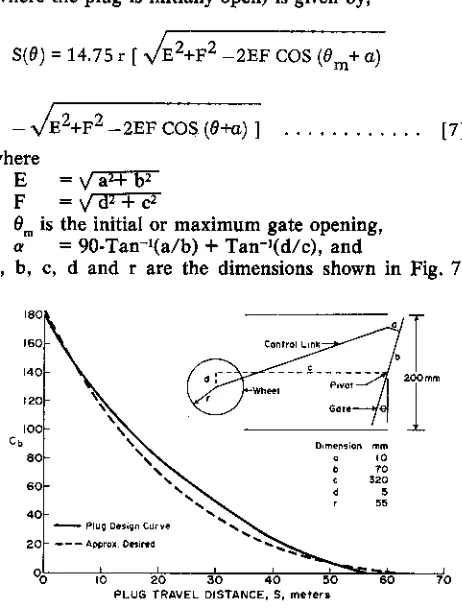
A schematic of the plug mechanism is shown in Fig. 7. In order to simulate the bypass plug operation and optimize the design, a relationship was developed between travel distance, S, and gate angle 0. With a gear ratio of 3.73:1, and thread pitch of 16 per 25.4 mm (1 in.), the actual travel distance from the pipe inlet (where the plug is initially open) is given by,
5(0) = 14.75 r [ ,N/E 2+F2 —2EF COS (0 m+ a)
Cb = Qb / ‘/-711 [4]
where Q, is flow through the plug (bypass flow) in L/min, and Ah is piezometric head difference across the plug, mm.
The upstream head is known and the downstream head, h, is the partial flow depth approximated by the equation (fitted to a dimensionless curve of Chow, 1959, pg. 135),
h = D (0.2 + 0.7 Qb /Qc) [ 5 ]
where D is pipe diameter, mm, and Q, is pipe flow capacity, L/min, with the friction slope equal to pipe slope. The minimum allowed value of h is 0.5 D.
The flow coefficient was measured at various gate angles between 0 and 85 deg for both the 200 mm and 150 mm plugs and the following equation was found to closely approximate the laboratory results for this plug design.
Cb 2.6 X 10⁻⁵ D 2 0 1.2 [6]
where Dp is diameter of the plug, mm, and 0 is the gate
opening angle from fully closed, degrees.
The losses through the plug are partly due to the plug body and mechanism at large gate openings. Thus, if the
/E 2+F2 —2EF COS (0+a) I [ 7 ]
where
E =V
a2+
b2 F = c12. + e20m is the initial or maximum gate opening,
a = 90-Tan-1(a/b) + Tan- 1(d/c), and
a, b, c, d and r are the dimensions shown in Fig. 7.
• -..
DIplI • "br Reed II Plug
40— 35 2 30•
140^ 170 i60 150 140 Co 130 120 110
Oref•c• 0.4ruttwr
Equation [6] is combined with equation [7] to determine the flow coefficient, Cb, as a function of travel distance.
Equations [6] and [7] provide a means to design a bypass plug for a particular system. Example 1 will be used to illustrate the method. Assuming that the head at the plug should remain constant, (and equal to the final head at the plug) and assuming that the bypass flow as computed for the bypass weir applies for any given plug position, a series of Cb values is calculated according to
equations [4] and [5]. This results in an approximate desired C,,-S relationship which is plotted as the dashed line in Fig. 7. The solid line in Fig. 7 is the Cb-S curve
computed by equation [7] using the dimensions shown. Values of the dimensions are chosen within limits of the mechanism to produce a curve closely matching the desired curve at the end points and giving the approximate desired shape, It was found that the value of a should be kept small, i.e., a 10-15 mm. The values of c and d can be fixed initially and the design optimized primarily by adjusting b and r. The value of d should be small x 5 mm and the wheel radius r should be as small
as possible in order to keep the wheel tracks as high as possible. This helps to prevent plug rotation. The wheel spacing is adjusted to center the plug in the pipe. The initial gate opening is determined from the maximum value of Cb 180, giving an angle of = 69 degrees for
this example. The dimension b can be easily changed with a fixed wheel size to accommodate different flow rates (the initial opening would need to be recalculated also).
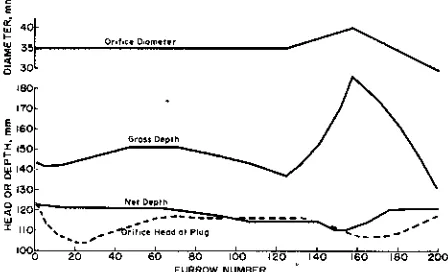
Fig. 8 shows the gross and net application resulting from simulating the bypass plug in example 1 as designed in Fig. 7, using equation [7] in the model. The net application was nearly uniform, indicating that the plug as designed nearly eliminated the upstream end effect. The head at the plug varied as shown by the dashed line. The initial head at the plug was about 10% higher than the final head. The orifice size was varied at the lower end to improve the distribution, as was done for the bypass weir method.
The 200 mm and 150 mm plugs will accommodate flows up to about 3750 L/min and 2450 L/min, respectively, with an upstream outlet head of 200 mm. For systems using large flows, the plug can be started part way down the pipe, or the initial head can be increased (if available). For very low outlet heads (h <100 min), plug control becomes more critical to avoid large variations in outlet flows, and for these systems the bypass weir method may be more practical.
1000 20 40 60 50 100 140 140 160 180 200 FURROW NUMBER
Fig. 8—Gross and net water application with bypass plug for Example 1.
Fig. 5 shows a conical-shaped rubber gasket which was designed for use with the bypass plug. These are easily constructed from flat rubber sheets about 2 mm (3/32 in.) thickness and are attached to the plug body by means of a simple band clamp. The gasket angle is about 20 deg. In field tests of the bypass plug, the gaskets proved to be flexible enough to perform well even when the pipes were considerably out of round, and held against heads up to about 500 mm. Higher heads can be accommodated by using thicker material or by "stacking" two or more gaskets. One advantage of this type of gasket is that the gasket will fold over on itself if the cable feed is reversed allowing the plug to be pulled back out of the pipe if problems are encountered. The 200 mm plug was tested in 250 mm aluminum pipe with commercial gates. The plug and gasket performed well with two types of gates which protruded about 7 mm into the pipe.
The butterfly gate does not seal perfectly when closed and some leakage can be expected. In laboratory tests, the combined gasket and gate leakage was about 20 Limin with an upstream head of 500 mm. The plug is shown with a single gasket, but double gaskets could be used to prevent additional leakage at pipe joints or outlets.
Weights 500 g) are attached to the bottom of the plug body as shown in Fig. 5 to prevent the plug from rotating as it moves through the pipe, and to reduce the possibility of wheel slippage. The butterfly gate is inherently self-closing and the drag on the wheels is near zero. The bypass plug mechanism would be subject to trash problems. Therefore a trash screen should be used with this system, both to protect the plug and prevent outlets from plugging.
Several field tests of the bypass plug were conducted in 1983 in farmer systems. Hydraulically, the plugs functioned as expected, and with minor adjustments in the mechanism the end effects were nearly eliminated. Three plugs were operated by the farmers through the irrigation season with good results. One plug tended to rotate and turn over. This problem was corrected by adjusting the wheel alignment.
FLOW CUTOFF OUTLETS
The cutback furrow flow inherent in the cablegation system is advantageous except for the tail end flows which are insufficient to reach the ends of the furrows. Uniformity of water application would be maximized if the inflow to each furrow were cut off abruptly when the runoff from that furrow ceased. The benefit obtained from cutoff would depend on the shape of the infiltration curve. If the intake rates remain relatively high throughout the irrigation period, the cutoff would be highly beneficial since the tail end flows would overirrigate the upper part of the field. On the other hand, if the soil has a low sustained intake rate and high initial rate, the benefit from cutoff would be minor since little additional water would be infiltrated at the upper end after runoff ceased. This section describes how the cutoff can be accomplished and evaluates the water distributions obtained with and without cutoff.
Gravity Valve Outlet
0 • 2350 L/Inin
Pipe Sias,* 0.0025 10 252 mm Intake Z • 10.4t Q- 7 • 5.3 Z in Lim, t in Pvs
Olitioe,mm Cutott Mead, mm
- 55 q
40
Constant InfIQW
00 P 4 6 8 10 12 14 16 18 20 22 24 26 25 30 TIME, hours
PVC Ell 3Elmrn U V2 inch/
Nuts and washers far weight
Adjustable Collar
3 rnm X 12 mm Steel
Srrirn Brass Rod
Fig. 9—Minimum-head valve for =Negation.
when the plug passes the outlet and remains fully open until the head drops below the head needed to support the weight of the valve, and then closes completely. A prototype was built as shown and tested. The gravity outlet operated as predicted. The calibration equation for this valve is,
q = 0.4 th [8]
where
q is flow in Limin h is head in mm, and
t is valve opening distance, min.
The opening distance is adjustable to control the maximum stream size. The head at which cutoff occurs is controlled by the weight of the valve assembly per unit area of outlet.
The relationship between outlet diameter, d (mm), valve weight, w (g), and cutoff head k (mm) is,
ho = 1273 wid.2 [ 9 ]
Siphon Tube Outlet
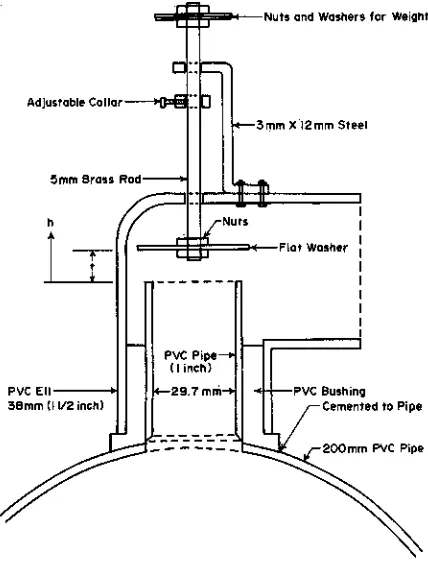
The second type of cutoff outlet is a siphon tube attached to the top of the pipe as shown in Fig. 10. In operation, water begins to flow when the plug passes the outlet, and the flow decreases in the normal manner. When the piezometric head (i.e., water surface) drops below the top of the pipe, air enters the outlet and breaks the siphon, abruptly stopping the flow. In order for the flow cutoff to be complete, the overflow level of the siphon must be placed above the top of the pipe. Also, if a restricting orifice is used in the outlet to reduce the maximum flow, it must be placed at the outlet of the siphon. If the restriction is placed near the inlet of the siphon, the siphon may be broken by air entering from the outlet. The siphon outlet must be positioned at some
Fig. 10—Siphon outlet.
distance below the top of the pipe; this distance determines the effective cutoff head and minimum flow rate.
Prototype siphon outlets were built using a 25 mm (1 in.) plastic elI cemented to the top of the pipe at about a 30 deg angle from vertical. A short length of 25 mm (1 in.) pipe was used as a siphon extension. Flow adjustment was obtained by using a sliding orifice plate with several different orifice sizes. Laboratory tests were conducted to verify the flow cutoff characteristics of the siphon outlet. Siphon outlets were incorporated in a cablegation system and field tested for two irrigations. The siphon outlets performed as expected but the field data was not meaningful since only a portion of the system utilized siphon outlets. At the time of this writing one company is manufacturing siphon outlets which cost about $1.50 each, and one system was installed in 1983 with these outlets.
Other types of cutoff outlets are possible and their feasibility would depend upon their relative cost when mass produced. However, their functional characteristics would be the same.
Infiltrated Water Distribution
Example 1 (Table 1) was used to illustrate the effect of cutoff outlets on the distribution of infiltrated water. These simulated distributions are shown for constant outlet size and infinite length pipeline: variations due to the end effects previously discussed were ignored. Fig. 11 shows the furrow inflow and runoff rates. For the cablegation system without cutoff (cutoff head = 0), an outlet size of 35 mm was used. For the cutoff flow case, the cutoff head (40 mm) was selected such that the cutoff occurred at about the same time that runoff ceased. Also, the outlet size was reduced from 35 to 30 mm in order to obtain about the same percentage of runoff
Fig. 11—Inflow and runoff rates for a single furrow.
Isms
101011Me iseeineeRNn
Nuts
mrie
Fiat Washer
I
mme
M PVC Pipe
(I inah)
29.7 mm PVC Bushing
Cemented to Pipe
100
60 ineake Z -10.41° 7 • 61
Grilse Depth IDDmrn
Percent Runoff CO No Cu,0It 19 0.99 — — — Color? Plow 19 0.97 —• — • — Conseu., Inflow 22 0.94
^ • _
L 130
lig .
120.--ii0 100 90
60
g 70 °- 60
Intolve T • 2021° 4
Gress Depth 150 we
Percent Runoff Cu Np Cutelf i6 0.92 — — Color r 19 9.96
10 20 30 40 50 60
PERCENT OF FURROW LENGTH
500 19 20 30 40 50 60 70 BO PERCENT OF FURROW LENGTH
go 100
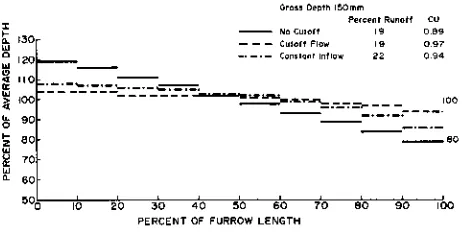
Fig. 13—Distribution of infiltrated depth for a furrow with low sustained intake rate.
Fig. 12—Distribution of infiltrated depth for a furrow with high sustained intake rate.
(19 q) as the zero cutoff case. Gross application was 150 mm in all cases. The initial stream size was slightly smaller and the beginning of runoff was delayed as shown for the cutoff case. Selection of the optimum cutoff head is a trial and error process. Fig. 11 also shows the runoff curve for a constant inflow rate for comparison. Fig. 12 shows the distribution of infiltrated water for the three examples shown in Fig. 11. Instantaneous recession was assumed in the analysis. The intake function for example 1 has an exponent of 0.7, which gives high sustained intake rates, relative to the initial rates.
Fig. 13 shows the distributions for a different intake function in which the initial intake rates are higher, but after about six hours, they become lower than in the previous example. The relative improvement in water distribution resulting from cutoff is less than in Fig. 12. Uniformity coefficients for these examples are shown in Figs. 12 and 13.
The cutoff outlets allow the use of smaller initial stream sizes to obtain a specified amount of runoff. Also, the problem of flow variation due to inaccuracies in pipe levelling are reduced because the low head flows are eliminated.
SUMMARY AND CONCLUSIONS
Two techniques for improving the water distribution characteristics of cablegation systems were explored. The bypass method largely eliminates the problem of nonuniform inflow-time distributions at the upper and lower ends of the pipe. The bypass can be accomplished by directing flow over a weir into a parallel pipe to divert the flow around the initial section to the lower end where it is distributed upstream from a stationary plug. An overflow weir is used to control the bypass flow. Alternatively, a flow through plug with a variable orifice can be used to accomplish the bypass, eliminating the need for the bypass pipe. Model simulations show that both of these methods eliminate the upstream end effect and can provide uniform net application with constant outlet sizes at the upstream end. The downstream end effect is reduced, however, variations of about 15% of net application still occur. Small adjustments in orifice
size near the lower end can reduce these variations to less than 10 q. The bypass method simplifies system operation because the plug can be started moving from the first orifice and no initial stationary set time is needed. When the plug reaches the end of the pipe, the irrigation is complete. The design and operation of cablegation systems is simplified since less attention is needed to varying orifice sizes, and initial and final set times are eliminated.
The choice of using the bypass weir or bypass plug involves several factors. For very low head situations the bypass weir should be used. The weir method is simpler to operate and may be more dependable. The bypass plug is somewhat more difficult to adjust for different flow rates or outlet sizes. From an economic standpoint, it appears that a bypass plug can be built at considerably less cost than the bypass pipe can be installed. Development of the bypass plug method will continue and other methods of controlling the plug opening will be explored.
The second part of the paper dealt with the problem of water distribution in an individual furrow and the excess water application at the upper end due to the low furrow flow rates near the end of the inflow period. Flow cutoff outlets were designed to stop the inflow when a minimum pressure head is reached. The inflow can be cut off at about the same time that runoff ceases, thus maximizing infiltration uniformity. A gravity valve outlet and a siphon outlet both provide the desired operational characteristics. The benefits of using cutoff outlets are greatest on soils having relatively high sustained intake rates. On these soils the cablegation system without cutoff outlets can
give
poorer uniformity than the conventional constant flow system.References
1. Chow, Vert Te. 1959. Open channel hydraulics. McGraw-Hill. 2. Goel, M. C., W. D. Kemper, Robert Worstell, and James Bondurant. 1982. Cablegation: III. Field assessment of performance. TRANSACTIONS of the ASAE. (in press).
3. Kemper, W. D., W. H, Heinemann, D. C. Kincaid, and R. V. Worstell. 1981. Cablegation: I. Cable controlled plugs in perforated supply pipes for automatic furrow irrigation. TRANSACTIONS of the ASAE 24(6):1526-1532.