GLOBAL NETWORK INDUSTRIES: A
CASE STUDY ON ORGANIZATIONAL
DYNAMICS AND EFFICIENCY
Giacomo Di Foggia
University of Milano-Bicocca. Department of Business Administration, Finance, Management and Law, Italy
Abstract
Focusing on key aspects of network industries, this study investigates recent dynamics of global aviation industry on a temporal and business organization basis. Specifically, the study focuses on companies based in both estabilished and prominent global markets such as the USA, Europe, Asia and Middle East. The paper presents comparable data on profitability of carries in the last twenty years that are reported in a similar fashion. It also associate the ratios of companies of each area to comprehend which is more or less profitable or efficient in its operation. As long as Asian and Middle East carries have strengthened their position as key players in the global markets results from the empirical investigation suggest that the strategic role which is played by global carriers in terms of growth, jobs and economic development requires effective policies aimed at guaranteeing a proper regulatory environment for the operation firm.
Key words:
Network industries; Aviation; Business model; Industrial organization,
INTRODUCTION
over time and their services are prone to be either complements or substitutes, with different degrees of homogeneity nevertheless. This is true in most sectors, taking into consideration the transport industry, inland road transport and railways can compete on short and long distances, nonetheless diverse transportation modes can complement each other. In the field of aviation, shared areas of research have been the taxation, regulation, labor, and fuel related costs in the European and americal markets as a consequence of the higher competition levels boosted by the American deregulation started in 1978, and the European liberalization ten years later. This work presents strategic economic data and profitability ratios controlling for the growing similarities of the business configuration and models between the so called low cost carries (LCCs) and full service network carries (FSNCs). The above mentioned business convergence may be steered by strategic decision of infrastructure boundries where because of the lack of low-cost aviation infrastructure LCCs offer premium services for better yields and FSNCs reduce add-on services and tickets prices to preserve market share. No wadd-onder that competitive forces determine the profitability of an industry and so are of greatest importance. Airways are on the front line of this competitive challenge and are fighting to survive in competitive market that is characterized by different regulatory frameworks, by different cultures and preferences, by market barriers and drivers or by different competition level. See for example market biases coming from subsidies granted on subjective bases or other practices that preclude firms to offer their products operating under the same regulatory environment (Arrigo & Di Foggia, 2013).
The remainder of this paper is organized as follows: in the first section the network industries interrelations with the other sectors of the economy are introduced. After that the paper describes the aviation sector since, only a few industries have tackled fluctuations as deep as those that have characterized the global aviation industry over the past two decades. This is followed by a discussion of costs structure, types and relative proportions on total costs costs. Since the concept can be defined in smaller units (e.g. products, services, customers etc.), the geographic region was choosen as a refefrence. After that, the paper:
(i) Resumes the crucial features of business models;
(ii) Compares some economic data; and
(iii) Provides comparable profitability and efficiency ratios.
The discussion of main results follows and in the last section, the paper provides some conclusions and business implications.
CASE DELIMITATION
promint role of networks in the economy emerges. In all cases, their output multipliers are equal or above the median economy-wide multiplier (1.9), which hints at the strong inter-linkages that these sectors have with the rest of the economy. This is observed in particular in air transport (multiplier of 2.4) and water transport (multiplier of 2.2), as well as in further related services, having even higher shares in value added, like logistics. Transport is the backbone of business activity; linking the different stages of production, allowing service industries to reach their clients, as well as being a significant employer in its own right.
HIST.1:SOURCE: OWN ELABORATION BASED ON EC-DGECFIN,2013
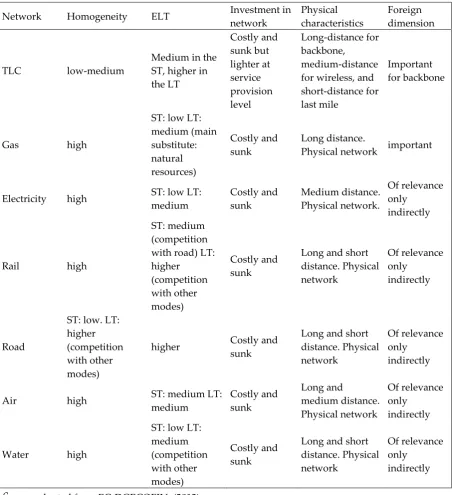
It is commonly recognized that network industries share some characteristics, nevertheless, each network industry has its own characteristics and specificities. On the one hand, the infrastructure segment displays features of natural monopoly and is thus usually subject to regulation on pricing and access to the network. This applies to the transmission and distribution networks in e-communications, energy, and transport infrastructures. On the other hand, as long as each operator gets a fair and transparent access to the infrastructure, competition can be ensured in service provision.
TABLE 1. NETWORK INDUSTRIES’ CHARACTERISTICS AT A GLANCE
Network Homogeneity ELT Investment in
network
Physical characteristics
Foreign dimension
TLC low-medium
Medium in the ST, higher in the LT Costly and sunk but lighter at service provision level Long-distance for backbone, medium-distance for wireless, and short-distance for last mile
Important for backbone
Gas high
ST: low LT: medium (main substitute: natural resources) Costly and sunk Long distance.
Physical network important
Electricity high ST: low LT:
medium Costly and sunk Medium distance. Physical network. Of relevance only indirectly
Rail high
ST: medium (competition with road) LT: higher (competition with other modes) Costly and sunk
Long and short distance. Physical network Of relevance only indirectly Road
ST: low. LT: higher (competition with other modes)
higher Costly and
sunk
Long and short distance. Physical network
Of relevance only
indirectly
Air high ST: medium LT:
medium Costly and sunk Long and medium distance. Physical network Of relevance only indirectly
Water high
ST: low LT: medium (competition with other modes) Costly and sunk
Long and short distance. Physical network
Of relevance only
indirectly
Source: adapted from EC-DGECOFIN. (2013).
RELATED WORKS AND BACKGROUND
such as increases in energy prices and fluctuations in prices of raw materials or contractions in infrastructure spending - could have negative consequences for the industry and, together with the other factors, could have a hostile effect. It is on this basis that that many studies dealing with aspects influencing the industry operations, e.g. regulatory environment (Arrigo, 2014), the market mechanisms where the field of industrial organization deals primarily with the market system approach (Scherer & Ross, 1990; Forbes & Lederman, 2009), have been published so far. The human resources field has also emerged as prominent area (Bamber, Gittell, Kochan, & Von Nordenflycht, 2013; Wright, 2012). Taking into consideration the labor cost, Alamdari & Morrell (1997) analyze trends focusing on major US and European operators. By the same token Borenstein & Rose (2013) focus on the profitability, in particular its volatility and the implications of investment deficits. Keeping on profitability, Oum et al, (2004) examine the effect of horizontal alliances on firm performance in terms of productivity and profitability. Their study reveals that horizontal alliances make a significant contribution to productivity gains, whereas they have no overall significant and positive impact on profitability. Indeed, focusing on financial aspects, a recent report reveal a gap in the index of profitability of the invested capital, (IATA, 2013). Switching to typical operative choices Wei & Hansen (2007) investigate how airlines make decisions on aircraft size and service frequency. The authors study how airlines’ choices in a competitive environment may vary with flight distance, and explore how the equilibrium results may change when air travel demand is higher. Their research considers the competition factor in airlines’ decisions on both aircraft size and service frequency, and the impact of these decisions on both the cost and demand sides of airlines’ business.
GRAPH 1: FINANCIAL DATA
factors. Graph 1 also shows the return on invested capital (ROIC) that is on average 4% higer then the weighted average cost of capital (WACC).
TAXONOMY OF OPERATING COSTS
In this section the paper sheds some lights on the cost structure. A comparison of the cost structures for short and long-haul routes suggests that input costs, such as labor rates and administrative expenses are a much smaller share of the average cost per available-seat km on long-haul ones. Simultaneously, taxation, fees, and surcharges account for three quarter of the ticket price in some long-haul markets. LCCs’ input-cost edge is larger for short-haul flights than for long-haul ones. Due to the oil market fluctuations fuel costs have drastically increased reaching about 30% of total costs in recent years. To this regard, technological innovations have been introduced to make aircraft more efficient. Indeed the aviation sector has made significant efforts to improve the fuel efficiency through more advanced jet engines, high-lift wing designs, and lighter airframe materials (Lee & Mo, 2011). As a consequence, the amount of fuel used to fly has halved. Provided that the industry can be considered an energy-intensive business, advances in productivity have been significant. Alongside fuel cost another key operating cost determinant is the labor. Alamdari & Morrell (1997) analyze trends in labor unit costs (labor expenses per available ton-km) of major US and European carriers. The results indicate that both US and European airlines have been successful in reducing labor unit costs. The salary for accumulated hours collapsed after the peak reached in the early 2000s, but the gap between the average value of the major airlines and the cost leader in the industry was also maintained in the United States.
GRAPH 2: PERCENTAGE SHARE OF AIRLINE OPERATING COSTS, BY REGION
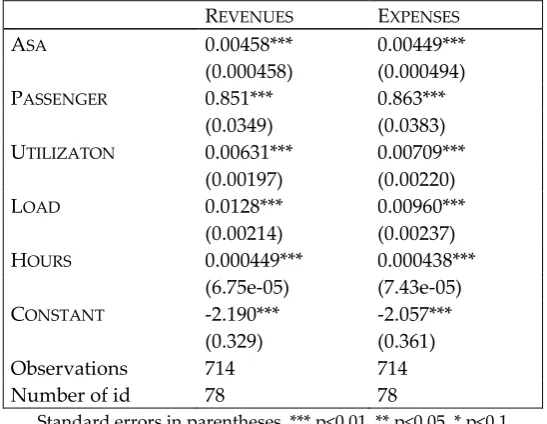
fallen. Airlines have also achieved significant cost efficiencies in other areas reducing the share of “other” costs and the airlines have also substantially improved the use of the aircraft. It is now convenient to present results from a simple model aimed at describe the effects of selected measures on the operative revenues and expenses worldwide. The analysis in based on a panel dataset of 78 companies over 10 years, namely from 2003 to 2012. The variables used to estimate the model are the following: ASA: average seats per aircraft. PASSENGER: number of passenger (log of thousand). UTILIZATION: utilization (hours/day). LOAD: load factor (percentage). HOURS: hours (thousand). The dependent variables are: REVENUES: total revenues (log mil. $). EXPENSES: total expenses (log mil. $).
TABLE 2: REGRESSION MODEL
REVENUES EXPENSES
ASA 0.00458*** 0.00449***
(0.000458) (0.000494)
PASSENGER 0.851*** 0.863***
(0.0349) (0.0383)
UTILIZATON 0.00631*** 0.00709***
(0.00197) (0.00220)
LOAD 0.0128*** 0.00960***
(0.00214) (0.00237)
HOURS 0.000449*** 0.000438***
(6.75e-05) (7.43e-05)
CONSTANT -2.190*** -2.057***
(0.329) (0.361)
Observations 714 714
Number of id 78 78
Standard errors in parentheses. *** p<0.01, ** p<0.05, * p<0.1
REGIONAL BREAKDOWN AND BUSINESS ORGANIZATION
The development at a global level of the air market has triggered industries in defining and developing new business models utilizing new technologic and communication paradigms in order to outperform and mitigate the impact of unfavorable situations (Causevic & Lynch, 2013). Thus, a comparison of airline business models requires that they are coherently assessed (Daft & Albers, 2013). To this respect, one can note that services concentrating on local need and specialized interests are especially vital it is possible to interfere that the convergence of FSNCs and entrants business models and technology requirements would accelerate. FSNCs gain competitive advantages due to their reputation, the economics of scale and know-how, protection granted by some government, and entry barriers in their key airports. FSNCs take advantage from economies of scope and density, especially through the expansion of systems hub-and-spoke. They also take advantage of a international placing thanks to the strategic alliances of which they form part with no investment needs in infrastructure or slots in remote airports (Ramón-Rodríguez et al, 2011). Strategic alliances also can serve to establish barriers for competitors (Oum et al, 2004).
Although strategic alliances seem to be a crucial factor they could involve risks that may prevent the expected benefits of the transactions or the achievement of strategic objectives. Such risks could include: technological and product synergies, economies of scale and cost reductions not occurring as expected; unexpected liabilitie s; incompatibility in processes or systems; unexpected changes in laws or regulations; inability to retain key employees; inability to source certain products; increased financing costs and inability to fund such costs; significant costs associated with terminating or modifying alliances; and problems in retaining customers and integrating operations, services, personnel, and customer bases. If problems or issues were to arise among the parties to one or more strategic alliances for managerial, financial, or other reasons, or if such strategic alliances or other relationships were terminated, the financial position, and results of operations could be adversely affected.
SOME ECONOMIC DATA
TABLE 3: ROIC, WACC AND RATIOS (BY REGION)
Region WACC f ROIC l WACC f ROIC l ROIC r WACC r
USA 7,4% 2,9% 7,4% 3,3% 1,14 1,00
EUROPE 7,5% 3,5% 8,3% 7,6% 2,17 1,11
ASIA 7,7% 3,7% 7,7% 6,9% 1,86 1,00
f=FSNCs, l= LCCs, r = ratio f/t. Source: Owe elaboration based on AITA (2014)
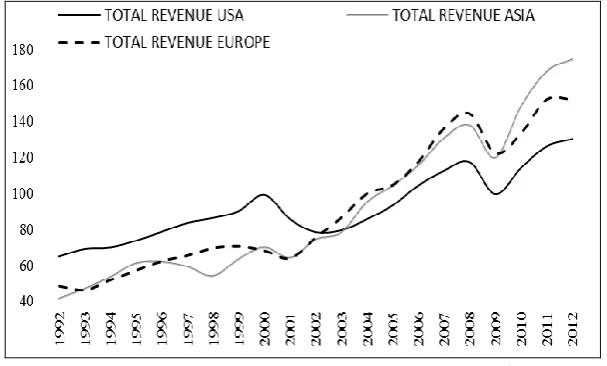
The industry is characterized by: remarkable bargaining power of: suppliers, GDS (Global Distribution System) and clients. Data suggest some carriers have been able to create value for shareholders, however, only few companies have reached similar results. Over the last fifteen years, both the ton-km and the amount of capital invested in the aviation sector have doubled, nevertheless, this would not imply an immediate investors response. In addition, one should mention that over the past forty years the airline industry has more than halved the cost of air transport in real terms, due to better fuel efficiency, resource utilization and productivity of production factors.
The Graph 3 shows the breakdown of total revenues earned by each company in the three regions: United States, Europe and Asia.
Swiching to operating and profitability ratios it is essential to recall that airways face a variety of risks in their business. If for example any of the following events occur, the aviation business, financial condition and results of operations could be materially and adversely affected. Profitability depends on reaching certain minimum sales volumes. If sales deteriorate, the results of operations and financial condition will suffer. The businesses of industry are affected by global financial markets and general economic and other conditions over which companies have no control. Earnings and financial position may be influenced by various macroeconomic factors - including changes in gross domestic product, the level of consumer and business confidence, changes in interest rates for or availability of consumer and business credit, energy prices, the cost of commodities or other raw materials and the rate of unemployment - within the various countries in which firms operate. Also the industry’s future performance depends on its ability to enrich the product portfolio and offer innovative products
The success of businesses depends, among other things, on their ability to maintain or increase their share in existing markets and/or to expand into new markets through the development of innovative, high-quality products that are attractive to customers and provide adequate profitability.The aviation industry is highly competitive and cyclical and business may suffer from those factors more than some of their competitors. The ability to access the capital markets or other forms of financing and the related costs depend, among other things, on the credit ratings. Any downgrade may increase the cost of capital and potentially limit its access to sources of financing, with a consequent material adverse effect on the Group’s business prospects, earnings and financial position. The companies' ability to achieve cost reductions and to realize production efficiencies is critical to maintaining their competitiveness and long-term profitability.
TABLE 4: PROFITABILITY RATIOS BY REGIONS (% REVENUES)
Europe Asia USA World
Year OP/TR NI/TR TC/TR OP/TR NI/TR TC/TR OP/TR NI/TR TC/TR OP/TR NI/TR TC/TR 1992 -0.61 -4.15 1.00 4.52 3.13 0.95 -4.03 -4.50 1.04 -1.03 -3.14 1.01 1993 0.03 -6.56 1.00 3.34 2.10 0.97 1.30 -1.99 0.99 1.12 -2.56 0.99 1994 4.09 3.39 0.96 5.46 3.05 0.95 2.61 -1.39 0.97 3.64 0.71 0.96 1995 5.41 1.17 0.95 5.72 2.94 0.94 6.80 2.58 0.93 5.66 1.81 0.94 1996 3.63 1.13 0.96 4.50 2.28 0.95 6.72 3.70 0.93 4.75 2.31 0.95 1997 5.60 5.18 0.94 4.00 -0.56 0.96 9.15 6.30 0.91 6.35 3.91 0.94 1998 5.75 4.31 0.94 3.56 0.44 0.96 9.30 5.42 0.91 6.21 3.38 0.94 1999 1.96 2.68 0.98 5.30 3.16 0.95 7.20 5.92 0.93 4.65 3.65 0.95 2000 2.01 2.72 0.98 6.20 2.33 0.94 5.70 2.34 0.94 4.11 1.93 0.96 2001 -2.71 -4.01 1.03 2.29 -1.68 0.98 -10.01 -8.60 1.10 -3.86 -5.20 1.04 2002 3.06 0.44 0.97 4.67 2.88 0.95 -12.04 -14.47 1.12 -1.87 -4.13 1.02 2003 1.13 -1.22 0.99 3.01 1.21 0.97 -4.35 -5.30 1.04 -0.05 -2.47 1.00 2004 3.11 1.31 0.97 6.49 4.53 0.94 -4.09 -11.61 1.04 2.25 -1.17 0.98 2005 4.00 3.31 0.96 3.10 1.57 0.97 -2.35 -7.00 1.02 1.88 -0.14 0.98 2006 4.33 3.53 0.96 3.42 2.69 0.97 4.27 1.63 0.96 3.82 2.51 0.96 2007 5.94 5.03 0.94 5.29 3.13 0.95 5.84 3.36 0.94 5.47 3.80 0.95 2008 0.71 -1.47 0.99 -4.43 -5.79 1.04 -5.45 -22.73 1.05 -2.28 -8.33 1.02 2009 -2.60 -2.92 1.03 -1.96 -1.95 1.02 0.32 -3.11 1.00 -1.05 -1.81 1.01 2010 2.04 2.48 0.98 7.73 6.32 0.92 6.80 2.21 0.93 5.41 3.81 0.95 2011 1.40 0.53 0.99 4.11 2.35 0.96 3.93 1.35 0.96 2.87 1.20 0.97 2012 1.69 0.59 0.98 4.43 2.20 0.96 4.38 -0.04 0.96 3.14 0.70 0.97 OP: Operating Profit;NI: Net Income after Taxes; TR: Total Revenue.
Source: own elaboration on data Airline Monitor (2013).
TABLE 5: OPERATING COSTS PER REGION (US CENT $)
Year Europe Asia USA ME
2002 11.97 9.16 12.21
2003 13.46 9.68 11.58
2004 13.80 9.67 11.33
2005 13.53 10.26 11.58
2006 14.33 10.80 11.87 8.34
2007 15.40 11.30 12.17 8.80
2008 16.93 13.38 14.63 10.02
2009 15.95 11.63 12.54 9.67
2010 15.66 11.39 12.86 8.90
2011 16.79 13.23 14.34 9.28
2012 16.26 13.52 14.58 10.03
Source: own elaboration on data Airline Monitor (2013)
It is apparent from Table 5 that the unit costs of the operators based in the Middle East are the lowest.
CONCLUDING REMARKS
Driven by factors such as the diversification and increasing global demand especially since the Nineties, the volatility inputs’ costs, regulatory environment, financial market and stakeholders the aviation sector has introduced important innovations and efficiency mesures aimed at boosting the productivity. From an industrial organization perspective, new entrants have gained market power and the business models of both FSNCs and LCCs have almost converged in strategic areas i.e. service levels, price and aircraft sized. No wonder that operators now compete vigorously to meet user needs in all segments of the market. The interpretation of the data contained in the corresponding tables in straightforward and put in evidence that In traditional industries, the economic model orthodoxly used to assess the market function is perfect competition; to this regard, network industries are dissimilar. In their markets, products are heterogeneous and differentiation in products is common, innovation is essential, sunk cost is significant . Two of the most common characteristics concern their directionality and spatial character (Gottinger, 2003).
REFERENCES
Airline Monitor (2013). A review of trends in the airline and commercial jet aircraft industries
Arrigo, U. (2014). Grounding Airlines. Torino: IBL.
Arrigo, U. & Di Foggia, G. (2013). Schemes and Levels of State aid to Rail Industry in Europe: Evidences From a Cross-Country Comparison, European Journal of Business and Economics, 8(3), 14-20.
Arrigo, U. & Di Foggia, G. (2014). Theoretical and viable charging models for railway infrastructure access: an european survey, Management Research and Practice, 6(2), 5-24.
Alamdari, F. E. & Morrell, P. (1997). Airline labour cost reduction: post-liberalisation experience in the USA and Europe, Journal of air transport management, 3(2), 53-66.
Bamber, G. J., Gittell, J. H., Kochan, T. A. & Von Nordenflycht, A. (2013). Up in the air: How airlines can improve performance by engaging their employees. Cornell University Press.
Borenstein, S. & Rose, N. L. (2013). How airline markets work… or do they? Regulatory reform in the airline industry, In: Economic Regulation and Its Reform: What Have We Learned?, University of Chicago Press.
Bjelicic, B. (2012). Financing airlines in the wake of the financial markets crisis, Journal of Air Transport Management, 21, 10-16.
Causevic, S. & Lynch, P. (2013). Political (in)stability and its influence on tourism development, Tourism Management, 34, 145-157.
Daft, J. & Albers, S. (2013). A conceptual framework for measuring airline business model convergence, Journal of Air Transport Management, 28, 47-54.
Di Foggia, G. (2015). Governance, strategy and innoation of utilities controlled by urban governing bodies: insights for industrial policy. Management Research and Practice, 7(3), 5-20.
Di Foggia, G. & Lazzarotti, V. (2014a). Assessing the link between revenue management and performance: insights from the Italian tourism industry, Measuring Business Excellence, 18(1), 55-65.
EC-DGECFIN (2013). European Commission Directorate-General for Economic and Financial Affairs. Market Functioning in Network Industries - Electronic Communications, Energy and Transport. European Economy, Occasional Papers 129.
Forbes, S. J. & Lederman, M. (2009). Adaptation and vertical integration in the airline industry, The American Economic Review, 99(5), 1831-1849.
Ginieis, M., Sánchez-Rebull, M.-V. & Campa-Planas, F. (2012). The academic journal literature on air transport: Analysis using systematic literature review methodology, Journal of Air Transport Management, 19, 31-35.
Gottinger, H. W. (2003). Economies of Network Industries. London and New York: Routledge.
IATA. (2013). Profitability and the air transport value chain. IATA Economics Briefing N° 10. Brian Pearce.
Lee, J. & Mo, J. (2011). Analysis of Technological Innovation and Environmental Performance Improvement in Aviation Sector, International Journal of Environmental Research and Public Health, 8(9), 3777-3795.
Oum, T. H., Park, J.-H., Kim, K. & Yu, C. (2004). The effect of horizontal alliances on firm productivity and profitability: evidence from the global airline industry, Journal of Business Research, 57(8), 844-853.
Pellicelli. (1996). Le Compagnie Aeree [Air companies]. Milano: Giuffré.
Ramón-Rodríguez, A. B., Moreno-Izquierdo, L. & Perles-Ribes, J. F. (2011). Growth and internationalisation strategies in the airline industry, Journal of Air Transport Management, 17(2), 110-115.
Scherer, F. M. & Ross, D. (1990). Industrial market structure and economic performance. University of Illinois at Urbana-Champaign's Academy for entrepreneurial leadership historical research reference in entrepreneurship.
Shy, O. (2011). A short survey of network economics, Review of Industrial Organization, 38(2), 119-149.
Wei, W. & Hansen, M. (2007). Airlines’ competition in aircraft size and service frequency in duopoly markets, Transportation Research Part E: Logistics and Transportation Review, 43(4), 409-424.