A Particle Swarm Optimization based
Maximum Power Point Tracking for Fuel Cell
compared with P&O algorithm
Masoumeh Rezanejhad
1, Mohammad sarvi
21
Islamic Azad University Saveh Branch,
2
Imam Khomeini International University,
Abstract Devices for storage the electrical energy have become increasingly attractive. Fuel cell is a clean and efficient source of electricity. One of the most important factors to increase the density of energy and optimization of the fuel cell stack is utilization of maximum power point tracking (MPPT) algorithm [1]. In this paper a particle swarm optimization (PSO) maximum power point tracking is proposed. Simulations are performed in MATLAB/SIMULINK software. A system includes one proton exchange membrane & 6 KW fuel cell, a DC/DC converter, a resistive load and a maximum power point tracking algorithm control is analyzed and simulated. The simulation result of the proposed PSO MPPT is compared with a (P&O) method. The results verify the accuracy of the proposed scheme. Also the results show that the proposed method has better characteristic and performance in compare with P&O methods.[2]
Keywords: Maximum Power Point Tracking, Particle Swarm Optimization, Fuel Cell, Perturb & Observe (P&O).
I. INTRODUCTION
As the global energy reduces rapidly, renewable energy such as should be used. Due to advantages as the pollution-free, low maintenance and no noise, fuel cells systems are gaining increasing importance as a renewable energy [1, 2]. Fuel cell is on of the more promising generation systems of electric power at present and is particularly interesting as vehicle propulsion components. Some of the present-day challenges are the production and optimization of the fuel cell use in fuel cells based systems. In order to optimization, the ability to extract the maximum power from a fuel cell is necessary. When a fuel cell is directly connected to an external load, its output power depends on both the internal electro-chemical reaction and the external load impedance. The system’s operating point is at the joint of the fuel cell’s I–V curve and the load line [3, 4].
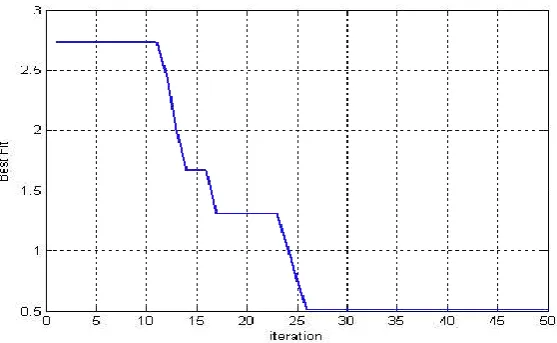
In this paper, a particle swarm optimization (PSO) algorithm, as called variable size of particle swarm optimization, is applied to track the maximum power point (MPP) of a fuel cell system is proposed. PSO is more suitable to search the global optimum in the fuel cell system. The PSO strategy is called variable size of particle swarm optimization. The moving step of particles in this algorithm is smaller than the traditional PSO. The strategy increases the movement step of particles at the initial iteration, and decreases it gradually with iteration. The particles are gradually close to the MPP of fuel cell until the iteration finish. In this paper the iteration is 50 that shows Fig 1.
II. PSOBASEDMAXIMUMPOWERPOINTTRACKINGOFFUELCELL
A. Concept of PSO Algorithm and the parameters &inputs of the fuel cell
strategy increases the movement step of particles at the initial iteration, and decreases it gradually with iteration. The particles are gradually close to the MPP of fuel cell until the iteration finish.[4]
B. Simulation Results
A system includes one proton exchange membrane fuel cell, a DC/DC converter, a resistive load and a maximum power point tracking algorithm control is analyzed and simulated. The simulations are performed in MATLAB/SIMULINK environment. The simulation result of the proposed PSO MPPT is compared with a conventional particle swarm optimization (PSO) and P&O (Perturb &Observe) method.[5]
The comparison between two algorithms shows that PSO algorithm has a better suitable response ratio P&O algorithm and it has arrived to maximum power point sooner at t=0.2s.
Results and P-I and V-I curves shows that the power of the fuel cell is completely nonlinear of ampere and severely are changed by changing of temperature .figure 4 shows the results.[5]
In this section the results of simulation shows the changing of the duty cycle to tracking maximum power point. Fig 5 & 6 shows the results.[5]
If we notice the fig 5 we can see one of the parameters of fuel cell that is T(k) and the other one is λ (humidity percentage or water content percentage). In this paper two parameters have compared to find the P-I and V-I curves. So membrane water content it means λ=11 and temperature T=343ºk have selected because we have gotten the best results. So fig 7 & 8 (P,V-t) & 9 &10(P,V-I) show the results.
Humidity percentage (membrane water content) and temperature (λ=11 , T=343ºk) are constant. So in this status the optimized power point has received to 6.625KW.[6]
When λ=11 is constant and T is changed up and down so we will get good results. fig 11 , 12 , 13 show. And the comparison shows in Table 1.
When λ (membrane water content) is variant and changed up and down and T is constant so we will get a good results. fig 14 , 15 shows. And the comparison shows in Table 2.
C. Figures and Tables
Fig.2: A sample model for Fuel Cell System .
Fig.4: Changing the temperature as a one the input parameters of fuel cell
Fig.5: duty cycle in simulation
Fig.6: Increasing and decreasing the duty cycle in simulation
Fig.8: V-t curve in normal operational condition in fuel cell λ = 11 & T=343ºk
Fig.9: P-I curve in normal operational condition in fuel cell λ = 11 & T=343ºk
Fig.10: V-I curve in normal operational condition in fuel cell λ = 11 & T=343ºk
Fig.12: P-I curve , λ=11 constant and T is variant.
Fig.13: P-t curve , λ=11 constant and T is variant and comparison with P&O algorithm.
Fig.14: Variation membrane water content versus time.
Table.1: Comparison Between PSO And P&O Approaches Results Under Fast Variation Of The Fuel Cell Temperature In Constant Membrane Water Content Λ=11.
Table.2: Comparison between PSO and P&O approaches results under fast variation of the membrane water content in constant temperature ( T=323ºk ).
CONCLUSION/RESULTS
In this paper, a new method for tracking of maximum power point of fuel cell is proposed. The fuel flow is adjusted with the maximum power points characterization curve, and the stack current is regulated to produce the desire output power. The results of the proposed PSO based maximum power point tracking are compared with P&O. The results verify the accuracy of the proposed MPPT optimization algorithm. Furthermore, the PSO method has more accurate and convergence speed than P&O method.
REFERENCES
[1]. M. Veerachary, T. Senjyu, and Katsumi Uezato, “Feed forward maximum power point tracking of PV systems using fuzzy controller”, IEEE Transactions on Aerospace and Electronic System, Vol. 38, No. 3, pp. 969-981, 2002.
[2]. Z. Z. dan, H. H. Bo, Z. X. Jian, C. G. Yi, R. Yuan, “Adaptive maximum power point tracking control of fuel cell power plants”, Journal of Power Sources, vol. 176, pp. 259–269, 2008.
[3]. J. Pukrushpan, A. Stefanopoulou, and H. Peng, “Modeling and control for PEM fuel cell stack system” Proceedings of the 2002 American Control Conference, vol. 4, pp. 3117 – 3122, 2002.
[4]. F. Barbir and T. G´omez, “Efficiency and economics of proton exchangemembrane (PEM) fuel cells” International Journal of Hydrogen Energy, vol. 22, pp. 1027–1037, 1997.