Journal of Pharmaceutical Technology
Research and Management
Journal homepage: https://jptrm.chitkara.edu.in/
1. Introduction:
Validation of the analytical procedure is an integral part of drug formulation development process. It ensures that the developed analytical method can be employed for detecting the amount of analyte in the sample and also the impurities if any. Validation of the UV-Visible Spectrophotometric method for a given drug can be achieved by determining the analytical characteristics- Linearity, Robustness, Precision, Accuracy, Limit of Detection and Quantification as per ICH Guidelines [1]. For determining these parameters, it is significant to have pre-requisite knowledge of operating a UV-Visible Spectrophotometer, preparation of serial dilutions, calibration curve development and mathematical knowledge for determining mean, standard deviation (SD) and percent relative standard deviation (% R.S.D.).
In recent times, herbal drugs are gaining attention for treating various disorders other than the conventional synthetic drugs. One such herbal drug is the Ellagic Acid with IUPAC name 2,3,7,8-tetrahydroxy(1) benzopyrano[5,4,3-cde][1]benzopyran-5,10-dione. It belongs to the class of polyphenols and is a dilactone of hexa-hydroxydiphenic acid [2] with structural formula C14H6O8 [3]. The pharmacokinetic parameters of ellagic acid are depicted in Figure 1. It is found in nuts (walnuts) and fruits like raspberries, strawberries, pomegranates, grapes and blueberries as ellagitannins [4]. It consists of 4-OH groups and some lactone rings which together make
its hydrophilic portion [4]. EA is poorly soluble in water (solubility ~9.7µg/ml) but is soluble in organic solvents like methanol (solubility is ~671µg/ml), N-methyl pyrolidone (NMP), Pyridine, Polyethylene glycol 400 (PEG 400), Triethanolamine (TEA) and in PEG 200 [2]. It is a multi-functional drug and has anti-oxidant, anti-atherosclerotic, anti-inflammatory and anti-proliferative activities. EA can be used in the treatment of many diseases such as cardiovascular diseases, neurodegenerative disorders and various forms of cancers (cancer of breast, brain, prostate, lungs, etc. [4]. So, it is vital to validate the UV-Spectroscopic method of Ellagic acid.
The proposed UV method is important and novel as in previous studies UV method has not been validated using PEG200 as a solubilizing agent for EA. Avachat et al., 2015 developed EA formulation as a complex of ellagic acid and phospholipid by dissolving ellagic acid in methanol and then determined the various parameters such as solubility, in-vitro dissolution studies, etc. through UV at wavelength 255nm [2]. Bala et al., 2006 had also validated the UV method for ellagic acid but the difference in his study and the current one is that they validated the method by dissolving ellagic acid in methanol and simultaneously preparing the dilutions of the standard solution in phosphate buffer pH 7.4[5], while in the current procedure the drug is dissolved in PEG200 with subsequent dilutions of the standard solution with water. UV method for ellagic acid with PEG200 was developed as the already existing procedure with methanol as
UV Method Development and Validation of Ellagic Acid for its Rapid Quantitative Estimation
Harsheen Kaur1, Arti Thakkar1 and Kalpana Nagpal1
1Amity Institute of Pharmacy, Amity University, Noida, UP- 201303, India.
*Email:[email protected]
ARTICLE INFORMATION ABSTRACT
Received: Nov. 01, 2018 Revised: Jan. 02, 2019 Accepted: Feb. 04, 2019 Published online: May 10, 2019
Development and validation of a simple UV- Spectroscopy method was done for the quantitative analysis of Ellagic Acid (EA). The stock solution of 50µg/ml was prepared and scanned, for which absorption maxima was found to be 277nm. Further dilutions to different concentrations (1-5µg/ ml) were prepared and analyzed at 277nm. The method so developed was validated as per ICH guidelines for: linearity, robustness, precision, accuracy, limit of detection and quantification. The Lambert- Beer’s law is followed in the range (1-5µg/ml) with correlation coefficient value 0.9994. It was observed that the method is precise and accurate for EA analysis with good recovery percent of 94.47% to 106.83%. The method developed was further employed for determining the entrapment efficiency of ellagic acid and its release from its nanoparticle dosage form. The method may be utilized for determining the concentration of EA when present as formulation and in combination with other drugs.
Keywords:
UV-Spectroscopy; Validation; Ellagic Acid; Correlation Coefficient; Precision; Robustness
methanol is comparatively costly, volatile and flammable in nature. In contrast, PEG200 is economical, biodegradable, non-volatile and has been certified as ‘safe’ for internal consumption by FDA [6]. Chen et al, 2006 developed UV method for EA quantification by taking NaOH as diluent, but in present study, the method was developed using PEG200 as a solubilizing agent followed by water as diluent [7]. Shah et al., 2017 also published the HPLC and HPTLC methods for estimation of ellagic acid in anti-diabetic formulations. This also prompted the study to be conducted using UV-Spectrophotometer as it is economical, easy and sensitive equipment, whereas HPLC is costly, complex and poorly sensitive for some herbal or nature origin compounds [3]. Briefly, this study aims at validating the UV analytical method for ellagic acid using PEG200 as a solvent of choice with λmax of 277nm.
2. Materials Used
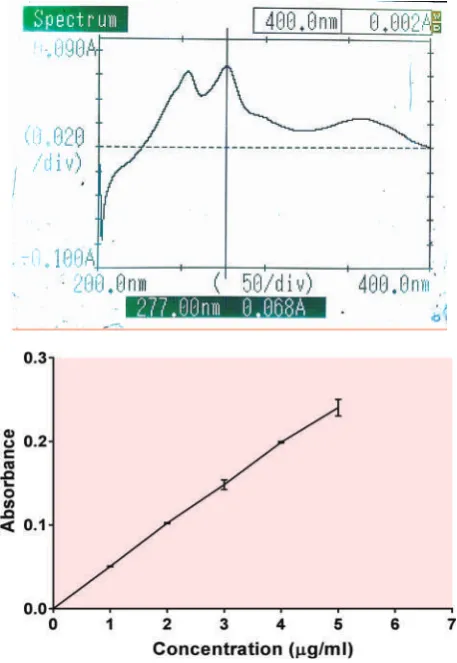
Instruments: The UV Spectroscopy was executed on double beam SHIMADZU spectrophotometer (UV vis-1800) along with 2nm spectral bandwidth while using 10mm matched quartz cuvettes. For reference as well as test solutions, the absorption spectra were obtained in the range 200–400 nm (Figure 2A). Shimadzu digital (AX 200) balance was used for weighing. The bath sonicator (Life Care Equipments Pvt. Ltd, India) was utilized for ultrasonication mediated solubilization of ellagic acid in PEG200.
Chemicals: The ellagic acid was obtained from HiMedia. All other chemicals were of high purity analytical grade and were used as received. A calibrated analytical balance was used for doing all the weighing. Calibrated glass wares were used throughout the study. Wherever water was to be utilized, double distilled water was used.
3. Experimental
3.1.
Method Development
3.1.1. Standard stock solution preparation
5 mg of drug was weighed and added to 10ml of PEG200 with subsequent sonication of the mixture so as to obtain complete dissolution of the drug in the solvent. 5ml of drug solution was withdrawn from the prepared solution and was diluted with distilled water to obtain 50µg/ml concentration. Further dilutions were carried out with distilled water to obtain the concentration in the range of 1-5 µg/ml.
3.1.2. Determination of λmax for Ellagic acid A scan was run in the UV-Visible Spectrophotometer taking 5µg/ml concentration (diluted from stock solution) as the
test sample (Figure 2A). The peak of maximum absorbance was obtained at 277nm for EA dissolved in PEG200. All the samples were hence analyzed at 277nm throughout the validation procedure.
3.1.3. Preparation of the calibration curve
From the stock solution, the samples with 1-5µg/ml concentrations range were prepared in triplicate and analyzed in the spectrophotometer at 277nm against 10% PEG200 solution in water as blank. Calibration curve was prepared as concentration v/s absorbance graph from the readings obtained in triplicate of each sample concentration (Figure 2B).
3.1.4. Correlation equation method
The concentration v/s absorbance graph was plotted in the GraphPad Prism 7 software. Trendline was formatted to obtain the intercept, slope, correlation coefficient and regression equation from the graph so obtained.
3.2.
Validation of the method
3.2.1. LinearityThe value for correlation coefficient and regression equation can be procured via the calibration curve for the straight line obtained.
3.2.2. Precision
To determine the precision, analysis of three different concentrations on a given day (intra-day) and on three different days (inter-day repeatability) was carried out. The resulting absorbance obtained was checked in terms of % RSD for determining the precision and repeatability of the analytical method as per ICH Guidelines [1].
3.2.3. Accuracy
Accuracy of the data was evaluated by recovery experiments using the standard addition method. This study was performed by spiking known amount of EA (80, 100 and 120%) to the 5µg/ml concentration. The amounts of standard recovered were calculated in terms of mean recovery with the upper and lower limits of % R.S.D [5,8].
3.2.4. Robustness
3.2.5. Limit of Detection (LOD) and Limit of Quantification (LOQ)
LOD and LOQ were calculated according to the 3s/m and 10s/m criterions, respectively, where s is the standard deviation of the absorbance (n = 10) of the blank sample and m is the slope of the corresponding calibration curve [10].
4. Application of the Validated Method
4.1
Entrapment Efficiency Determination
The validated UV method was utilized for the determination of entrapment efficiency of nanoparticles
containing ellagic acid. Once the nanoparticle pallet has been collected after centrifugation of the nanosuspension, the supernatant of formulations was filtered through 0.45 µm filter and their absorbance was measured for the amount of drug present in the supernatant using UV spectrophotometer. By applying the equation of the calibration curve as proposed by the GraphPad Prism 7.04 software, the corresponding concentrations were calculated. The amount of drug in supernatant (w) was then subtracted from the total amount of drug initially added during the preparation of nanoparticles. The percentage drug entrapment efficiency (DEE) was calculated using the formula[11]:
DEE The amount of drug(W) Free drug in supernatant (W) Total
=[ − ]
amount of drug(W) ×100
4.2
In-vitro Drug Release
The in vitro drug release from formulated nanoparticle batch was quantitatively estimated by using the calibration curve of validated UV method. Briefly, the drug-loaded nanoparticles (equivalent to specified amount of drug) were suspended in 5ml phosphate buffer saline (PBS, pH 7.4) and kept in the dialysis membrane bag (Himedia, MWCO, molecular mass cut off 12000–14000, pore size 2.4nm). The dialysis bag was kept in 200mL PBS (37±1°C; 50rpm). 5ml aliquots were collected and replaced with equal volume at regular time intervals. The collected aliquots were evaluated for the concentration of drug using the equation proposed by the GraphPad Prism 7.04 software [12].
5. Results and Discussion
The proposed analytical method is simple, convenient, accurate, economical and rapid for determining the concentration of EA. A wavelength maximum was obtained at 277nm for EA. The calibration curve developed after analyzing the concentrations from 1-5µg/ml in triplicate in UV-Spectrophotometer gave correlation coefficient of 0.9994 with regression equation y=0.04905x +0 and hence, slope value being 0.04905 and intercept being zero (Figure 1). The correlation coefficient value reflects that the spectroscopic procedure is in accordance with the Beer-Lambert’s Law. The precision and robustness of the analytical method was determined by calculating percent relative standard deviation (% R.S.D.) from the mean value indicating the accuracy of the procedure as per ICH Guidelines. % R.S.D. for intra-day precision was found to be in the range 1-3% (Table 1) whereas for inter-day precision was between 2-3% (Table 1). The results suggest that the developed UV method is precise
and provides recoverable data when analyzed on same day and also on different days but under similar environmental conditions. % R.S.D. for robustness was within 2-3.5% showing that the absorbance values deviated only less than 3.5% when determined on three consecutive wavelengths one proceeding the maximum wavelength procured, second being the maximum wavelength itself and third succeeding the lambda maxima (i.e. 276nm, 277nm and 278nm respectively) (Table 1). After spiking the additional EA to 5µg/ml solution, the range was found to vary from 94.47 % to 106.83 %, which depicts the accuracy of the developed UV method.
LOD value of the developed method for the drug substance was found to be 0.04µg/ml and LOQ obtained was 0.11µg/ml (Table 1). Thus, the developed method is sensitive and able to quantify the drug concentration in nano-gram levels.
Figure 2A. UV Sacn of Ellagic Acid 2B Calibration curve of Ellagic Acid at 277nm.
The %R.S.D. value was obtained below 4% and the correlation coefficient >0.99 (Table 1). This signify that the proposed UV-Spectroscopic method is valid and eligible for efficiently determining the concentrations of drug when present in an unknown amount, finding the drug entrapment efficiency, drug content, yield value, in-vitro dissolution studies of the drug formulation, thereby computing the cumulative drug release, quantification of the analyte in biological fluids, assessment of the drug even when present in very low dose, detecting amino acids, proteins, alkaloids, etc. So, it can be assumed that the method developed in current study can be extrapolated in future for determining the ellagic acid concentration in mouse and human plasma samples [12].
UV-Spectroscopy has also been recognized as a new Process Analytical Technology (PAT) for quantifying the
active pharmaceutical ingredients when present in low dose in the form of gels and suspensions [13]. In their study, the UV method was compared to the already existing PAT tool RAMAN Spectroscopy for estimating the API present in semisolid (gel) and liquid (suspension) in small quantities [13]. The average percent drug entrapment efficiency of ellagic acid encapsulated chitosan nanoparticles was found to be 86.21±3.73% and the percentage drug release was found to be 43.60±1.70% after 24 hrs.
Table 1. UV analytical method validation parameters
S.
NO. PARAMETER VALUE OBTAINED
1. λmax 277nm
2. Correlation coefficient, r 0.9994
3. Regression equation y = 0.04905x + 0
4. R2 value 0.9988
5. Slope 0.04905
6. Intercept 0
7. Precision-Intra-day (%R.S.D.) 1%–3%
8. Precision-Inter-day (%R.S.D.) 2%–3%
9. Robustness (%R.S.D.) 2%–3.5%
10. LOD (µg/ml) 0.04
11. LOQ (µg/ml) 0.11
12. Accuracy 94.47 % –106.83 %
6. Conclusion
The anticipated UV spectrophotometric method is sensitive, quiet uncomplicated, in-destructive, fast, exact, rigid and cost efficient. In terms of linearity, accuracy, precision, specificity, robustness and reproducibility, the method is validated. The acceptable results so obtained imply that the method developed is successful in carrying out the studies requiring the use of UV-Spectroscopy for the determination of concentration and strengths of the drug in the test substance and also the quantitative assessment of biochemical compounds such as proteins, alkaloids, flavonoids, etc.
7. Acknowledgement
The Authors are thankful to The Joint Head – Dr. Tanveer Naved, Amity Institute of Pharmacy and Deputy Vice Chancellor- Dr. Ajit Varma, Amity University AUUP for providing the necessary facilities.
8. Conflict of interest
Authors declare no conflict of interest.
References
[1] ICH (2005) Q2 (R1), Validation of Analytical Procedures: Text and Methodology, ICH Harmonized Tripartite Guidelines, 2005.
[2] Avachat A. M. and Patel V. G. (2015). Self nanoemulsifying drug delivery system of stabilized ellagic acid-phospholipid complex with improved dissolution and permeability. Saudi Pharm J., 23,
276–289. https://doi.org/10.1016/j.jsps.2014.11.001
[3] Shah, M. A., Patel, H. and Raj, H. (2017). Methods for the Estimation of Ellagic Acid and Curcumin in Antidiabetic Herbal Formulations - A Review. Eurasian J. Anal. Chem., 12, 295–311.
https://doi.org/10.12973/ejac.2017.00171a
[4] Mady, F. M. and Shaker, M. A. (2017). Enhanced anticancer activity and oral bioavailability of ellagic acid through encapsulation in biodegradable polymeric nanoparticles. Int. J. Nanomedicine, 12, 7405–7417.
https://doi.org/10.2147/IJN.S147740
[5] Bala, I., Bhardwaj, V., Hariharan, S. and Kumar, M. N. (2006). Analytical methods for assay of ellagic acid and its solubility studies. J. Pharm. Biomed. Anal, 40,
206–210.
https://doi.org/10.1016/j.jpba.2005.07.006
[6] Zhou, T., Xiao, X., Li, G. and Cai, Z. W. (2011). Study of polyethylene glycol as a green solvent in the microwave-assisted extraction of flavone and coumarin compounds from medicinal plants. J. Chromatogr. A, 1218, 3608–3615.
https://doi.org/10.1016/j.chroma.2011.04.031
[7] Chen Jia-hong, Wu Dong-mei, Wang Yong-mei, et al. (2007). Study on Quantitative Determination of Ellagic Acid by UV-spectrophotometry. Biomass Chemical Engineering, 41, 18–20
[8] Tiwari, G., and Tiwari, R. (2010). Bioanalytical method validation: An updated review. Pharmaceutical methods, 1(1), 25–38.
https://doi.org/10.1016/S2229-4708(10)11004-8
[9] Behera, S., Ghanty, S., Ahmad, F., Santra, S. and Banerjee, S. (2012). UV-Visible Spectrophotometric Method Development and Validation of Assay of Paracetamol Tablet Formulation. J. Anal. Bioanal. Techniques, 3, 151.
https://doi.org/10.4172/2155-9872.1000151
[10] Khanage, S. G., Mohite, P. B. and Jhadav S. (2013) Development and Validation of UV-Visible Spectrophotometric Method for Simultaneous Determination of Eperisone and Paracetamol in Solid Dosage Form. Adv. Pharm. Bull, 3, 447–451.
[11] Gopalakrishnan, L., Ramana, L. N., Sethuraman, S. and Krishnan, U. M. (2014). Ellagic Acid Encapsulated Chitosan Nanoparticles as Anti-hemorrhagic Agent. Carbohydr Polym., 111, 215–221.
https://doi.org/10.1016/j.carbpol.2014.03.093
[12] Nagpal, K., Singh, S. K. and Mishra, D. N. (2012). Nanoparticle mediated brain targeted delivery of gallic acid: in vivo behavioral and biochemical studies for improved antioxidant and antidepressant-like activity. Drug Deliv., 19, 378–391.
https://doi.org/10.3109/10717544.2012.738437
[13] Sharma, A., Thavathiru, E., Benbrook, D. M. and Woo, S. (2017). Bioanalytical method development and validation of HPLCUV assay for the quantification of SHetA2 in mouse and human plasma: Application to pharmacokinetics study. J. Pharm. Technol. Drug Res., 6. https://doi.org/10.7243/2050-120X-6-2
[14] Bostijn, N., Hellings, M., Veen, M. V. D., Vervaet, C. and Beer, T. D. (2018). In-line UV spectroscopy for the quantification of low-dose active ingredients during the manufacturing of pharmaceutical semi-solid and liquid formulations. Anal. Chim. Acta, 1013, 54–62.