O
ptimal
D
ata
A
nalysis
A Multidisciplinary Journal Specializing in Maximum-Accuracy Methods
Editor
Paul R. Yarnold, Ph.D.
Co-Editors
Fred B. Bryant, Ph.D.
Robert C. Soltysik, M.S.
tion. Review articles present reviews of theory, method, or empirical findings relating to the ODA para-digm. Method articles discuss technical aspects of optimal or heuristic algorithms and analytic pro-cesses. Versus articles compare alternative methodologies against one another. Application articles use optimal statistical analysis methods to address applied topics in any academic discipline. Software arti-cles discuss design or operation of existing or theoretical software systems which explicitly maximize (weighted) classification accuracy, and suboptimal heuristic systems which seek maximum accuracy.
Integrated System articles discuss theoretical or existing closed-system “black-box” or “robotic” appli-cations engineered using optimal analytic methods. Consulting articles highlight areas constituting con-sulting opportunities for proponents of optimal analytic methods. Research Notes give solutions to issues encountered in the research process relevant for maximizing predictive accuracy, and enable the rapid dissemination of notes about promising new research directions that may be of general interest to the maximum-accuracy community.
Editor
Paul R. Yarnold, Ph.D., Optimal Data Analysis
Co-Editor
Fred B. Bryant, Ph.D., Loyola University of Chicago
Robert C. Soltysik, M.S., Optimal Data Analysis
Associate Editor
Scott C. Leon, Ph.D., Loyola University of Chicago
Consulting Editor
Stephen M. Belknap, M.D., Northwestern University, Feinberg School of Medicine
William Collinge, Ph.D., Collinge and Associates
William Grobman, M.D., Northwestern University, Feinberg Medical School
Amy Herrold, Ph.D, Edward Hines Jr., VA Hospital
Demetrios N. Kyriacou, M.D., Ph.D.,
Northwestern University, Feinberg School of Medicine
June McKoy, M.D., M.P.H., J.D., M.B.A., Northwestern University, Feinberg School of Medicine
Kim T. Mueser, Ph.D., Dartmouth University
Marc H. Scheetz, PharmD, MSc, BCPS,
Midwestern University, Chicago College of Pharmacy
Hideo Suszki, Ph.D., Washington University School of Medicine
Kevin P. Weinfurt, Ph.D., Duke University
Manuscript Submission. Electronically submit one copy of the manuscript in Microsoft WordTM 97-2003 or later, to: [email protected]. Follow
Instructions to Authors (see Table of Con-tents). Opinions and statements published are the responsibility of the authors, and do not necessarily represent policies of Optimal Data Analysis, LLC, or views of Editors.
Copyright and Permissions. Authors must obtain permission from the Editor and origi-nal author in order to reproduce an article of 500 or more words: permission is usually granted if the ODA copyright notice is in-cluded on the first page of reproduced mate-rial. Permission from ODA is waived for authors wishing to reproduce a single table or figure from an article, provided the au-thor’s permission is granted, and that credit is given to ODA as copyright holder and to the author via a citation (there is a $25 ser-vice fee for a letter from the Editor permit-ting such reproduction). Authors wishing to reproduce more than a single table or figure for commercial purposes must obtain per-mission from the Editor. Perper-mission is waived for authors wishing to reproduce their own material for personal use, and for the photocopying of isolated journal articles for nonprofit classroom or library use by instructors and educational institutions. Access services may use unedited abstracts without permission of ODA or author. Libraries may photocopy articles beyond limits of U.S. copyright law by obtaining permission from the editor: submit requests to [email protected].
Reprints. Authors may print copies of their own and other articles, and/or may order any requested number of reprints when they receive notification that their article has been accepted for publication, or at any subsequent time. For information please see webpage.
Single Releases, Custom Issues, and Back Volumes. For information on soft-or hard-bound copies of single releases (the equiva-lent of a print issue), custom issues (a subset of articles hand-selected as a special collec-tion), or back volumes (all articles from an entire year), please see webpage .
Microform editions. For information regarding microform editions please contact Optimal Data Analysis.
Optimal Data Analysis (ISSN 2155-0182) is published in real time in one volume per year by Optimal Data Analysis LLC, 1220 Rosecrans St., Suite 330, San Diego, CA 92106. There is no subscription fee, and there is no manuscript submission fee. Articles published in Optimal Data Analysis
A Multidisciplinary Journal Specializing in Maximum-Accuracy Methods
Preface
1 Preface to Volume 2
Paul R. Yarnold
Invited
2-6 How to Create an ASCII Input Data File for UniODA and CTA Software
Fred B. Bryant and Patrick R. Harrison
Review
7-18 Initial Use of Hierarchically Optimal Classification Tree Analysis in Medical Research
Paul R. Yarnold
Method
19-25 Maximizing the Accuracy of Multiple Regression Models via UniODA: Regression Away From the Mean
Paul R. Yarnold, Fred B. Bryant, and Robert C. Soltysik
26-30 Statistical Power of Optimal
Discrimination with One Attribute and Two Classes: One-Tailed Hypotheses
Robert C. Soltysik and Paul R. Yarnold
31-36 Assessing Hold-Out Validity of CTA Models Using UniODA
Paul R. Yarnold
37-42 Modeling Individual Reactivity in Serial Designs: An Example Involving
Changes in Weather and Physical Symptoms in Fibromyalgia
Paul R. Yarnold, Robert C. Soltysik, and William Collinge
63-68 Minimum Standards for Reporting UniODA Findings
Paul R. Yarnold
86-93 Minimum Standards for Reporting UniODA Findings for Class Variables with Three or More Response Categories
Paul R. Yarnold
94-97 Ipsative Standardization is Essential in the Analysis of Serial Data
Paul R. Yarnold and Robert C. Soltysik
106-119 Standards for Reporting UniODA Findings Expanded to Include ESP and All Possible Aggregated Confusion Tables
Paul R. Yarnold
143-147 The Most Recent, Earliest, and Kth Significant Changes in an Ordered Series: Traveling Backwards in Time to Assess When Annual Crude Mortality Rate Began Increasing in McLean County, North Dakota
Paul R. Yarnold
148-153 Comparing Attributes Measured with “Identical” Likert-Type Scales in Single-Case Designs with UniODA
Paul R. Yarnold
154-156 Comparing Responses to Dichotomous Attributes in Single-Case Designs
Paul R. Yarnold
159-171 Ascertaining an Individual Patient’s
Symptom Dominance Hierarchy: Analysis of Raw Longitudinal Data Induces Simpson’s Paradox
Many Response Options
Paul R. Yarnold
177-190 Univariate and Multivariate Analysis of Categorical Attributes with
Many Response Categories
Paul R. Yarnold
222-227 Confirmatory Analysis for an Ordered Series of a Dichotomous Attribute: Airborne Radiation and Congenital Hypothyroidism of California Newborns
Paul R. Yarnold and Robert C. Soltysik
228-231 Exploratory Analysis for an Ordered Series of a Dichotomous Attribute: Airborne Radiation and Congenital Hypothyroidism of California Newborns
Paul R. Yarnold and Robert C. Soltysik
232-234 Statistical Evaluation of the Findings of Qualitative Comparative Analysis
Paul R. Yarnold
Versus
43-47 Reverse CTA vs. Multiple Regression Analysis
Paul R. Yarnold and Robert C. Soltysik
48-53 Manual vs. Automated CTA: Predicting Freshman Attrition
Paul R. Yarnold, Fred B. Bryant, and Jennifer Howard Smith
198-201 ODA Range Test vs. One-Way Analysis of Variance: Comparing Strength of Alternative Line Connections
Paul R. Yarnold and Gordon Brofft
206-210 ODA Range Test vs. One-Way Analysis of Variance: Patient Race and
Lab Results
Paul R. Yarnold
Application
54-59 Comparing Knot Strength with UniODA
Paul R. Yarnold and Gordon Brofft
72-75 Maximum-Accuracy Multiple Regression Analysis: Influence of Registration on Overall Satisfaction Ratings of Emergency Room Patients
Paul R. Yarnold
76-85 Assessing Technician, Nurse, and Doctor Ratings as Predictors of Overall Satisfaction of Emergency Room Patients: A Maximum-Accuracy Multiple Regression Analysis
Paul R. Yarnold
98-105 Statistically Significant Increases in Crude Mortality Rate of North Dakota Counties Occurring After Massive Environmental Usage of Toxic
Chemicals and Biocides Began There in 1998: An Optimal Static Statistical Map
Paul R. Yarnold
120-142 Trajectory of Crude Mortality Rate in North Dakota Counties
Paul R. Yarnold
211-216 Surfing the Index of Consumer Sentiment: Identifying Statistically Significant Monthly and Yearly Changes
Paul R. Yarnold
217-219 Determining When Annual Crude Mortality Rate Most Recently Began Increasing in North Dakota Counties, I: Backward-Stepping Little Jiffy
Software
157-158 How to Create a Data Set with SAS™ and Compare Attributes with UniODA™ in Serial Single-Case Designs
Paul R. Yarnold
191-193 Creating a Data Set with SAS™ and Maximizing ESS of a Multiple
Regression Analysis Model for a Likert-Type Dependent Variable using
UniODA™ and MegaODA™ Software
Paul R. Yarnold
194-197 MegaODA Large Sample and BIG DATA Time Trials: Separating the Chaff
Robert C. Soltysik and Paul R. Yarnold
202-205 MegaODA Large Sample and BIG DATA Time Trials: Harvesting the Wheat
Robert C. Soltysik and Paul R. Yarnold
220-221 MegaODA Large Sample and BIG DATA Time Trials: Maximum Velocity Analysis
Paul R. Yarnold and Robert C. Soltysik
Research Notes
60-61 Percent Oil-Based Energy Consumption and Average Percent GDP Growth: A Small Sample UniODA Analysis
Paul R. Yarnold
69-70 Analysis Involving Categorical Attributes Having Many Categories
Paul R. Yarnold and Fred B. Bryant 71 UniODA and Small Samples
Paul R. Yarnold
Other
62 Author Instructions Special Calls
Optimal Statistical Software
1
Preface to Volume 2
Paul R. Yarnold, Ph.D.
Optimal Data Analysis, LLC
Manucripts published in Optimal Data Analysis (ODA) are parsed into sections, more of which are added as new domains of inquiry arise. Not every Release of every Volume presents articles in every sec-tion. Sections in this Volume, and the articles they host, are briefly de-scribed below.
Invited features articles by Editor invitation. The lead article discusses preparation of an ASCII input data file for analysis by UniODA and CTA software.
Review gives reviews of theory, method, or empirical findings regarding ODA paradigm. The lead article reviews use of hierarchically optimal CTA in empirical medicine before and during the early availability of automated software.
Method has articles about technical aspects of optimal and heuristic algorithms and analytic processes. The lead paper shows how accuracy in the prediction of extreme scores can be greatly improved if UniODA is used to optimize multiple regression analysis (MRA)-based model decision thresholds: regression away from the mean. The second paper investigates statistical power of optimal discrimination for prob-lems with one attribute, a class variable having two class categories, and one-tailed (confirmatory) hypotheses. The third manuscript illustrates how to assess hold-out validity of CTA models with UniODA. The fourth paper discusses predicting individual reactivity in longitudinal designs. The fifth article outlines the first set of minimum standards for reporting of UniODA findings for binary class variables, and the sixth article extends this to UniODA designs involving class variables with three or more response categories, and involving confirmatory or ex-ploratory hypotheses. The seventh paper demonstrates that the use of an ipsative transformation is essential in analysis of serial data. The eighth paper extends the sixth paper, recommending reporting of ESP (effect strength for predictive value) and all possible aggregated confusion tables. The ninth paper discusses how to identify the initial, most recent, and Kth statistically significant change in an ordered series, investigating the series backwards or forwards. The tenth paper discusses how to compare attributes assessed on Likert-type scales for a single individual using UniODA, and shows that physically identical scales are not psy-chologically identical when used by a single rater to evaluate different phenomena. Article eleven discusses comparing binary attributes in single-case designs. Manuscript twelve conducts an integrated analysis of longitudinal N-of-1 symptom ratings, findings that analysis of raw scores induces Simpson’s paradox. Paper thirteen discusses how to disentangle effects involving categorical attributes with many response levels, and paper fourteen discusses univariate and multivariate analysis of designs in which all variables are categorical. Paper fourteen shows how to conduct confirmatory hypothesis-testing for an ordered series of a dichotomous attribute, and paper fifteen demonstrates exploratory analyses. Paper sixteen shows how to statistically evaluate the findings of Qualitative Comparative Analysis.
Versus presents articles featuring alternative methodologies (at least one optimal) competing. The lead paper demonstrates reverse CTA for an application with an ordered class variable and categorical attributes and finds that reverse CTA is more intuitive and actionable than multiple regression analysis. The second article compares manu-ally-derived versus auto-enumerated CTA models of freshman college
attrition: when benefits of success and costs of failure are high, a de-tailed CTA model can suggest strategies that offer hope for control and forecasting. The third and fourth articles compare newly-developed optimal range test methodology versus one-way ANOVA.
Application presents articles which use optimal statistical methodology to address any applied topics in all academic disciplines. The lead paper uses UniODA to compare the strength of popular big-game fishing knots. The second article illustrates the construction of static optimal statistical maps for an a priori hypothesis concerning increase in annual crude mortality rate (ACRM) in North Dakota after massive usage of toxic chemicals and biocides began in the environment in 1998 (ODA, LLC makes no express or implied warranty or represen-tation regarding completeness or exactness of artists’ drawing. The third article presents the trajectory of ACRM in North Dakota counties, and the fourth paper analyzes recent changes in the Index of Consumer Sentiment. Paper five uses a backward-stepping little jiffy via UniODA to determine when ACRM first started to rise in counties of North Dakota, and paper six uses serial N-of-1 analysis to study changes from one year to another, thereby defining a class-variable series.
Software articles discuss design/operation of existing or the-oretical software which explicitly maximizes (weighted) classification accuracy, and suboptimal heuristic systems which seek maximum accu-racy. The lead article shows how to create a data set for comparing attributes in a serial single-case design using UniODA. Paper two shows how to create and analyze a data set needed in order to maximize ESS of a multiple regression analysis-based model. The third article presents a time-trial of MegaODA software, the latest release of UniODA software for large samples and BIG DATA, used in ruling-out effects that are not statistically reliable; the fourth presents rule-in trials for documenting statistically significant effects for problems involving ordered attributes.; and the fifth discusses analyses of 2x2 cross-classification tables.
Research Notes give solutions to issues encountered in the research process relevant for maximizing predictive accuracy, and enable the rapid dissemination of notes about promising new research directions that may be of general interest to the maximum-accuracy community. The lead note uses UniODA to address an a priori hypothe-sis in an application with two groups, an ordered attribute, and eight observations. The second note discusses analysis of categorical attributes with many categories. The third note addresses using UniODA with minute samples.
Special Calls are published periodically, herein is the first:
maximum-accuracy multiple regression analysis (MRA). A pair of lead articles assesses the influence of the registration process, and interactions with technicians, nurses and doctors, on patient ratings of overall satisfaction with care received in the Emergency Room; introduce aggregated confusion tables as a conceptual aide in the interpretation of optimized MRA models; and serve as sample templates for the special call.
Author Notes
2
How to Create an ASCII Input Data File
for UniODA and CTA Software
Fred B. Bryant & Patrick R. Harrison
Loyola University Chicago
UniODA and CTA software require an ASCII (unformatted text) file as input data. Arguably the most difficult task an operator faces in conducting analyses is converting the original data file from (a) whatever software package was used to enter the data, into (b) an ASCII file for analysis. This article first highlights critical issues concerning missing data, variable labels, and variable types that users must address in order to convert their data into an ASCII file for analysis using ODA software. Specific steps needed to convert a data set from its original file-type into a space-delimited ASCII file are then discussed. The process of converting data into ASCII files for use as input data is illustrated for three leading statistical software packages: SPSS, SAS, and STATISTICA.
ODA-based software such as UniODA and CTA requires only a few easy-to-understand control commands to conduct powerful, accurate non-linear modeling. Ironically, given the simplicity of ODA software syntax, the most difficult task for users to complete in conducting analyses is often the creation of an ASCII data file for ODA software to analyze. But, with a little fore-thought and attention to detail, this critical task is simple and straightforward.
Researchers often use statistics software such as the Statistical Package for the Social Sciences (SPSS), Statistical Analysis System (SAS), or STATISTICA, for example, to enter and process raw data. In contrast, ODA software requires a delimited ASCII file (i.e., an unfor-matted text file) as input data. Typically, spaces, tabs or commas are used to separate the data entries in an ASCII file. These delimiters
enable ODA software to read input data in free form without requiring operators to specify for-matting, making it easier to implement analysis. This paper explains how to create ASCII files which use spaces as delimiters separating data entries.
Initial Issues to Resolve
Before converting data from the original file type into an ASCII file, three basic issues must be resolved: (1) the handling of missing data; (2) the creation of variable labels having usable format; and (3) the transformation of alphabetic string variables into a quantified form which CTA can analyze.
3
space and use the next numeric value in the data set to stand in for the missing value. Therefore,
before converting their data into an ASCII file for ODA analysis, users must replace any system-missing “blank” values (e.g., a “.” in SPSS or SAS) with a numeric value designating a missing response. This conversion can easily be accomplished by using the original statistical software package to recode each variable so as to replace whatever values were originally used to indicate missing data with a chosen, global missing-value indicator (e.g., -999). Note, however, that this task must be done before one converts the original data set into an ASCII file.
Observed values are often missing for at least some cases on one or more variables in a data set. Researchers typically use blank spaces to indicate missing values in the original data file or use one or more specific numeric values (e.g., -9, 99, 999) to designate missing responses for different variables. Before creating an ASCII file, users must first convert the value(s) which are being used to represent missing values for each variable—such as blank spaces or numeric values—into a single numeric value to be used to designate all missing values for every variable in the data set.
Yarnold and Soltysik1 emphasized the importance of specifying missing values when creating ASCII files for analysis by ODA: “A very important point that one cannot overlook is that all system missing data must be changed to a specified missing numeric value prior to analysis via ODA” (p. 55). A popular choice for a universal missing-value indicator is -999. Of course, using -999 as a marker for missing values assumes that this is not a valid response for any variables included in the data set. If the value -999 is a valid response for any variable in the data set, then a value which is not a valid response should be selected instead.
Saving variable labels in usable format. In UniODA and CTA software, variable labels may be no longer than eight characters, so users of general-purpose statistical software, such as
SPSS, SAS or STATISTICA, should ensure that the variable names consist of no more than eight characters before exporting their data set for ODA. Otherwise, ODA software will be unable to read the names of variables having more than eight characters and will produce an error message. Alternatively, users can export varia-ble names longer than eight characters, and use a text file editor to truncate variable names to a maximum of eight characters in the exported ASCII file. However, changing variable names to a maximum of eight characters in the original source data file makes it easier to verify the accuracy of the exported ASCII data file, when comparing descriptive statistics from the origi-nal and exported data sets.
Transforming alphabetic variables into numeric form. Some variables in the original data set may consist of alphabetic or “string” values, rather than numbers. Examples of such alphabetic variables are gender (e.g., “male” or “female”), religious affiliation (e.g., “Catholic,” “Protestant,” “Jewish,” “Buddhist,” “Muslim,” or “none”), or ethnicity (e.g., “White,” “Black,” “Hispanic,” “Asian,” or “Other”). To analyze such string variables in ODA, users must first recode each alphabetic value of the variable into a numeric value (e.g., “female”=0, “male”=1; “White”=1, “Black”=2, “Hispanic”=3, “Asian”= 4, “Other”=5). After converting all alphabetic values to numeric values, users should save the data file, carefully noting which variable is the class variable, which attributes are ordered, and which attributes are categorical (string variables typically reflect the latter). The ASCII data file to be analyzed by UniODA and CTA software should contain only numeric values, delimited by spaces.
4
number). Excluding unused variables will make the ASCII data file as small as possible and will minimize the time required to obtain final CTA results. Alternatively, one can choose to export only a subset of the variables from the full data set when constructing an ASCII data set.
For the UniODA and CTA programs to access the data file, users should assign the exported ASCII file a name that is no more than 8 characters, followed by a dot and 3 characters (e.g., CTA_RUN1.DAT). Finally, if applicable, users should cut and paste the variable labels from the first line of the exported ASCII data file into a separate ASCII file, to serve as part of the VARIABLES control command in the syntax file for the UniODA or CTA programs.
Examples of Syntax Files for Exporting a Source Data File as an ASCII Data File
Driven by both pull-down menus and syntax, SPSS is perhaps the most commonly used statistical program in academia. Imagine an SPSS data file (ODAdata.sav) containing 20 variables, 12 of which are to be exported into a space-delimited ASCII data file (ASCIIdat.dat) for analysis by ODA software.
After opening ODAdata.sav in SPSS, the SAVE TRANSLATE command may be used to convert the active SPSS data file into a space-delimited ASCII data file, as follows:
SAVE TRANSLATE OUTFILE='C:\Documents and Settings\localuser\Desktop\ASCIIdat.dat' /TYPE=CSV
/MAP /REPLACE /FIELDNAMES
/TEXTOPTIONS DELIMITER=' ' /KEEP=v1 v2 v3 v4 v5 v6 v7
v8 v9 v10 v11 v12.
Here, the subcommand: OUTFILE='C:\ Documents and Settings\localuser\Desktop\ ASCIIdat.dat' is used to instruct SPSS to save the exported ASCII file (which we have named
ASCIIdat.dat) to the Windows desktop. Users should alter this subcommand to specify the correct path to the folder on their hard drive where they wish to save the ASCII file.
The /TYPE=CSV subcommand specifies that the exported data file will be in text-file (ASCII) format.
The /MAP subcommand displays in the SPSS output a list of the variables and the number of cases exported in the ASCII data file. The /REPLACE subcommand gives SPSS permission to overwrite an existing ASCII file of the same name. Because the default is not to overwrite an existing ASCII file, SAVE TRANSLATE will not overwrite an existing file without an explicit REPLACE subcommand. If users wanted to prevent the possibility of overwriting an existing ASCII file, then they could omit the /REPLACE subcommand.
The /FIELDNAMES subcommand is used to instruct SPSS to write variable names separated by a delimiter (see below) in the first row of the ASCII data file. As noted earlier, before implementing CTA, users should cut and paste the variable labels from the first line of the exported ASCII data file into a separate ASCII file, to serve as part of the VARIABLES control command in the syntax file for ODA programs.
The /TEXTOPTIONS DELIMITER=' '
subcommand instructs SPSS to employ a blank space (empty column) to delimit or separate variable names and data values in the exported ASCII file.
The /KEEP subcommand may be used to export to the ASCII data file either: (a) all of the variables in the active SPSS data (by specifying
/KEEP=ALL); or (b) a subset of the variables in the in the active SPSS data (by specifying
/KEEP=<variable names separated by spaces>, as in the example above). Also, the /KEEP
5 SAS is another popular statistical soft-ware program, which is widely used in business analytic settings for operations research, data mining, and predictive modeling. Imagine a SAS data file ODADdat containing 20 vari-ables, 12 of which are to be exported into a space-delimited ASCII data file (ASCIIdat.dat) for analysis by ODA software.
In SAS, the PUT command may be used to convert the active SAS data file into an ASCII data file, as follows:
DATA ODAdata2; SET ODAdata;
FILE 'C:\Documents and Settings\localuser\ Desktop\ASCIIdat.dat';
PUT v1 v2 v3 v4 v5 v6 v7 v8 v9 v10 v11 v12; RUN;
The DATA command begins the process of data restructuring in SAS. The command
DATA ODAdata2 instructs SAS not to overwrite the active SAS data set (i.e., ODAdata), but to give the new, restructured data set the name ODAdata2 (later changed to ASCIIdat.dat using the FILE command).
The SET command reads all variables and observations from the SAS input data set.
The FILE command renames the re-structured data set and writes the contents of the active data set to an external ASCII file.
The PUT command outputs the listed variables to the ASCII data specified in the
FILE command.
The RUN command has SAS process the set of commands listed in the syntax file.
Note that the above SAS commands do
not output the variable names to the first line of the ASCII data file. However, users can use the following commands to enter variable names on line 1 of the ASCII file (followed by space-delimited data):
DATA ODAdata2 (keep= v1 v2 v3 v4 v5 v6 v7 v8 v9 v10 v11 v12);
SET ODAdata;
FORMAT v1 v2 v3 v4 v5 v6 v7 v8 v9 v10 v11 v12 10.6;
PROC EXPORT DATA=ODAdata2 OUTFILE ='C:\Documents and Settings\localuser\Desktop \ASCIIdat.dat' DBMS=DLM REPLACE;
RUN;
Note that this method requires that a FORMAT command is used to prevent rounding of exported values, as indicated. The FORMAT command uses the value of “10.6” to tell the SAS program to allot a total of 10 spaces with 6 decimal points for each exported variable.
STATISTICA is another popular data
analysis program, commonly used in healthcare, financial services, insurance, and consumer pro-duct industries. Imagine a STATISTICA data file named ODAdata.sta containing 20 vari-ables, 12 of which are to be exported into a space-delimited ASCII data file (ASCIIdat.dat) for analysis by ODA software.
With STATISTICA the Windows drop-down menu may be used to export the active data set into a comma-delimited ASCII data file by first opening the data file (ODAdata.sta). To export only 12 of the 20 variables in the data set, first delete the variables which will not be exported. Then click on “Save As…” under the File command on the top left-hand side of the main Data Editor screen. In the Save Data As window, click on the down arrow to the right of the “Save as type” box, and select “Text file (*.txt).” Users should then specify the name of the ASCII output file in the “File name box” using the *.txt extension (e.g., ODAdata.txt) and the location in which to save this file, and click on the Save command. STATISTICA will re-spond by warning users that the data file “may contain features that will be lost when saved as text” and asking them if they “want to export the Spreadsheet in this format.” Users should click on “Yes.”
6
on “Space”), and writing the variable names separated by the delimiter in the first row of the ASCII data file. Finally, to create the ASCII space-delimited data file, users should click on the Save command. As noted earlier, before implementing ODA software, users should cut and paste the variable labels from the first line of the exported ASCII data file into a separate ASCII file, to serve as part of the VARIABLES command in the syntax file for ODA programs.
Verifying the Accuracy of the ASCII Data File Before Running UniODA or CTA
Before running UniODA or CTA, it is essential first to check the accuracy of the ASCII data file by comparing it to the original data set. To check the accuracy of the exported ASCII file in relation to the original (source) data file, follow the following six steps.
First, run descriptive statistics on the variables in the original data file, using the statistical software employed to enter the raw data originally (e.g., SAS, SPSS, etc.).
Second, replace all blanks and other missing data values with a valid value, such as -999, which will be used to designate missing values in ODA software.
Third, export the original (source) data file into an ASCII format, making sure to export the variable labels on the first line of the ASCII data file. We recommend exporting data as a space-delimited ASCII file.
Fourth, import the exported ASCII file back into the original statistical software (e.g., in SPSS use the “Read Text Data” option beneath the “File” drop-down menu).
Fifth, after importing the exported ASCII data file, use the statistical software to designate values of -999 as missing.
Finally, run descriptive statistics, and compare the results for equivalence with the initial set of descriptive statistics.
If the first and second sets of descriptive statistics are identical, then one can be confident of having accurately exported the original data set into an ASCII format. If the two sets of descriptive statistics based on the original and imported ASCII data do not match perfectly, then pinpoint the source of the problem and repeat the process until perfect correspondence is obtained. Although there are countless mis-takes one can make when converting an original data set into a space-delimited ASCII data file, the most common errors include forgetting to change blank data entries to a specific missing numeric value, forgetting to convert alphabetic string variables into numbers, exporting variable names that exceed the maximum of 8 characters, and failing to export all of the variables from the original data set that one wishes to analyze.
References
1
Yarnold PR, Soltysik RC (2005). Optimal data analysis: A guidebook with software for Win-dows. APA Books, Washington, DC, 2005.
Author Notes
7
Initial Use of Hierarchically Optimal
Classification Tree Analysis
In Medical Research
Paul R. Yarnold,
Ph.D.
Optimal Data Analysis, LLC
Initial use of hierarchically optimal classification tree analysis in medicine and allied health disciplines is reviewed.
Univariate optimal discriminant analysis (UniODA) is a non-parametric classification methodology for discriminating between two categories of a binary class (“dependent”) varia-ble—such as sex (male versus female), experi-mental condition (drug versus placebo), or out-come (dead versus alive)—using a single attrib-ute (independent variable).1 Hierarchically op-timal classification tree analysis (CTA) is a non-parametric, non-linear, multiattribute (i.e., ap-propriate for use with more than one attribute) classification methodology for discriminating a binary class variable, which is accomplished by chaining together successive UniODA models.2
CTA and UniODA explicitly maximize model accuracy—operationalized by the effect
strength for sensitivity (ESS) index, which is a function of the mean sensitivity achieved by the model across all class categories (the sensitivity of a model for category X is the ability of the model to accurately classify members of cate-gory X). For a binary class variable the mean of “sensitivity” and “specificity” (epidemiological terms for model sensitivity for class categories 1 and 0, respectively) is used in computing ESS, which ranges between 0 (the level of accuracy expected by chance) and 100 (errorless classifi-cation). By rule-of-thumb, ESS values less than
25 reflect weak effects; values less than 50 indi-cate moderate effects; and values of 50 or greater reflect strong effects.1
8
AaPo2
Age Prior AIDS
Age Body
Mass Index
35.4% N = 113
43.8% N = 16
33.3% N = 69 8.8%
N = 34
23.1% N = 359 8.1%
N = 602
p < 0.0001
p < 0.0005 p < 0.02
p < 0.008 p < 0.053
< 49.5 mm Hg > 49.5 mm Hg
< 49.2 Yr > 49.2 Yr
< 19.6 kg/m2 > 19.6 kg/m2
No Yes
< 51.3 Yr > 51.3 Yr
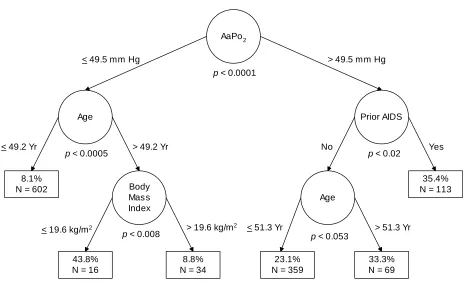
Figure 1: Schematic Illustration of Initial CTA Model of PCP Mortality
Using the CTA model to classify indi-vidual patients is straightforward. For example, imagine a hypothetical 57-year-old patient without prior AIDS had AaPo2=51.1 mm Hg, and body mass index=21.3 kg/m2.
Starting with the root node, since this patient has AaPo2>49.5 mm Hg, the right-hand branch is appropriate. At the next node, since the patient did not have prior AIDS, the left-hand branch is appropriate. Finally, at the next node, because the patient was older than 51.3 Yr, the right-hand branch is appropriate. As seen in Figure 1, 69 patients were classified into the corresponding endpoint presently, and of them one-third—23 patients—died in-hospital.
If the hypothetical patient was younger than 51.3 years then the right-hand branch would have been appropriate, corresponding to an endpoint with 34 patients of whom only three died in-hospital.
9
Table 1: Confusion Table for Initial CTA Model of PCP Mortality Predicted Mortality Status
Alive Deceased
Actual Alive 860 128 Specificity = 87.0% Class
Status Deceased 135 70 Sensitivity = 34.1% Predictive Value
Negative Positive = 86.4% = 35.4%
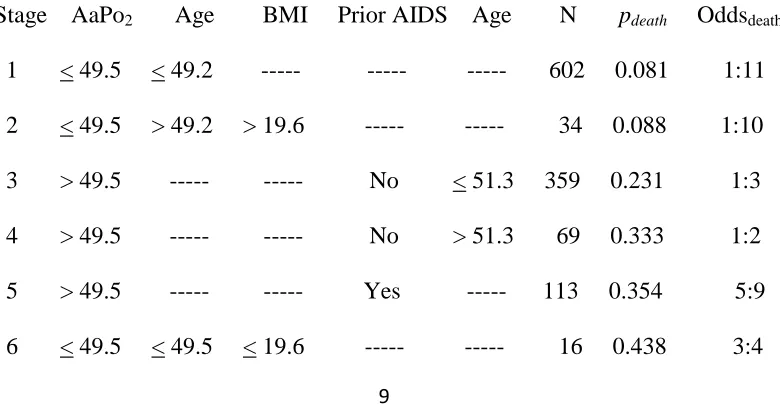
Staging tables are constructed based upon the findings of a CTA model, as presented for the current example in Table 2. Rows in the staging table are model endpoints reorganized in terms of increasing order of percent of class 1 (dead) membership. Using the staging table to classify individual patients is straightforward. For example, consider the same hypothetical patient discussed earlier, when illustrating how to use the CTA model to classify observations. The staging table is used from left to right. Thus, in the first step of using the staging table, since the patient’s AaPo2>49.5, stages 1, 2 and 6 are inappropriate. In step two, age follows AaPo2 in the staging table and is therefore
eval-uated next. However, note that for stages 3, 4 and 5—one of which is necessarily appropriate for the hypothetical patient, there are dashes (indicating that one should skip the column) for age. In step three, body mass index is evalu-ated, but dashes in stages 3-5 indicate this does not apply for the hypothetical patient. In step four Prior AIDS is assessed, and since this pa-tient did not have prior AIDS, stage 5 is inap-propriate. Finally, in step five age is re-evalu-ated, and since the hypothetical patient is older than 51.3 years, stage 4 is appropriate. As seen, of the total of 69 patients classified into stage 4 in the study, pdeath=0.333 (i.e., one-third died
in-hospital), and the odds of mortality are 1:2. Table 2: Staging Table for Initial CTA Model of PCP Mortality
10
Stage is an ordinal index of severity of illness, and pdeath is a continuous index: increas-ing values on either of these indices indicate worsening disease. Compared to the first and second stages, the third stage reflects a 2.7-fold difference in the likelihood of dying in-hospital; stages four and five reflect a 4-fold difference; and stage six reflects a 5.2-fold difference in the likelihood of dying in-hospital.
Subsequent research using the ordinal severity staging algorithm to create a prognostic index has confirmed stage as a powerful ordinal risk factor for in-hospital mortality from PCP.4,5
Recently, with increasing use of PCP prophylaxis and multidrugantiretroviral therapy, the clinical manifestations of HIV infectionhave changed dramatically. Because predictors of inpatient mortality for PCP may have also changed, CTA was used to develop a new stag-ing systemfor predicting inpatient mortality for patients with HIV-associatedPCP admitted be-tween 1995 and 1997.6 Chart reviews were per-formed for 1,660 patients hospitalized with HIV-associatedPCP at 78 hospitals in seven metropolitanareas in the USA. CTAidentified a five-category staging system (ESS=33.1) using threepredictors: wasting, alveolar-arterial oxy-gen gradient (AaPO2), and serum albumin level. Mortality rate increased with stage:3.7% for Stage 1; 8.5% for Stage 2; 16.1% for Stage 3; 23.3% forStage 4; and 49.1% for Stage 5.
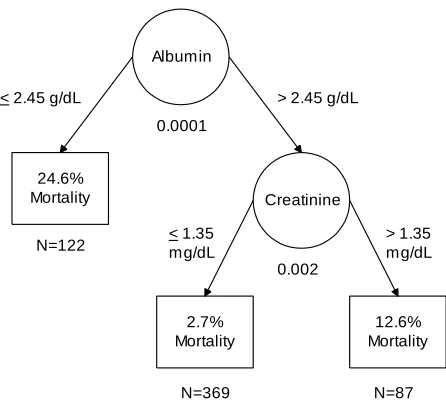
During the mid-1990s, community-ac-quired pneumonia (CAP) began to account for an increasing proportion of the pulmonary in-fections in people with HIV infection: hospital mortality rates for HIV-associated CAP ranged to 28%. A staging system was thus developed for categorizing mortality risk of patients with HIV-associated CAP using information availa-ble prior to hospital admission.7 The data were based on a retrospective medical records review of 1,415 patients hospitalized with HIV-associ-ated CAP from 1995 to 1997 at 86 hospitals in seven metropolitan areas. The overall inpatient mortality rate was 9.1%. Predictors of mortality
in the CTA model included presence of neuro-logic symptoms, respiratory rate of 25 breaths/ minute or greater, and creatinine>1.2 mg/dL. A five-category staging system was identified, yielding a mortality rate of 2.3% for stage 1, 5.8% for stage 2, 12.9% for stage 3, 22.0% for stage 4, and 40.5% for stage 5: ESS=45.5. It was concluded that the staging system is useful for guiding clinical decisions about the intensity of patient care, and for case-mix adjustment in research addressing variation in hospital mor-tality rates.
CTA was also used to discriminate CAP versus inhalational anthrax cases.8 Limiting the effects of a bioterrorist anthrax attack necessi-tates rapid detection of the earliest victims, so a study was conducted to improve physicians’ ability to rapidly detect inhalational anthrax victims. A case-control study compared chest radiograph findings from 47 patients from his-torical inhalational anthrax cases and 188 com-munity-acquired pneumonia control subjects. CTA was used to derive an algorithm of chest radiograph findings and clinical characteristics that accurately discriminated between inhala-tional anthrax and community-acquired pneu-monia. A nearly perfect CTA model (ESS= 98.3) involving three attributes (chest radio-graph finding of mediastinal widening, altered mental status, and elevated hematocrit) was 100% sensitive (95% confidence interval [CI], 73.5% to 100%) and 98.3% specific (95% CI, 95.1% to 99.6%).
The most recent investigation in this line of research used CTA to derive an algorithm for emergency department (ED) triage for rapid or-dering of chest radiography for CAP, which ac-counts for 1.5 million annual ED patient visits
in the US.9 An ED-based retrospective matched
11 was 70.8% sensitive (95% CI=60.7% to 79.7%) and 79.1% specific (95% CI=69.3% to 86.9%): ESS=49.9.
Encouraged by the initial and continuing success of CTA in modeling heretofore poorly-understood outcomes, the use of CTA began to proliferate across a variety of substantive areas within medicine. Areas of representation may be broadly categorized as representing clinical medicine, psychosocial aspects of medicine, and allied health disciplines. Research using CTA in these areas is reviewed below.
Clinical Medicine
CTA has been used in clinical medicine applications such as predicting adverse drug events (ADEs) using hospital administrative data in exploratory data-mining research, and pharmacoalgorithmics in confirmatory theory-building research; self-selection for interven-tional management on the basis of clinical and psychosocial factors; gestational age at delivery after placement of an emergent cerclage; and mortality from thienopyridine-associated throm-botic thrombocytopenic purpura, as well as from complications of HIV on the basis of nutritional information for a large observational database.
Hospital administrative data are appeal-ing for surveillance of ADEs because of their uniform availability, but expert-generated sur-veillance rules have limited accuracy. To assess whether rules based on nonlinear associations among available administrative data are more accurate, CTA was applied to administrative data, and used to derive and validate surveil-lance rules for predicting bleeding/anticoagula-tion and delirium/psychosis ADEs.10 Using a retrospective cohort design, a random sample of 3,987 patient admission records were drawn from all 41 Utah acute-care hospitals: reviewers identified ADEs using implicit chart review; pharmacists assigned Medical Dictionary for Regulatory Activities codes to ADE descrip-tions for identification of clinical groups of events; and hospitals provided patient
demo-graphic, admission, and ICD-9-CM data. Inci-dence proportions were 0.8% for drug-induced bleeding/anticoagulation problems and 1.0% for drug-induced delirium/psychosis. The CTA model for bleeding had very good PAC (87%) and sensitivity (86%), and fair positive predic-tive value (12%). The CTA model for delirium had excellent sensitivity (94%) and PAC (83%), but low positive predictive value (3%). Poison-ing and ADE codes designed for targeted ADEs had low sensitivities, and degraded model accu-racy when forced in. These findings indicate that CTA is a promising method for rapidly de-veloping clinically meaningful surveillance rules for administrative data. The resultant model for drug-induced bleeding and anticoag-ulation problems may be useful for retrospective ADE screening and rate estimation.
In contrast to the preceding classical ex-ploratory data-mining application of CTA to study ADEs, Belknap began with the axiom that a prescription may be conceptualized as a health-care program implemented by a physi-cian in the form of instructions that govern the plan of care for an individual patient.11 Soft-ware design principles and debugging methods were used to create a “Patient-oriented Pre-scription for Analgesia” (POPA), the rate and extent of adoption of POPA by physicians was assessed, and CTA was conducted to evaluate whether POPA would reduce the rate of severe and fatal opioid-associated ADEs. The study involved a population of 153,260 hospitalized adults, 50,576 (33%) of whom received paren-teral opioids. Hospitalwide, the use of POPA increased to 62% of opioid prescriptions, and opioid-associated severe/fatal ADEs fell from an initial peak of seven/month to zero/month during the final six months of the study.
clau-12
dication.12 A total of 532 patients with mild to moderate lower extremity vascular disease, without prior peripheral revascularization pro-cedures or symptoms of disease progression, were enrolled in a prospective outcomes study at the time of an initial referral visit for claudi-cation to one of 16 Chicago-area vascular sur-gery offices or clinics. Study variables were derived from lower extremity blood flow rec-ords and patient questionnaires, and follow-up home health visits were used to ascertain the frequency of lower extremity revascularization procedures within six months (13.3%). Ten pa-tient attributes were used in the CTA model: sensitivity=67.6%; specificity=92.9%; relatively strong ESS=57.7%. Initial ankle-brachial index (used to classify 100% of sample), leg symptom status over the previous six months (used to classify 89% of sample), self-reported commu-nity walking distance (used to classify 74% of sample) and prior willingness to undergo a lower extremity hospital procedure (used to classify 39% of sample) were the most influen-tial attributes in the model, and are critical con-trol variables for a valid observational study of treatment effectiveness.
CTA was also used to develop a predic-tive model for predicting gestational age at de-livery, after placement of an emergent cerclage in the second trimester, for 116 women with documented cervical change on physical exami-nation.13 CTA was used to predict delivery prior to 24 weeks, between 24 and 27 6/7 weeks, or 28 weeks or later. Delivery prior to 24 weeks was best predicted by presence of prolapsed membranes and gestational age at cerclage placement; delivery between 24 and 27 6/7 weeks was best predicted by parity alone; delivery of at least 28 weeks was best predicted by cervical dilation and length, presence of prolapsed membranes, and parity. When choosing a single model to predict delivery at the three different gestational age periods, the model predicting delivery at 28 weeks yielded the most accurate results. These findings
indi-cated that CTA-based predictive models for out-come after emergent cerclage are informative for both patients and physicians.
CTA was also used in recent research describing clinical and laboratory findings for a sample of 128 patients with thienopyridine-as-sociated thrombotic thrombocytopenic purpura (TTP).14,15 Duration of thienopyridine expo-sure, clinical and laboratory findings, and sur-vival were recorded for all subjects, and ADAMTS13 activity (39 patients) and inhibitor (30 patients) were measured for a subset of in-dividuals. Among patients who developed TTP more than two weeks after thienopyridine expo-sure, therapeutic plasma exchange (TPE) in-creased likelihood of survival (84% versus 38%,
p<0.05). In contrast, among patients who de-veloped TTP within two weeks of starting thienopyridines, survival was 77% with TPE and 78% without. Findings suggested that TTP drug toxicity occurs by two different mechanis-tic pathways, characterized primarily by time of onset before versus after two weeks of thieno-pyridine administration.
13
demonstrate that CTA can elucidate clinically-relevant relationships within large patient pop-ulations, such as observational databases.
Finally, CTA was used to identify risk factors for venous thromboembolism (VTE) during the rehabilitation phase of spinal cord injury for a sample of 243 patients with acute spinal cord injury, 51 of whom had VTE, and 8 of whom died.17 Attributes included type and location of spinal cord injury, American Spinal Injury Association classification, concomitant injuries, surgical procedures, complications, preexisting illnesses, and use of antithrombotic prophylaxis. A three-attribute CTA model identified patient groups differing in likelihood of experiencing deep vein thrombosis (DVT). The group having the highest likelihood of DVT was patients with cancer over the age of 35 years, though women without cancer between the ages of 36 and 58 years, as well as cancer-free men with flaccid paralysis, were also at in-creased risk.
Psychosocial Aspects of Medicine
CTA has been used in the study of psy-chosocial aspects of medicine, such as quality-of-care and patient satisfaction in the emergency department; severity-of-illness and quality-of-life among asthma patients; age and functional status of ambulatory internal medicine patients; and literacy and hospitalization rates of general medicine outpatients.
For example, CTA was used to identify perceptions that predict patient (dis)satisfaction with Emergency Department (ED) care.18 Data were responses: (a) to a survey mailed to all dis-charged patients over a 6-month period (Aca-demic Hospital); or (b) to a telephone-based interview of a random sample of discharged pa-tients over a 1-year period (Community Hospi-tal). The survey and interview both assessed overall satisfaction, and satisfaction with per-ceived waiting times, information delivery, and expressive quality of physicians, nurses, and staff. Data for 1,176 patients (training sample)
and 1,101 patients (holdout sample) who rated overall satisfaction as either “very good” or “very poor” (Academic Hospital), and for 856 patients (training sample) and 431 patients (holdout sample) who rated overall satisfaction as either “excellent” or “poor” (Community Hospital), were retained for analysis. For both hospitals, CTA models efficiently achieved ESS
values ~ 90 (all ps<0.0001). The findings reveal
that overall (dis)satisfaction with care received in the ED is nearly perfectly predictable on the basis of patient-rated expressive qualities of ED staff, and suggest that interventions designed to reinforce positive expressive provider behaviors may reduce the number of dissatisfied patients by half.
CTA was also used to associate severity-of-illness (assessed using the Asthma Severity Index, or ASI) with quality-of-life (QOL) in a prospective study of clinical and psychological correlates of adverse asthma outcomes.19 Data, collected at study intake and then every three months thereafter for a year from 13 adults with asthma, included a QOL scale, an ASI survey, spirometry, and history and physical exam. A perfect CTA model was identified which in-cluded a query about bodily pain in the last four weeks, and a self-assessment of general health.
Research reporting the first CTA ever published discriminated 65 geriatric (>65 years of age) and 85 non-geriatric ambulatory medical patients using five functional status subscales, and five single-item measures hypothesized to be relevant to functional status (assessing physi-cal limitations, social support, and satisfaction with health).20 Results revealed four strata (“patient clusters”): relatively active nongeriat-ric adults; relatively inactive geriatnongeriat-ric adults; inactive, depressed, socially isolated young women; and active, happy, socially connected geriatric adults.
14 determinants of hospitalization, such as social support. CTA was used to evaluate whether low literacy is a predictor for preventability of hos-pitalization when considered in the context of social support, sociodemographics, health sta-tus, and risk behaviors, for a sample of 400 pa-tients admitted to general medicine wards in a
university-affiliated Veterans Affairs hospital.21
Two board-certified internists independently assessed preventability of hospitalization and determined the primary preventable cause through blinded medical chart reviews. Sig-nificant predictors of having a preventable cause of hospitalization included binge alcohol drink-ing, lower social support for medical care, three or fewer annual clinic visits, and 12 or more people talked to weekly.
Allied Health Disciplines
CTA has been used in research in allied health disciplines, including studies designed to enhance psychological diagnostic accuracy, model psychosocial adaptation, improve long-term functional status, and predict adolescent psychiatric inpatient hospitalization.
The utility of the Behavioral Assessment System for Children (BASC) and Child Behav-ior Checklist (CBCL) Parent scales was as-sessed in terms of discriminating between: (a) students with attention deficit-hyperactivity dis-order (ADHD) versus non-ADHD students, and (b) inattentive-type versus combined-type ADHD-afflicted students.22 For both the BASC and the CBCL, a different CTA model was de-veloped for each of the two diagnostic predic-tions. For distinguishing ADHD versus non-ADHD students the BASC model was more parsimonious and accurate than the CBCL model, whereas for differentiating between in-attentive versus combined types the CBCL model was superior. The results demonstrate the diagnostic utility of the BASC and CBCL, and describe salient behavioral dimensions as-sociated with subtypes of ADHD. A Bayesian methodology for estimating the efficiency of a
CTA model versus chance, for any given base-rate of class 1 (and also of class 0) membership, is presented.
In a conceptually similar study, demo-graphic and clinical correlates of lifetime sub-stance use disorders were studied in a cohort of 325 recently hospitalized psychiatric patients.23 Gender (male), age (younger), education (less), time in jail, conduct disorder symptoms, and antisocial personality disorder symptoms were predictive of substance use disorders. CTA was successful in predicting 74% to 86% of the alco-hol, cannabis, and cocaine use disorders.
CTA was used to examine how individ-ual- and family-level predictorsin late child-hood and preadolescence relate to psychoso-cialadaptation (i.e., scholastic success, social acceptance, andpositive self-worth) in early ad-olescence.24 A prospective study included 68 families of children with spinabifida, and 68 comparison families of healthy children. Multi-method, multi-informant data were evaluated via CTA. Factors best predicting psychosocial adaptation in early adolescenceincluded intrin-sic motivation, estimated verbal IQ,behavioral conduct, coping style, and physical appearance: ESS=56.2. There were no significant group (spina bifida versus able-bodied) effects. These results suggest thatprocesses leading to psycho-social adaptation may be similarfor youth with and without chronic illness.
15
ipsative transformations of functional status measures may be the preferred pre-processing strategy for designs involving the use of longi-tudinal data.26
Finally, CTA was used to explore pre-dictors of inpatient hospital admission decisions for a sample of 13,245 children in foster care over a four-year period.27 As hypothesized, clinical variables including suicidality, psy-choticism and dangerousness predicted psychi-atric admissions; however, family problems, and the location of hospital screening, impacted de-cision making in a subsample of cases. The CTA model developed in Year 1 reliably and consistently predicted admission decisions across the next three years.
Conclusion
CTA has produced the most powerful models yet published in the applications in which it has been employed in the field of medicine. Research ongoing over the span of a decade also showed that CTA models replicated across time better than had any prior models of the pulmonary phenomena under study. This result is encouraging, particularly since most published research using CTA reported models derived manually using UniODA software, with model growth controlled using a sequentially-rejective Bonferroni-type procedure to guard against alpha inflation and model overfitting.20
Recently, however, an optimal pruning methodology has been developed which exam-ines all possible subtrees of the final CTA model, and explicitly identifies the model which maximizes ESS while maintaining control of the experimentwise Type I error rate.1,2 The use of pruning to maximize ESS was illustrated for the example presented earlier, involving predicting in-hospital mortality of AIDS patients with PCP.28 Compared to the non-pruned model (see Figure 1), in the pruned (maximum ESS) CTA model no attributes emanated from the right-hand-side of the tree: Prior AIDS and Age were dropped. The pruned CTA model achieved ESS
of 33.7, representing a moderate effect (versus the relatively weak effect yielded by the non-pruned model), and reflecting a 59% increase in ESS. Compared to the non-pruned model (see Table 1), the optimized model had 32.1% lower specificity, but 118.8% greater sensitivity; and 6.2% greater negative predictive value, but 28.7% lower positive predictive value. In addi-tion, the optimized model used one fewer node than the non-pruned model, rendering it 98.7% more efficient than the non-pruned model—av-eraging 8.4 versus 4.24 ESS-units-per-attribute, respectively.1
Software capable of conducting auto-mated CTA became commercially available in fall, 2010 (www.OptimalDataAnalysis.com).29 Beyond obvious savings in time and labor, two primary advantages of automated CTA both in-volve pruning. First, when the CTA model is derived manually the Bonferroni procedure is conducted as the model is grown. After model growth is completed, attributes in close proxim-ity to the root variable, having p~0.05, may be forced out of the model as an increasing number of attributes load on lower branches, disrupting the model and the modeling process. When conducting automated analysis the associated recursive trimming and re-development process is user-transparent: the computer simply exe-cutes the algorithm. Second, automated soft-ware always conducts pruning to explicitly maximize model accuracy, a task which be-comes difficult to accomplish manually for complex models.2
16
AaPo2 (used on two branches)—the enumerated CTA model achieved 69.5% sensitivity, 70.1% specificity, moderate ESS=39.7 (17.8% greater than for the pruned manually-derived CTA model), and good efficiency=13.2 ESS units-per-attribute (17.9% greater than for the pruned manually-derived optimized manual model).
Several additional features of the auto-mated CTA platform29 set the stage for an inter-esting “second round” of application of CTA in medicine and allied health disciplines. For ex-ample, a forcenode command forces CTA to insert the attribute var at node node in the solu-tion tree—useful for confirmatory modeling. Also, a minimum denominator command allows specification of minimum endpoint sample size (useful to ensure statistical power); a minimum sample size command forces the solution to classify some specified minimum sample size (useful in data sets involving many missing val-ues); and a maximum depth command limits the depth that the CTA model may achieve (useful for identifying efficient models). Time will tell if enhanced precision and flexibility will yield even more powerful models than have been re-ported in the first “manual” round of application of CTA in the field of medicine.
References
1
Yarnold PR, Soltysik RC. Optimal data analy-sis: Guidebook with software for Windows. Washington, D.C.: APA Books, 2005.
2
Yarnold PR, Soltysik RC. Maximizing the ac-curacy of classification trees by optimal prun-ing. Optimal Data Analysis 2010, 1:23-29. 3
Yarnold PR, Soltysik RC, Bennett CL. Pre-dicting in-hospital mortality of patients with AIDS-related Pneumocystis carinii pneumonia: an example of hierarchically optimal classifica-tion tree analysis. Statistics in Medicine 1997, 16:1451-1463.
4
Curtis JR, Yarnold PR, Schwartz DN, Wein-stein RA, Bennett CL. Improvements in
out-comes of acute respiratory failure for patients with human immunodeficiency virus-related
Pneumocystis carinii pneumonia. American Journal of Respiratory and Critical Care Medi-cine 2000, 162:393-398.
5
Kim B, Lyons TM, Parada JP, Uphold CR, Yarnold PR, et al. HIV-related Pneumocystis carinii pneumonia in older patients hospitalized in the early HAART era. Journal of General Internal Medicine 2001, 16:583-589.
6
Arozullah AM, Yarnold PR, Weinstein RA, Nwadiaro N, McIlraith TB, et al. A new pre-admission staging system for predicting in-pa-tient mortality from HIV-associated Pneumo-cystis carinii pneumonia in the early-HAART era. American Journal of Respiratory and Critical Care Medicine 2000, 161:1081-1086. 7
Arozullah AM, Parada J, Bennett CL, Deloria-Knoll M, Chmiel JS, et al. (2003). A rapid staging system for predicting mortality from HIV-associated community-acquired pneumo-nia. Chest 2003, 123:1151-1160.
8
Kyriacou DN, Yarnold PR, Stein AC, Schmitt BP, Soltysik RC, et al. Discriminating inhala-tional anthrax from community-acquired pneu-monia using chest radiograph findings and a clinical algorithm. Chest 2007, 131:489-495. 9
Kyriacou DM, Yarnold PR, Soltysik RC, Wunderink RG, Schmitt BP, et al. Derivation of a triage algorithm for chest radiography of community-acquired pneumonia in the emer-gency department. Academic Emergency Medi-cine 2008, 15:40-44.
10
Nebeker JR, Yarnold PR, Soltysik RC, Sauer BC, Sims SA, et al. Developing indicators of inpatient adverse drug events through non-linear analysis using administrative data. Medical Care 2007, 45:S81-S88.
11
17
analgesia prescription reduces risk of severe in-jury from medical use of opioids. Clinical Pharmacology and Therapeutics 2008, 84:385-392.
12
Feinglass J, Yarnold PR, Martin GJ, McCarthy WJ. A classification tree analysis of selection for discretionary treatment. Medical Care 1998, 36:740-747.
13
Grobman WA, Terkildsen MF, Soltysik RC, Yarnold PR. Predicting outcome after emergent cerclage using classification tree analy-sis. American Journal of Perinatology 2008, 25:443-448.
14
Zakarija A, Bandarenko N, Pandey DK, Auer-bach A, Raisch DW, et al. Clopidogrel-associ-ated TTP: an update of pharmacovigilance ef-forts conducted by independent researchers, pharmaceutical suppliers, and the Food and Drug Administration. Stroke 2004, 35:533-538. 15
Bennett CL, Kim B, Zakarija A, Bandarenko N, Pandey DK, et al. Two mechanistic path-ways for thienopyridine-associated thrombotic thrombocytopenic purpura: a report from the Surveillance, Epidemiology, and Risk Factors for Thrombotic Thrombocytopenic Purpura (SERF-TTP) research group and the Research on Adverse Drug events And Reports (RADAR) project. Journal of American College of Cardi-ology 2007, 50:1138-1143.
16
Kanter AS, Spencer DC, Steinberg MH, Soltysik RC, Yarnold PR, et al. Supplemental vitamin B and progression to AIDS and death in black South African patients infected with HIV.
Journal of Acquired Immune Deficiency Syn-drome 1999, 21:252-253.
17
Green D, Hartwig D, Chen D, Soltysik RC, Yarnold PR. Spinal cord injury risk assessment for thromboembolism (SPIRATE study).
American Journal of Physical and Medical Re-habilitation 2003, 82:950-956.
18
Yarnold PR, Michelson EA, Thompson DA, Adams SL. Predicting patient satisfaction: a study of two emergency departments. Journal of Behavioral Medicine 1998, 21:545-563. 19
Kucera CM, Greenberger PA, Yarnold PR, Choy AC, Levenson T. An attempted prospec-tive testing of an asthma severity index and a quality of life survey for 1 year in ambulatory patients with asthma. Allergy and Asthma Pro-ceedings 1999, 20:29-38.
20
Yarnold PR. Discriminating geriatric and non-geriatric patients using functional status information: an example of classification tree analysis via UniODA. Educational and Psy-chological Measurement 1996, 56:656-667.
21
Arozullah AM, Lee SD, Khan T, Kurup S, Ryan J, et al. The roles of low literacy and so-cial support in predicting the preventability of hospital admission. Journal of General Internal Medicine 2006, 21:140-145.
22
Ostrander R,Weinfurt KP, Yarnold PR, Au-gust G. Diagnosing attention deficit disorders using the BASC and the CBCL: test and con-struct validity analyses using optimal discrimi-nant classification trees. Journal of Consulting and Clinical Psychology 1998, 66:660-672. 23
Mueser KT, Yarnold PR, Rosenberg SD, Drake RE, Swett C, et al. Substance use disor-der in hospitalized severely mentally ill psychi-atric patients: prevalence, correlates, and sub-groups. Schizophrenia Bulletin 2000, 26:179-193.
24
Coakley RM, Holmbeck GN, Bryant FB. Constructing a prospective model of psychoso-cial adaptation in young adolescents with spina bifida: an application of optimal data analysis.
Journal of Pediatric Psychology 2005, 31:1084-1099.
25