Ministry of Defense of the Republic of Serbia, Serbian Armed Forces, Niš
3 University of Kragujevac, Faculty of Hotel Management and Tourism in Vrnjačka Banja
UDC: 338.481.31(4) 338.487:339.13
Determinants of CEE Countries’ Tourism
Competitiveness: A Benchmarking Study
DOI: 10.7595/management.fon.2016.00211. Introduction
The Travel & tourism (T&T) sector plays a very important role in the value creation of European countries. According to the World Travel & Tourism Council (2015), with nearly 14 million direct employees, the T&T sector is one of the leading employers in Europe. Including its indirect and induced impacts, this sector pro-vided 35 million jobs in 2014, which is 9.0% of regional employment; and the direct GDP of this European industry generated $US 780 billion in 2014, which exceeds the GDP of the Europe’s banking, agriculture, chemicals manufacturing, mining, and automotive manufacturing sectors (World Travel & Tourism Council, 2015). The T&T sector is therefore often presented as an agent (Sharpley, 2015) or even locomotive (Popescu, 2014) and major driver (Bimonte & Punzo, 2016) of economic growth and development, with a positive trend in recent years (Temirbulatova & Borza, 2015), and with a tendency to grow during the next period in the European countries. According to the European Travel Commission (2015), visitor growth fore-casts in the period 2015-2017 amounts between 3.4% and 4.4%.
The great potential of the T&T sector stems from its contribution to the achievement of various strategic EU objectives, such as (Butnaru & Niță, 2016, p. 372): sustainable development, economic development, human resources development, economic and social cohesion. Also, the T&T sector is closely linked to numerous other economic sectors such as retailing, agriculture and construction, and therefore its development hasa potential to generate positive externalities on the remainder of the economic system (Kadiyali & Kosová, 2013; Li, Chen, Li & Goh, 2016) and hence on the GDP (Čerović, Knežević & Pavlović, 2016).
Spain, France, and Germany are the top three destinations in the world according to the T&T competitive-ness criteria (WEF, Travel & Tourism Competitivecompetitive-ness Report 2015). However, the T&T sector is not equally developed in all European countries. There is no CEE country among the top 15 European countries ac-cording to the T&T competitiveness criterion.
The aim of this paper is to benchmark the competitiveness factors in the T&T sector in CEE countries with the top 15 European countries, using the Travel & Tourism Competitiveness Index - TTCI (WEF, Travel & Tourism Competitiveness Report 2015). The aim is to check the extent to which the CEE countries lag behind the top 15 European countries in terms of T&T competitiveness. Also, the goal is to determine whether the CEE
coun-The purpose of this research is to analyze the competitiveness determinants of the travel & tourism sector in
Central and East Europe (CEE) countries. The aim is to find the critical competitiveness determinants of the
travel & tourism sector in the CEE countries that is being improved by efficient development strategies in the
future. The framework for analysis is a methodology of the Travel & Tourism Competitiveness, created by the
World Economic Forum, and its classification of competitiveness factors – pillars and necessary information
basis for this research. The benchmarking study on CEE countries’ tourism competitiveness was conducted
using the descriptive statistics, comparative analysis and benchmarking. The research results are related to
relevant moments for the CEE group of countries and show the critical pillars for each country in the CEE
group. The conclusions of this research give the directions for tourism policy makers in the CEE countries.
tries have advantages concerning the competitiveness factor (four subindices and fourteen pillars within the TTCI) in comparison with the top 15 European countries. The intention is to find the factors that are critical for T&T competitiveness in the CEE countries, those that are a priority of the development policy and need urgent improvements to cut the gap between these countries and the top 15 European destinations in the future. This analysis and its outcomes should give guidance to policy makers in defining development goals and improv-ing all pillars for T&T development and competitiveness. For the purpose of accomplishimprov-ing the task, the paper incorporates three main segments. In the first section, the paper deals with the problems of T&T competitive-ness and specifies the various determinants of competitivecompetitive-ness. The research method is presented in the sec-ond part of the paper. The third part of the paper refers to the research results and discussions.
2. Theoretical Background
The concept of competitiveness attracts attention and remains at the focus of analysis of many researchers and professionals in various industries. Competitiveness is one of the key issues for the tourism and an im-portant area for policy makers in creating strategies for the T&T development in both the developed and less developed tourism countries (Ayikoru, 2015). One of the widely accepted definitions of tourism competi-tiveness is the OECD definition: “Tourism competicompeti-tiveness for a destination is about the ability of place to optimize its attractiveness for residents and non-residents, to deliver quality, innovative, and attractive (e.g., providing good value for money) tourist services to consumers and to gain market shares on the domestic and global marketplaces, while ensuring that the available resources supporting tourism are used efficiently and in a sustainable way” (Dupeyras & MacCallum, 2013, p. 7).
Improving the competitiveness of tourist destinations is an especially important issue for the advancement of both T&T competitiveness and country competitiveness (Krstić, Jovanović & Stanišić, 2014). Every tourist destination has to develop a set of competitive advantages (Cîrstea, 2014; Raun, Ahas & Tiru, 2016). Ritchie and Crouch point out that the “nature of competitiveness and sustainability is in constant evolution” (Ritchie & Crouch, 2003, p. 8). In addition, “there is an urgent need for sustainable competitiveness. The consider-ation of the internal public in tourism destinconsider-ation development and marketing leads to the preservconsider-ation of natural environment and the cultural identity of the destination” (Vodeb, 2012, p. 276).
Some authors emphasize other important dimensions of competitiveness in tourism, such as policy or tech-nological advances (Bălan, Balauru & Vegheş, 2009). Cooper, Fletcher, Fyall, Gilbert and Wanhill (2008) dis-cuss the importance of both developing and supporting the activities of the destination, but also of keeping and protecting the existing resources of importance to tourism destinations. Ritchie and Crouch (2003) pres-ent the model of destination competitiveness. They suggest that tourism is open and that it is influenced by a number of factors from both micro and macro environments. In this model, the key elements are (Ritchie & Crouch, 2003, p. 63): qualifying and amplifying determinants; destination policy, planning and develop-ment; destination managedevelop-ment; core resources and attractors; and supporting factors and resources.
The fact that “tourism managers must identify and explore competitive advantages and analyse the nation’s competitive position” (Lin & Huang, 2009, p. 270) stresses the importance of the analysis of desti-nation competitiveness. “For effective tourism management it is essential for the destidesti-nation to be able to determine the points (factors) where certain management interventions (marketing, development, etc.) can help achieve or maintain this success” (Papp & Raffay, 2011, p. 23).
“The most important is the ability of the tourism sector for higher value added, but the value to its products” (Bo-biră& Cristureanu, 2006, p. 10). This view is found also in the study by Hassan (2000). He believes that the des-tination competitiveness is “the desdes-tination’s ability to create and integrate value added products that sustain its resources, while maintaining market position relative to its competitors” (Hassan, 2000, p. 240). This author em-phasizes the importance of the environmental component of competitiveness in tourism. Mihalič (2000) also deals with this issue and notes that “destination environmental competitiveness can be increased by appropriate man-agerial efforts related to environmental impact and environmental quality management. Secondly, the destination competitiveness can be enhanced through certain environmental marketing activities” (Mihalič, 2000, p. 65).
pp. 7-8): tourism direct gross domestic product, inbound tourism revenues per visitor by source market, overnight in all types of accommodation, exports of tourism services, labour productivity in tourism services, purchasing power parity and tourism prices, country entry visa requirements, natural resources and biodi-versity, cultural and creative resources, visitor satisfaction, national tourism action plan. This systematic in-dicator framework is important since it provides the basis for a benchmarking method which is applied in this paper. Kozak and Rimmington (1999) also write about the importance of benchmarking and point out that “much management effort goes into establishing strategies and operating procedures which will lead to competitive advantage and to measuring performance against key competitors through benchmarking initiatives” (Kozak & Rimmington, 1999, p. 273).
Crouch and Ritchie (1999) provide conceptual frameworks for monitoring tourism competitiveness. They show three levels of competition (companies & products, national industries, and national economies) and four elements of competitiveness (the structure, the level of the territory, the stakes, and the tools) (Crouch & Ritchie, 1999, p. 141). Navickas and Malakauskaite (2009) also deal with the analysis of the factors that impact competitiveness. They point out that the destination competitiveness is particularly important for countries that want to increase their share on the fast growing tourism market. For monitoring the achieved level of T&T competitiveness, the authors point out the following groups of indicators (Navickas & Malakauskaite, 2009, p. 41): price competitiveness indicators, infrastructure development indicators, ecol-ogy related indicators, technological advancement indicators, human resource indicators, market open-ness indicators and social development indicators.
The methodology for measuring the T&T competitiveness of the World Economic Forum (WEF) system-atizes the key factors into 4 subindices, i.e., into 14 pillars to quantify the level of competitiveness of each country and rankings. Each of the pillars within the TTCI subindices consists of a number of indicators. The score of the pillar is obtained by measuring, transforming, and calculating the average score of variables. The range of the scores is from 1 to 7. Transforming the data, i.e., their ranking on a scale from 1 to 7 provides the comparison of the TTCI among countries.
As noted previously, the TTCI consists of four subindices: Enabling environment (A), T&T policy and enabling conditions (B), Infrastructure (C) and Natural and cultural resources (D). The subindex A within the TTCI is com-posed of five pillars: Business environment (P1), Safety and security (P2), Health and hygiene (P3), Human
re-sources and labour market (P4) and ICT readiness (P5). The second subindex B has four pillars: Prioritization of
travel and tourism (P6), International openness (P7), Price competitiveness (P8) and Environmental
sustainabil-ity (P9). The third subindex C consists of the following three pillars: Air transport infrastructure (P10), Ground and
port infrastructure (P11) and Tourist service infrastructure (P12). The last subindex D has two pillars: Natural
re-sources (P13) and Cultural resources and business travel (P14). The TTCI is the unweighted average of the value
of aforementioned subindices. Each pillar is measured by several indicators. The TTCI methodology calculates the score for each country on the basis of 90 indicators within 14 pillars. For example, the Business environment pillar consists of twelve indicators, the Safety and security pillar consists of five indicators, etc.
3. Research Methods
The subject of this research is to analyze the factors of T&T competitiveness in CEE and in European coun-tries. The analysis of the T&T competitiveness determinants is based on the WEF methodology. The infor-mation basis for this research consists of the secondary data published in the Travel & Tourism Competitiveness Report 2015.
pol-icy of CEE countries in the future period. Since the study covers 15 CEE countries, the authors define the group of top 15 European countries as a benchmarking group.
Evaluating of tourism sustainability and reshaping tourism strategies and activities using the benchmarking method is a challenging task for researchers. Nevertheless, benchmarking as a research method is very pop-ular within the tourism industry (Wobër, 2002; Lennon, 2006; Corne, 2015), particpop-ularly in the analysis of the tourist destination competitiveness. The term destination benchmarking can be taken into consideration as “the continuous measurement of the performance of tourist destinations (strengths and weaknesses) not only against itself or other destinations in the same or in a different country, but also against national/international quality grad-ing systems by assessgrad-ing both primary and secondary data for the purpose of establishgrad-ing priorities, settgrad-ing tar-gets and gaining improvements in order to gain competitive advantage“ (Kozak, 2004, p. 41). Benchmarking gives opportunities for getting information for specifying implications and a more efficient decision-making of policy makers (Yasin, Alavi, Koubida & Small, 2011). In addition to benchmarking, the following methods are used in this research: descriptive statistics and comparative analysis. Comparative analysis is used to determine the relative position of each country in a group of the CEE countries (by value of the TTCI and the pillar within the TTCI), compared to the average value of these indices and pillars for a group of the CEE countries.
4. Results and Discussions
4.1
Analysis of CEE Countries’ Tourism Competitiveness – Considerations and Findings
The analysis of T&T competitiveness of the CEE countries is based on the data about rank and score of the TTCI. The WEF (2015) analyzes the performance of 141 economies. Table 1 shows the position of the CEE countries, according to rank and score of the TTCI. The best-ranked countries in the CEE are: Croatia (the first position in the group, the 33rdplace in the world), the Czech Republic (the second in the group, the 37th
in the world), Estonia (the third in the group, the 38thplace in the world), Slovenia (the fourth place in the
group and the 39thposition in the world), and Hungary (the fifth place in the group, the 41stplace in the
world). Croatia records the highest score of the TTCI among the CEE countries (4.30). Countries with the lowest score of the TTCI are Albania (3.22) and Serbia (3.34).
Table 1: The score and rank of CEE countries according to TTCI subindices (2015)
Source: The Word Economic Forum, The Travel & Tourism Competitiveness Report 2015
Country
TTCI Score (1-7)
TTCI over
all rank (out of 141)
Rank on the list
of isolated group of CEE countries
Enabling environment
subindex
T&T policy and enabling conditions
subindex
Infrastructure subindex
Natural and cultural resources subindex
Score Overall
rank Score
Overall
rank Score
Overall
rank Score
Overall rank
Croatia 4.30 33 1 5.08 52 4.33 39 4.54 38 3.23 30
Czech R. 4.22 37 2 5.34 31 4.53 14 4.57 35 2.45 63
Estonia 4.22 38 3 5.65 18 4.69 7 4.41 43 2.12 84
Slovenia 4.17 39 4 5.21 42 4.43 25 4.43 42 2.64 53
Hungary 4.14 41 5 5.28 33 4.76 2 4.06 48 2.47 62
Poland 4.08 47 6 5.22 39 4.43 23 3.70 62 2.96 43
Bulgaria 4.05 49 7 5.13 46 4.44 22 3.93 52 2.70 48
Latvia 4.01 53 8 5.47 25 4.51 16 4.14 46 1.94 102
Lithuania 3.88 59 9 5.42 26 4.41 27 3.72 61 1.97 100
Slovak R. 3.84 61 10 5.14 44 4.23 58 3.64 66 2.37 67
Romania 3.78 66 11 4.88 59 4.37 35 3.49 71 2.38 66
Montenegro 3.75 67 12 5.01 56 3.95 91 4.12 47 1.93 105
FYR
Macedonia 3.50 82 13 5.11 49 3.74 110 3.41 74 1.72 125
Serbia 3.34 95 14 4.72 67 3.71 113 3.19 81 1.75 122
Albania 3.22 106 15 4.68 69 3.59 122 3.04 90 1.59 135
The best-placed CEE country in the world rankings, Croatia, is located at the 33rdplace out of 141 analyzed
countries, while the weakest positioned Albania lags behind Croatia by 73 positions, ranked the 106th. The
CEE countries that record a lower value of the TTCI compared to the average value of the TTCI are the fol-lowing: Albania, Serbia, the FYR Macedonia, Montenegro, Romania, the Slovak Republic and Lithuania. Considering 141 countries analyzed by the WEF, with the exception of Albania, Serbia and the FYR Mace-donia, all CEE countries are located in the first half of the TTCI ranking list. For the CEE countries, the av-erage score of the Enabling environment subindex is 5.16, the T&T policy and enabling conditions subindex amounts to 4.27, the Infrastructure subindex is 3.89 and the Natural and cultural resource subindex is 2.28.
4.2
Analysis of Top 15 European Countries’ Competitiveness as Group for Benchmarking
With the aim to analyse the T&T competitiveness of CEE countries, it is relevant to find the competitive po-sition of the top 15 European countries with the highest value of the TTCI rank and score. The top 15 Euro-pean countries are a benchmarking group of countries which serves for comparison to the CEE countries. Table 2 shows the scores and ranks according to pillars within the TTCI.
Table 2: Top 15 European countries according to score and rank of the TTCI (2015)
Source: The Word Economic Forum,The Travel & Tourism Competitiveness Report 2015
Europe, with six countries in the top 10, continues to dominate the rankings (see Table 2). Spain records the highest score of the TTCI among 141 countries (5.31), followed by second-ranked France (5.24) and third-ranked Germany (5.22). The first three European countries are followed by United Kingdom, Switzerland, Italy, Austria, Netherlands, Portugal, Iceland, Ireland, Norway, Belgium, Finland and Sweden.
The results of descriptive statistics according to the score of the TTCI for the top 15 European countries in 2015 show that the minimum score of the TTCI is 4.45, the maximum score is 5.31, the standard deviation is 0.31, and the coefficient of variation is 6.54%. The average value of the TTCI score of the top 15 European countries is 4.80. Compared to the CEE countries, it means a big difference according to the average value of the TTCI score of the CEE countries (3.90). For the top 15 European countries, the average score of the
Pillars Spain
Fran c e G e rm any U. Kin g dom Switze rland It aly Au stria Ne th erla nds Po rtu g al Ic elan d Ir eland No rway Bel g iu m Finl and S w ed en Ave rage score for t o p
15 E
u
rop
e
an
countries
P1Business
environment 4.09 4.52 5.32 5.70 5.76 3.59 4.94 5.44 4.54 4.96 5.37 5.44 4.71 5.60 5.22 5.01
P2Safety and
security 5.97 5.44 6.06 5.44 6.32 5.68 6.47 6.16 6.33 6.54 6.18 6.10 6.18 6.70 6.10 6.11
P3Health and
hygiene 6.11 6.52 6.85 5.83 6.50 6.27 6.97 6.24 6.06 6.07 5.80 6.17 6.49 6.31 5.94 6.28
P4 Human resources
and labour market 4.87 4.96 5.18 5.29 5.64 4.45 5.09 5.13 5.18 5.49 5.27 5.24 5.03 5.43 5.30 5.17
P5ICT readiness 5.26 5.55 5.51 6.09 6.03 5.14 5.70 5.96 4.97 5.88 5.28 6.14 5.47 6.37 6.17 5.70
P6 Prioritization of
travel & tourism 5.89 5.16 4.84 5.10 5.64 4.62 5.52 4.66 5.46 5.89 5.25 5.14 4.47 4.57 4.70 5.13
P7 International
openness 3.93 4.22 4.24 4.24 4.11 4.09 3.99 4.25 4.21 4.38 4.53 3.97 4.13 4.10 4.07 4.16
P8 Price
competitiveness 4.22 2.95 3.62 2.73 2.57 3.49 3.49 3.56 4.23 3.59 3.69 3.23 3.73 3.71 3.38 3.48
P9 Environmental
sustainability 4.61 4.67 4.90 4.79 5.63 4.34 5.13 4.81 4.42 4.92 5.31 5.22 4.28 5.25 5.03 4.89
P10 Air transport
infrastructure 4.91 4.98 4.93 5.12 5.03 4.26 4.01 4.89 3.91 4.67 4.16 5.01 3.83 4.41 4.52 4.58
P11Ground and port
infrastructure 5.54 5.78 5.99 5.51 6.00 4.65 5.42 6.21 4.54 4.35 4.89 3.81 5.96 4.83 4.76 5.22
P12 Tourist service
infrastructure 6.58 6.15 5.61 5.08 6.35 6.66 6.83 4.62 6.12 6.28 6.10 5.49 5.65 5.02 4.84 5.83
P13Natural
resources 4.59 4.80 4.41 4.79 4.32 4.60 4.07 3.19 3.70 3.63 2.79 3.96 2.65 3.16 3.20 3.86
P14Cultural
resources and business travel
6.69 6.56 6.00 5.90 2.93 6.51 2.92 3.51 3.71 1.53 2.82 2.22 3.67 2.13 2.93 4.00
TTCI 5.31 5.24 5.22 5.12 4.99 4.98 4.82 4.67 4.64 4.54 4.53 4.52 4.51 4.47 4.45 4.80
Enabling environment subindex is 5.65, the T&T policy and enabling conditions subindex is 4.41, the Infra-structure subindex is 5.21, and the Natural and cultural resources subindex is 3.93. This leads to the view that the CEE countries largely lag behind the top 15 European countries according to the TTCI score, and are also in a large backlog observing particularly the scores of four subindices within the TTCI.
Table 2 shows very interesting facts about the competitiveness factors and performances of the top 15 Euro-pean countries according to pillars within the TTCI. Switzerland and United Kingdom occupy the first and the second places when it comes to the Business environment pillar. The best countries according to the Safety and security pillar are Finland and Iceland. From the above-mentioned top 15 European countries, Austria has the highest ranking in terms of the Health and hygiene pillar. When looking at the Human resources and labour mar-ket, Switzerland is the first, and Iceland is the second country in Europe. Finland tops the ranking of ICT readi-ness. Spain and Iceland share the first place in the Prioritization of travel & tourism pillar. Ireland and Iceland are the first two European countries according to International openness. Portugal and Spain lead in Europe in Price competitiveness. Switzerland dominates in Environmental sustainability. United Kingdom, Switzerland and Norway occupy top three scores in the Air transport infrastructure. Netherlands, Switzerland and Germany have recorded three best scores for the Ground and port transport infrastructure. Austria is the best in Europe according to the Tourist service infrastructure. France and the United Kingdom have the best Natural resources. Spain and France have recorded two best scores in the Cultural resources and business travel.
4.3
Comparative Analysis of Tourism Competitiveness Determinants Within the CEE Countries
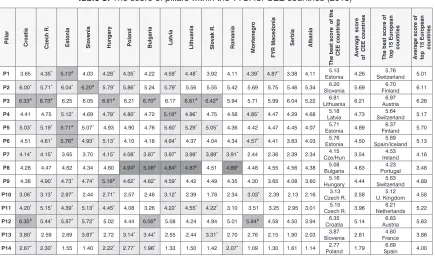
To assess the achievements of the CEE countries in each pillar treated as tourism competitiveness determi-nants, the scores of 14 pillars within the TTCI for 2015 are presented in Table 3. The information serves to un-derstand the relative positions of countries according to each pillar compared to the best score, the average score of the CEE countries, as well as the best score and the average score of the top 15 European countries.
Table 3: The score of pillars within the TTCI for CEE countries (2015)
Source: The Word Economic Forum, The Travel & Tourism Competitiveness Report 2015
Legend:
Indicates that the value is below the average score of the CEE group of countries. * Indicates that the value is above the average score of the CEE group of countries. # Indicates that the value is above the average score of top 15 European countries.
0 Indicates that the value is above the score of the best country in the group of top 15 European countries.
P
illar
Croatia Czec
h
R.
Estonia Slov
enia Hun g ary Po la n d Bulgaria Lat via Li th u a n ia S
lovak R. Rom
a n ia Mon te n egr o FY R M a c e d o n ia
Serbia Alb
a
n
ia
The best
sco
re o
f the
CEE
countries
Averag
e score
of CE
E cou n tr ie s T h
e best score of
top 15 Euro
pean countries A v er age scor e of
top 15 European
countries
P1 3.65 4.35* 5.13# 4.03 4.28* 4.35* 4.22 4.59* 4.48* 3.92 4.11 4.39* 4.87* 3.38 4.11 5.13
Estonia 4.26 5.76 Switzerland 5.01
P2 6.00* 5.71* 6.04* 6.20# 5.79* 5.86* 5.24 5.79* 5.56 5.55 5.42 5.69 5.75 5.46 5.34 6.20
Slovenia 5.69 6.70 Finland 6.11
P3 6.33# 6.73# 6.25 6.05 6.61# 6.21 6.70# 6.17 6.81# 6.42# 5.94 5.71 5.99 6.04 5.22 6.81
Lithuania 6.21 6.97 Austria 6.28
P4 4.41 4.75 5.12* 4.69 4.79* 4.80* 4.72 5.18# 4.96* 4.75 4.56 4.85* 4.47 4.29 4.68 5.18
Latvia 4.73 5.64 Switzerland 5.17
P5 5.03* 5.19* 5.71# 5.07* 4.93 4.90 4.76 5.60* 5.29* 5.05* 4.36 4.42 4.47 4.45 4.07 5.71
Estonia 4.89 6.37 Finland 5.70
P6 4.51 4.61* 5.76# 4.93* 5.13* 4.10 4.18 4.64* 4.37 4.04 4.34 4.57* 4.41 3.83 4.03 5.76
Estonia 4.50 5.89 Spain/Iceland 5.13
P7 4.14* 4.15* 3.65 3.70 4.15* 4.08* 3.87* 3.97* 3.99* 3.89* 3.91* 2.44 2.36 2.39 2.34 4.15
Cze/Hun 3.54 4.53 Ireland 4.16
P8 4.28 4.47 4.62 4.34 4.60 4.940 5.080 4.840 4.870 4.51 4.890 4.48 4.55 4.56 4.38 5.08
Bulgaria 4.63 4.23 Portugal 3.48
P9 4.38 4.90* 4.73* 4.74* 5.16# 4.62* 4.62* 4.59* 4.42 4.49 4.35 4.30 3.65 4.08 3.60 5.16
Hungary 4.44 5.63 Switzerland 4.89
P10 3.06* 3.13* 2.97* 2.44 2.71* 2.57 2.46 3.12* 2.39 1.78 2.34 3.03* 2.39 2.13 2.16 3.13
Czech R. 2.58 5.12 U. Kingdom 4.58
P11 4.20* 5.15* 4.39* 5.13* 4.45* 4.08 3.26 4.22* 4.55* 4.22* 3.10 3.51 3.25 2.95 3.01 5.15
Czech R. 3.96 6.21 Netherlands 5.22
P12 6.35# 5.44* 5.87* 5.72* 5.02 4.44 6.06# 5.08 4.24 4.94 5.01 5.84# 4.58 4.50 3.94 6.35
Croatia 5.14 6.83 Austria 5.83
P13 3.80* 2.59 2.69 3.87* 2.72 3.14* 3.44* 2.55 2.44 3.31* 2.70 2.76 2.15 1.90 2.03 3.87
Slovenia 2.81 4.80 France 3.86
P14 2.67* 2.30* 1.55 1.40 2.22* 2.77* 1.96* 1.33 1.50 1.42 2.07* 1.09 1.30 1.61 1.14 2.77
Analyzing the CEE group of countries, the Health and hygiene pillar records the highest average value (6.21), followed by the Safety and security (5.69) and the Tourist service infrastructure (5.14). Nevertheless, bearing in mind that the maximum value of the pillar is 7.00, the CEE countries have many possibilities for improvement of almost all their performances that determine the T&T competitiveness.
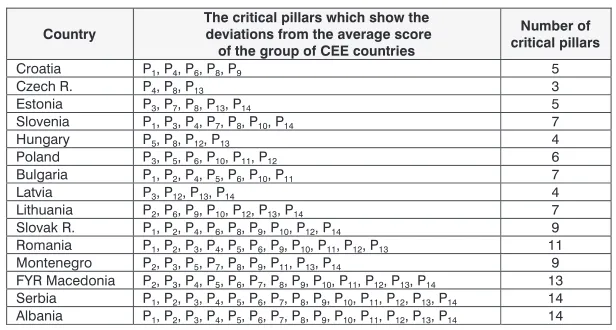
Based on the above stated analysis, the list of critical pillars in the CEE countries that need to be the prior-ity in development policies and improvements as soon as possible to reach the average value of the group can be determined (see Table 4).
Table 4:Pillars within the TTCI which require improvements and priority of tourist development policy by CEE countries (2015)
The total number of deviations below the average value of the TTCI (observed by pillars) shows that the worst positioned countries are Albania and Serbia (14 critical pillars), the FYR Macedonia (13 critical pil-lars), Romania (11 critical pilpil-lars), the Slovak Republic and Montenegro (9 critical pillars). By poorer per-formance compared to the average score of the CEE group, after the abovementioned countries, stand out Bulgaria, Lithuania and Slovenia with 7 critical pillars. All of these countries must necessarily make a lot of effort to make improvements that bring them closer to the average value of the CEE group of countries.
It is important to identify the pillars in which most CEE countries record a deviation. The Price competitive-ness and the Natural resource pillars require intervention and improvement by the majority of countries in the analyzed CEE group (10 from 15 countries) (see Table 4).
The urgent actions for improving scores of the Health and hygiene, the Human resources and labour mar-ket, the Prioritization of travel & tourism, the Air transport infrastructure, the Tourist service infrastructure and the Cultural resource and business travel pillars are necessary in nine countries. The Safety and security, the ICT readiness and the Environmental sustainability are problematic and need corrective action in eight countries. Seven countries have to improve initiatives in the case of the Business environment and the Ground and port infrastructure pillars. The International openness requires improvement in six countries of the CEE group.
4.4
Benchmarking of Tourism Industry Competitiveness of CEE Countries
in Relation to the Top 15 European Countries
The aim of this research segment is to show and analyze the critical pillars of the TTCI. Problematic pillars, according to their performances, require to be the priority of economic policy of the CEE countries. In order to determine the critical pillars it is necessary to perform the comparison of the average score of the pillars (1 to 14) for the CEE group of countries and the group of top 15 European countries.
The biggest gaps between the average scores of the top 15 European countries and the CEE countries are in the following pillars (see Table 3): Cultural resources and business travel (2.21), Air transport
infrastruc-Country
The critical pillars which show the deviations from the average score
of the group of CEE countries
Number of critical pillars
Croatia P1, P4, P6, P8, P9 5
Czech R. P4, P8, P13 3
Estonia P3, P7, P8, P13, P14 5
Slovenia P1, P3, P4, P7, P8, P10, P14 7
Hungary P5, P8, P12, P13 4
Poland P3, P5, P6, P10, P11, P12 6
Bulgaria P1, P2, P4, P5, P6, P10, P11 7
Latvia P3, P12, P13, P14 4
Lithuania P2, P6, P9, P10, P12, P13, P14 7
Slovak R. P1, P2, P4, P6, P8, P9, P10, P12, P14 9
Romania P1, P2, P3, P4, P5, P6, P9, P10, P11, P12, P13 11
Montenegro P2, P3, P5, P7, P8, P9, P11, P13, P14 9
FYR Macedonia P2, P3, P4, P5, P6, P7, P8, P9, P10, P11, P12, P13, P14 13
Serbia P1, P2, P3, P4, P5, P6, P7, P8, P9, P10, P11, P12, P13, P14 14
ture (2.00), Ground and port infrastructure (1.26), Natural resources (1.05) and ICT readiness (0.81). These pillars are the priority areas for the CEE countries to improve performances and achieve a better place in the ranking list. Improvement in the aforementioned areas needs a large amount of investments, especially when it comes to air transport, ground and port infrastructure. The CEE countries lag at least when it comes to the Health and hygiene pillar. In this pillar, the difference of average scores is the lowest (0.07).
However, the CEE countries have a better average score than the average score of the top 15 European countries in the Price competitiveness pillar (see Table 3). Interestingly, all fifteen CEE countries show bet-ter performance in case of the Price competitiveness pillar. When it comes to Health and hygiene, countries such as Croatia, the Czech Republic, Hungary, Bulgaria, Lithuania and the Slovak Republic exceed the av-erage of the top 15 European countries. For these countries the Austrian score of 6.97 may serve as a bench-mark standard. Croatia, Bulgaria and Montenegro scored better results than the top 15 European countries average in the Tourist service infrastructure pillar. These countries can use an Austrian score of 6.83 as a tar-get, i.e., the benchmark value in the development policy of tourism. Estonia exceeds the average of the top 15 European countries in terms of Business environment, ICT readiness and Prioritization of travel & tourism. Slovenia exceeds the average of the top 15 European countries in terms of Safety and security, so Iceland (6.54) can serve as a target standard. Hungary scored a better result than the top 15 European countries average in the Environmental sustainability pillar. Latvia achieves a better performance than the average of the top 15 European countries in the Human resources and labour market pillar.
The analysis of the pillars shows that all CEE countries deviate from the average score of the top 15 countries in the following pillars: International openness, Air transport infrastructure, Ground and port infrastructure, Nat-ural resources, and CultNat-ural resources and business travel (see Table 3). When it comes to Business environ-ment, Safety and security, Human resources and labour market, ICT readiness, Prioritization of travel & tourism, and Environmental sustainability, fourteen CEE countries lag behind the average score of the top 15 European countries. According to the Tourist service infrastructure pillar, twelve CEE countries have a lower average score than the average score of the top 15 European countries. The purpose of this benchmarking is to find bench-mark standards for the CEE countries which are relevant to guiding and defining development goals in the T&T. Benchmark standards are target levels that each country can set in the tourism development strategy.
Based on the earlier analysis, certain observations can be specified about the priorities in the development policy of each country from the CEE group. The criteria are based on the urgency or time priority. Firstly, the CEE countries should improve pillars in which they deviate from the average scores of the CEE countries. When they succeed in this, the aim should be the average score of the top 15 European countries. After they have reached that score, the CEE countries can set a higher goal - the level of performance of the best countries in the group of the top 15 European countries. The systematization of pillars is given in Table 5.
Table 5: Specification of pillars within the TTCI according to priority and urgency of their necessary improvement by the CEE countries
Note: Price competitiveness pillar (P8) is not included in the table because all CEE countries
exceed the average score of the top 15 European countries according to this pillar
Country
The first level priority of pillars – the benchmark is
the average of CEE countries
The second level priority of pillars - the benchmark is the
average of top 15 European countries
The third level priority of pillars - the benchmark is the best country among top 15 European countries
Croatia P1, P4, P6, P9 P2, P5, P7, P10, P11, P13, P14 P3, P12 Czech R. P4, P13 P1, P2, P5, P6, P7, P9, P10, P11, P12, P14 P3 Estonia P3, P7, P13, P14 P2, P4, P9, P10, P11, P12 P1, P5, P6 Slovenia P1, P3, P4, P7, P10, P14 P5, P6, P9, P11, P12, P13 P2 Hungary P5, P12, P13 P1, P2, P4, P6, P7, P10, P11, P14 P3, P9 Poland P3, P5, P6, P10, P11, P12 P1, P2, P4, P7, P9, P13, P14 - Bulgaria P1, P2, P4, P5, P6, P10, P11 P7, P9, P13, P14 P3, P12 Latvia P3, P12, P13, P14 P1, P2, P5, P6, P7, P9, P10, P11 P4 Lithuania P2, P6, P9, P10, P12, P13, P14 P1, P4, P5, P7, P11 P3 Slovak R. P1, P2, P4, P6, P9, P10, P12, P14 P5, P7, P11, P13 P3 Romania P1, P2, P3, P4, P5, P6, P9, P10, P11, P12, P13 P7, P14 -Montenegro P2, P3, P5, P7, P9, P11, P13, P14 P1, P4, P6, P10 P12 FYR Macedonia P2, P3, P4, P5, P6, P7, P9, P10, P11, P12, P13, P14 P1 -Serbia P1, P2, P3, P4, P5, P6, P7, P9, P10, P11, P12, P13, P14 - -
The specification of pillars shown in Table 5 gives guidance in defining priorities in the tourism development strategy, i.e., the priorities for pillars improvement as determinants of their competitiveness. The authors have found that Albania and Serbia have 13 critical pillars in the first level priority of pillars. The Price com-petitiveness pillar (P8) is not included in the specification of pillars shown in Table 5 because all CEE countries
have a better score in this pillar than Portugal (4.23), the best ranked European country in the top 15 according to price competitiveness. However, Albania and Serbia have lower performances compared to the average score of the CEE group even in this pillar.
In an exploration of the tourism competitiveness determinants, the benchmarking method will not fulfill its purpose if it is not used for a further in-depth analysis of the indicators within the pillars. For one country, the score of each pillar depends on the real values of the indicators within that pillar. Formulating national strategies for improving the tourism competitiveness in the CEE countries is not possible without concentrating on the precise setting of the target level of indicators within each pillar, using benchmarking. By applying this approach, benchmarking can, in a more correct and detailed way, show all critical deter-minants of the tourism competitiveness. This step can be performed by calculating the volume of a nega-tive (problematic) deviation in the value of each indicator within the pillar. The identified critical deviations from the benchmark standard require improvement actions, and direct the policy makers and tourism de-velopment creators in the CEE countries to define the right goals. In the future period, each country should make efforts to achieve their determined goals in order to improve thire competitive score and their rank on both the European and the world TTCI lists.
Conslusion
The tourism industry plays an important role in the European development policy given its significant contribution to the GDP and employment. In addition, European countries are prominent tourist destinations and world leaders in terms of competitiveness. This supports the fact that the top three countries in the world, according to the tourism competitiveness, are European countries. However, not all countries in Europe are competitive tourist destinations. Therefore, the focus of the study is the group of the CEE countries, which are the ones that are not among the top 15 most competitive European destinations.
The results of the benchmarking method that is applied in the paper point out the competitive factors (pillars) that need to be improved by the CEE countries and indicate the priority of its improving. Cultural resources and business travel, Air transport infrastructure, Natural resources, Ground and port infrastructure, and Tourist service infrastructure are priority areas for improvement in the CEE countries in order that they should achieve a better position in the world. However, some CEE countries achievt higher scores and better competitiveness levels than the top 15 European countries in terms of Busi-ness environment, ICT readiBusi-ness, and Prioritization of travel & tourism (Estonia); Health and hygiene (Croatia, the Czech Republic, Hungary, Bulgaria, Lithuania and the Slovak Republic); Safety and security (Slovenia); Human resources and labour market (Latvia); Environmental sustainability (Hungary); and Tourist service infrastructure pillars (Croatia, Bulgaria and Montenegro). All CEE countries show better performances in the case of Price competitiveness pillar than the best ranked country of the top 15 European countries. In addition, some CEE countries, in case of competitiveness in some pillars, do not reach the average score of the CEE group, so in the future, their tourism development policy, strategies and national action plans should focus on these factors of competitiveness. Upon achieving improvements in such factors, the CEE countries should strive to advance the pillars which can reach the average of the top 15 European countries.
REFERENCES
[1] Ayikoru, M. (2015). Destination competitiveness challenges: A Ugandan perspective, Tourism Man-agement, 50, 142-158. doi: http://dx.doi.org/10.1016/j.tourman.2015.01.009
[2] Bălan, D., Balaure, V., & Vegheş, C. (2009). Travel and Tourism Competitiveness of the World’s Top Tourism Destinations: An Exploratory Assessment, Annales Universitatis Apulensis Series Oeconomica, 11(2), 979-987.
[3] Bimonte, S., & Punzo, L. (2016). Tourist development and host-guest interaction: An economic exchange theory, Annals of Tourism Research, 58, 128-139. doi:
http://dx.doi.org/10.1016/j.annals.2016.03.004
[4] Bobiră, A., & Cristureanu, C. (2006). Competitiveness Assessment and Growth Opportunities of the Ro-manian Tourism Industry, RoRo-manian Economic Journal, Year IX, No. 21, 5-20.
[5] Butnaru, G.I., & Niță, V. (2016). European Union and Romanian Tourism –βand σConvergence in the Economic Development Regions of Romania, Amfiteatru Economic, 18(42), 369-384.
[6] Cîrstea, S.D. (2014). Travel & Tourism competitiveness: a study of world’s top economic competitive countries, Procedia Economics and Finance, 15, 1273-1280. doi: 10.1016/S2212-5671(14)00588-7 [7] Cooper, C., Fletcher, J., Fyall, A., Gilbert, D., & Wanhill, S. (2008). Tourism: Principles and Practice,
Pearson Education Limited, England.
[8] Corne, A. (2015). Benchmarking and tourism efficiency in France, Tourism Management, 51, 91-95. doi: http://dx.doi.org/10.1016/j.tourman.2015.05.006
[9] Crouch, G.I., & Ritchie, J.R.B. (1999). Tourism, Competitiveness and Societal Prosperity, Journal of Business Research, 44, 137-152.
[10] Dupeyras, A., & MacCallum, N. (2013). Indicators for Measuring Competitiveness in Tourism: A Guid-ance Document, OECD Tourism Papers, 2013/02, OECD Publishing.
[11] European Travel Commission (2015). European Tourism 2015 – Trends & Prospects, Quarterly Report. [12] Hassan, S.S. (2000). Determinants of Market Competitiveness in an Environmentally Sustainable
Tourism Industry, Journal of Travel Research, 38(3), 239-245. doi: 10.1177/004728750003800305 [13] Kadiyali, V., & Kosová, R. (2013). Inter-industry employment spillovers from tourism inflows, Regional
Science and Urban Economics, 43(2), 272-281.
[14] Čerović, S., Knežević, M., & Pavlović, D. (2016). The Effects of Tourism on the GDP of Macedonia, Mon-tenegro and Serbia in the Process of European Integration. Amfiteatru Economic, 18(42), 407-422. [15] Kozak, M. (2004). Destination Benchmarking: Concepts, Practices and Operations, Wallingford: CABI. [16] Kozak, M., & Rimmington, M. (1999). Measuring Tourist Destination Competitiveness: Conceptual Con-siderations and Empirical Findings, International Journal of Hospitality Management, 273-283. doi: 10.1016/S0278-4319(99)00034-1
[17] Krstić, B., Jovanović, S., & Stanišić, T. (2014). Central and East European countries’ tourism competi-tiveness as a factor of their national competicompeti-tiveness level, Journal of tourism - studies and research in tourism, 18, 61-68.
[18] Lennon, J. (2006). Benchmarking National Tourism Organizations and Agencies: Understanding Best Practice, Taylor & Francis Group.
[19] Li, H., Chen, J.L., Li, G., & Goh, C. (2016). Tourism and regional income inequality: Evidence from China, Annals of Tourism Research, 58, 81-99. doi: http://dx.doi.org/10.1016/j.annals.2016.02.001 [20] Lin, C.T., & Huang, Y.L. (2009). Tourism Competitiveness Evaluation in Asian Countries Applying GRA
and Sensitivity Analysis, Journal of Grey System, 21(3), 269-278.
[21] Mihalič, T. (2000). Environmental Management of a Tourist Destination: A Factor of Tourism Competi-tiveness, , ), 65-78.
[22] Navickas, V., & Malakauskaite, A. (2009). The Possibilities for the Identification and Evaluation of Tourism Sector Competitiveness Factors, Engineering Economics, 61(1), 37-44.
[23] Papp, Z., & Raffay, A.K. (2011). Factors influencing the tourism competitiveness of former socialist coun-tries, Human Geographies – Journal of Studies and Research in Human Geography, 5(2), 21-30. [24] Popescu, D. (2014). Contemporary approaches and challenges of tourism sustainability, Amfiteatru
Economic, 16(8), 1045-1047.
[25] Raun, J., Ahas, R., & Tiru, M. (2016). Measuring tourism destinations using mobile tracking data, Tourism Management, 57, 202-212. doi: http://dx.doi.org/10.1016/j.tourman.2016.06.006
[27] Sharpley, R. (2015). Tourism: A vehicle for development. In R. Sharpley & D. Telfer (Eds.), Tourism and development: Concepts and issues, Bristol, Channel View Publications, 3-30.
[28] Temirbulatova, M., & Borza, M. (2015). Multifunctional development of rural areas of Kazakhstan with the application of the unified model of tourism in the context of sustainable development and the green economy, European Scientific Journal, 11(1), 200-216.
[29] Vodeb, K. (2012). Competition in Tourism in Terms of Changing Environment, Procedia – Social and Be-havioral Sciences, 44, 273-278. doi:
[30] Wobër, K. (2002). Benchmarking in Tourism and Hospitality Industries: The Selection of Benchmarking Partners, CABI.
[31] World Economic Forum (2015). The Travel & Tourism Competitiveness Report 2015, Accessed at (2016 Feb 7).
[32] World Travel & Tourism Council (2015). Benchmarking Travel & Tourism: How Does Travel & Tourism Compare to the Other Sector?, Europe Summary of Findings, London, Accessed at (2016 Feb 7). [33] Yasin, M., Alavi, J., Koubida, S., & Small, M. (2011). An assessment of the competitiveness of the
Moroccan tourism industry: Benchmarking implications, Benchmarking – An International Journal, 18(1), 6-22. doi:
Receieved:May 2016.
Accepted: September 2016.
Bojan Krstić
University of Niš, Faculty of Economics
Bojan Krstic is Associate Professor at the University of Nis, Faculty of Economics, Serbia, manager of national scientific and research project titled Improving the competitiveness of the Public and Private sectors by networking competences in the process of European integrations, as well as executive editor of the Ekonomika – Journal for economic theory and practice and social issues, which dates back to 1954. His professional interests include competitiveness of enterprises and national economies, strategic management, strategic control, control systems, business performance management, knowledge and intellectual capital management, theory of firm, as well as competitive strategy. He has published 9 books and monographs, more than 215 scientific journal articles and conference papers, and he is an editor of 11 thematic collections of papers of international significance.
Vladimir Radivojević
Ministry of Defense of the Republic of Serbia, Serbian Armed Forces, Niš
Vladimir Radivojević earned his PhD degree at the Faculty of Economics, University of Niš. He works as head of financial services at the Serbian Armed Forces, Ministry of Defense. He is an assembly member of the Association of Economists in Niš, member of the Serbian Mensa society and a lay judge at the Military Disciplinary Court in Niš. He is an author or coauthor of several papers published in domestic and foreign scientific journals and conference proceedings.
Tanja Stanišić
University of Kragujevac, Faculty of Hotel Management and Tourism in Vrnjačka Banja
Tanja Stanišić is an assistant professor at the Faculty of Hotel Management and Tourism in Vrnjačka Banja (University of Kragujevac). She is a member of the Association of Economists in Niš. Her interests include competitiveness, competition policy,
and tourism. She has published the papers in many domestic and foreign scientific journals and conference proceedings.