Cite as
Sadowska J, Rygielska M. The effect of high fructose corn syrup on the plasma insulin and leptin concentration, body weight gain and fat accumulation in rat. Adv Clin Exp Med. 2019;28(7):879–884. doi:10.17219/acem/94069
DOI
10.17219/acem/94069
Copyright
© 2019 by Wroclaw Medical University This is an article distributed under the terms of the Creative Commons Attribution Non-Commercial License (http://creativecommons.org/licenses/by-nc-nd/4.0/)
Address for correspondence
Joanna Sadowska
E-mail: joanna.sadowska@zut.edu.pl
Funding sources
None declared
Conflict of interest
None declared
Received on February 26, 2016 Reviewed on May 9, 2016 Accepted on August 8, 2018
Published online on June 18, 2019
Abstract
Background. Studies on the effects of high fructose corn syrup (HFCS) on the metabolism are scarce and their results are inconsistent.
Objectives. The aim of this research was to examine in an animal model the effect of replacing sucrose with HFCS-55 on the levels of glucose, insulin and leptin, and on the consumption of feed, body weight gain and fat storage.
Material and methods. The experiment was carried out on 30 Wistar male rats aged 5 months, fed 3 different diets, containing whole grains (group I), 10% sucrose (group II) and 10% HFCS (group III). Results. It was found that the amount of daily energy intake was similar for all the groups of animals. There was no difference in fasting glucose and insulin level and homeostatic model assessment for insulin resistance (HOMA-IR) index. The higher leptin level was determined in blood plasma of the animal fed a feed with sucrose (group 2) compared to group 1 and group 3 (360 ng/mL vs 263 and 230 ng/mL, respectively). Despite the similar amounts of consumed energy, the animals fed with modified feeds achieved higher weight gain and the effect of HFCS-55 was similar to the effect of sucrose.
Conclusions. The obtained results indicate similar metabolic effects of HFCS-55 and sucrose in feed, at the level of 11% dietary energy value, on the energy intake, body weight gain and periorgan adipose tissue accumulation in rats. The results suggest that accusations against HFCS as the major dietary contributor to overweight and obesity are unfounded, and the total elimination of HFCS from the diet seems to be unnecessary. The modified feeds (containing both sucrose and HFCS) produced greater absolute weight gain and weight gain per kilojoule consumed compared to standard feeds. This may indicate not just a basic thermodynamic consequence of consuming more energy, but a change in the metabolic efficiency when consuming a diet with simple sugars and refined carbohydrates.
Key words: insulin, leptin, body weight, HFCS, fat tissue
The effect of high fructose corn syrup on the plasma insulin and leptin
concentration, body weight gain and fat accumulation in rat
Joanna Sadowska
A,C–F, Magda Rygielska
B–DDepartment of Human Nutrition Physiology, Faculty of Food Sciences and Fisheries, West Pomeranian University of Technology
A – research concept and design; B – collection and/or assembly of data; C – data analysis and interpretation; D – writing the article; E – critical revision of the article; F – final approval of the article
Introduction
The widespread use of high fructose corn syrup (HFCS) in the food industry has dynamically increased its con-sumption (by over 1,000% between 1970 and 1990), but studies on the health effects of HFCS have begun relatively recently.1,2 For many years, HFCS has been considered
a replacement for sucrose, having comparable metabolic effects. However, the increased number of obese people observed since the introduction of HFCS, for example in the USA, suggests a positive correlation between body weight gain and HFCS consumption.3,4 Currently, this
dietary component is being attributed a significant role in the development of obesity, which is classified as an ex-tended metabolic disease that increases the risk of type 2 diabetes, hypertension, lipid disorders, cardiovascular dis-ease, gout, kidney stones, and certain cancers.5,6
Statistics suggest that regular consumption of products containing HFCS increases appetite and promotes obesity and lipid disorders.7 However, in population studies, other
factors that also affect weight gain and nutrient metabolism, not just those related to food and HFCS intake, have not been assessed at the individual level. In addition, in many review papers the metabolic effect of HFCS is treated as an equivalent to that of pure fructose, which is clearly a mistake. Despite its name, the most widely used HFCS-55 form contains 55% fructose, 42% glucose and 3% other sug-ars, which is quite similar to the composition of sucrose (50% fructose and 50% glucose). Moreover, most studies have been conducted with the use of HFCS solutions drunk by animals, although HFCS is also present in solid foods. Animal model studies on the metabolic effects of HFCS are scarce and their results are divergent; however, many of them have confirmed adverse metabolic effects of HFCS,8
due to possible alternations in energy homeostasis resulting from changes in leptin and insulin concentrations. How-ever, not all studies confirm the adverse impact of HFCS on humans and experimental animals.9–11 Organizations
such as the American Medical Association (AMA) and the American Dietetic Association (ADA) have even issued a statement confirming metabolic equivalence of HFCS and sucrose.12,13
The aim of this research was to examine the effect of re-placing sucrose with HFCS-55 (55% fructose and 42% glu-cose) in an animal model on the levels of insulin and leptin, and also on the consumption of feed, body weight gain and fat storage.
Material and methods
Material
The experiment, after approval of the Local Ethics Commission for Animal Experiments in Szczecin (ap-proval No. 1/2012), was carried out in the vivarium
of the Department of Human Nutritional Physiology, West Pomeranian University of Technology, Szczecin, Poland, on 30 Wistar male rats aged 5 months, of initial body weight 398 ±32.6 g. Rats were obtained from the animal husbandry of Chair and Department of Toxicology, Poznan University of Medical Sciences.
Methods
Following a week-long conditioning on the standard rat laboratory chow in the vivarium environment (tempera-ture 21–22°C, humidity 55–60%, 12 h/12 h light/dark cy-cle), the animals were sorted into 3 equinumerous groups (n = 10) of equal body weight, housed in individual cages and fed ad libitum on pelleted feeds composed of the same components, besides those differentiating, produced by the Feeds and Concentrates Plant in Kcynia, Poland, after having implemented the procedure 5.14.5. “Cleaning of machines and devices”. Group I was fed standard feed (Labofeed H), while group II received modified feed 1 and group III – modified feed 2. In the modified feed 1, 83.5% of wheat was substituted with wheat flour and 50% of corn grain was substituted with sucrose (in relation to standard feed). In modified feed 2 sucrose was substituted with high fructose corn syrup-55 (HFCS-55 – 55% content of fruc-tose, in powder) in relation to modified feed 1. The selec-tion of HFCS-55 resulted from the fact that it contains more fructose (than HFCS-42), which exerts adverse meta-bolic effects. HFCS-55 is added not only to beverages but also to solid foods.
Sucrose or HFCS accounted for 11.6% of the energy value of the diet. The percentage of the remaining components was unchanged (Table 1). Changes of feed components
Table 1. Component composition of feeds used in the experiment [g/100 g]
Component Basic feed Modified feed 1 Modified feed 2
Wheat 36.4 6 6
Corn grain 20 10 10
Wheat bran 20 20 20
Dry whey 3 3 3
Fodder salt1 0.3 0.3 0.3
Soya-bean grain 17 17 17
Fodder chalk2 1.5 1.5 1.5
Phosphate 2-CA3 0.8 0.8 0.8
Vitamin-mineral premix4 1 1 1
Wheat flour – 30.4 30.4
Sucrose – 10 –
High fructose corn
syrup-55 (in powder) – – 10
1 – mainly NaCl; 2 – mainly CaCO
were designed to reflect the changes taking place today in the composition of diets, which contains simple sugars and refined carbohydrates. For drinking, animals were provided pure, settled tap water.
Analyses
The prepared diets were subjected to chemical analy-sis14 to determine the contents of total nitrogen with
Kjeldahl’s method, on Kjeltec 2100 apparatus (Foss, Hil-leroed, Denmark), converted to quantity of protein, crude fat with Soxhlet’s method, on Soxtec 1046 apparatus (Foss, Hilleroed, Denmark), dry matter (using a gravimetric method), ash (with a gravimetric method), and fiber with an ANKOM 220 apparatus (Ancom Technologies, New York, USA). The content of digested carbohydrates was derived from the difference between dry matter and the re-maining solid components. The metabolic energy was cal-culated using commonly applied energy equivalents: pro-tein – 4.0 kcal/g (16,76 kJ/g), fat – 9.0 kcal/g (37.71 kJ/g) and digested carbohydrates – 4.0 kcal/g (16.76 kJ/g) (Table 2).
The experiment lasted for 7 weeks, during which the amount of feed consumed by the animals was record-ed daily, whereas once a week the animals were weighrecord-ed. The amount of feed consumed was calculated from the dif-ference between the weight of the feed given to the feeder and the mass of feed, which was left in the feeder, and the one that fell to the bottom frame. Upon completion of the experiment, the animals were fasted overnight (12 h) and anesthetized with an intramuscular injection (10 mg/kg b.w.) of Ketanest (Pfizer Ireland Pharmaceuti-cals, Cork, Ireland). Blood was sampled from the heart to tubes with anticoagulant and centrifuged at 2,000 g for 10 min at 4°C (MPW 350-R; MPW Medical Instruments, Warszawa, Poland). Plasma samples were stored at 4°C and assayed within 24 h.
Intraperitoneal and retroperitoneal fat was dissected out immediately after sacrificing the rats and weighed.
Blood plasma obtained after clot centrifugation was as-sayed for the concentration of glucose with colorimetric method (biotest kit ref. No. 11503 BioSystems, Barcelona, Spain) on the Metertech spectrophotometer (Metertech, Taipei, Taiwan), insulin and leptin with enzyme-linked immunosorbent assay (ELISA) kit (Rat ELISA kit Demed-itec Diagnostics, Kiel, Germany, insulin ref. No. DE2048; leptin ref. No. DEE006), according to the manufacturer’s instructions. Assays were performed using EnVision ap-paratus (PerkinElmer Inc., Waltham, USA). To quantify insulin resistance and beta-cell function, a homeostatic model assessment for insulin resistance (HOMA-IR) was used, where: HOMA-IR = fasting glucose [mmol/L] × fast-ing insulin [µU/L]/22.5.15
Statistics
Biochemical data is shown as mean (Me) and standard deviation (SD). The resulting data was tested for normality of distribution (Shapiro–Wilk test) and processed statisti-cally with STATISTICA software package v. 9 (StatSoft Inc., Tulsa, USA), using the post hoc Duncan test at the sig-nificance level α = 0.05.
Results
The analysis of the results revealed that rats with a su-crose-containing diet consumed statistically significantly less food, although the amount of daily energy intake was similar for all the groups of animals (Table 3).
There was no difference in fasting glucose and fasting insulin level and HOMA-IR index between the groups (Table 3). There was, however, a marked difference in the level of leptin determined in fasting blood. A higher leptin level was determined in blood plasma of the animal fed the modified feed with sucrose compared to the other groups of animals.
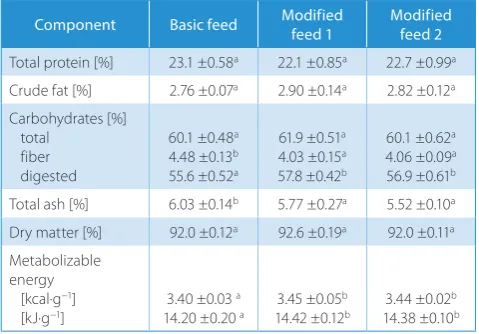
Table 2. Chemical composition of feeds used in the experiment
Component Basic feed Modified feed 1 Modified feed 2
Total protein [%] 23.1 ±0.58a 22.1 ±0.85a 22.7 ±0.99a Crude fat [%] 2.76 ±0.07a 2.90 ±0.14a 2.82 ±0.12a Carbohydrates [%]
total fiber digested
60.1 ±0.48a 4.48 ±0.13b 55.6 ±0.52a
61.9 ±0.51a 4.03 ±0.15a 57.8 ±0.42b
60.1 ±0.62a 4.06 ±0.09a 56.9 ±0.61b Total ash [%] 6.03 ±0.14b 5.77 ±0.27a 5.52 ±0.10a Dry matter [%] 92.0 ±0.12a 92.6 ±0.19a 92.0 ±0.11a Metabolizable
energy [kcal·g−1]
[kJ·g−1] 3.40 ±0.03
a
14.20 ±0.20 a 3.45 ±0.05 b
14.42 ±0.12b 3.44 ±0.02 b 14.38 ±0.10b
a,b – means that denoted different letters in the same line are statistically different, p ≤ 0.05.
Table 3. Effect of diet type on feed and energy intake, plasma glucose, insulin and leptin concentration and HOMA-IR index in rats, ±SD, n = 30
Trait Group I Group II Group III
Feed intake [g/day] 17.7 ±1.03a 17.0 ±1.22a 17.8 ±0.91a Feed intake
[g/100 g body weight/day] 3.90 ±0.11b 3.77 ±0.09a 3.89 ±0.11b Energy intake
[kJ/day] 251 ±14.7a 245 ±17.5a 255 ±13.0a
Energy intake
[kJ/100 g body weight/day] 55.4 ±2.15a 54.4 ±1.93a 55.6 ±1.62a Glucose [mmol/L] 7.12 ±1.05a 7.48 ±1.65a 7.11 ±0.88a Insulin [pmol/L] 42.0 ±11.6a 47.3 ±18.6a 44.0 ±16.3a
HOMA-IR 1.94 ±0.57a 2.10 ±0.62a 1.89 ±0.60a
Leptin [ng/mL] 263 ±84.2a 360 ±61.1b 230 ±59.7a
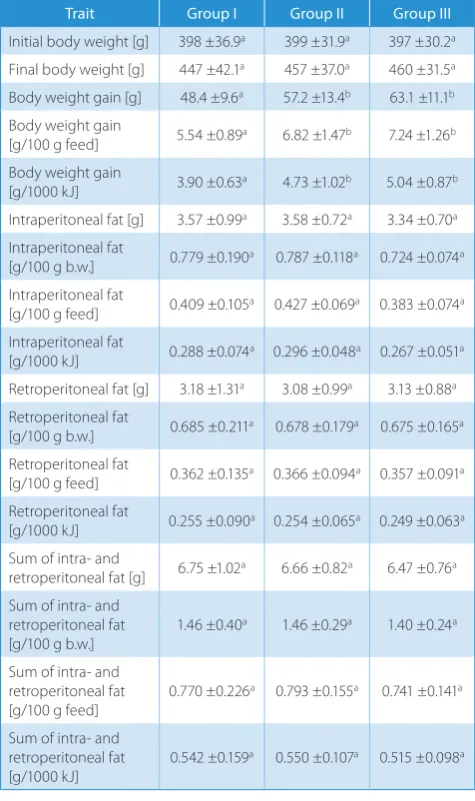
Despite the similar amounts of consumed energy, the an-imals fed with modified feeds achieved higher weight gain, both in absolute terms and per 100 g of consumed food and per unit of consumed energy, and the effect of HFCS-55 was similar to sucrose (Table 4).
When analyzing the obtained results, we observed no significant effect of replacing sucrose with HFCS on the amount of intraperitoneal and retroperitoneal adi-pose tissue (Table 4). The amount of periorgan adiadi-pose tissue was similar in all groups of animals.
Discussion
It was found that changes in the diet composition influ-enced the feed intake per body weight. Rats fed a sucrose-containing diet consumed statistically significantly less food, although the daily energy intake was similar for each animal group. Similar energy consumption at lower feed
intake may result from higher energy value of modified feeds. Lower consumption of feed containing sucrose com-pared to standard feed may have been caused by its higher energy value and its better digestibility due to the lower fiber content. DiMeglio and Mattes16 showed that
the con-sumption of sugars in solid foods, similarly to our experi-ment, results in compensatory leveling of the energy intake through the modification of the amount of consumed food. However, when carbohydrates are given in fluids, this regu-lation is less precise and the administered fluids increase the energy intake and body weight gain. The lower intake of feed by animals from group II may have also resulted from the increased level of leptin, which reduces food in-take by stimulating the satiety center.
One of the arguments against the use of HFCS is its po-tential ability to affect insulin and leptin levels, as fructose, unlike glucose, does not stimulate the secretion of insulin and leptin, and may increase the intake of food. In this study, HFCS reduced fasting leptin level, which in the long-term may have been the cause of increased food intake by animals from group III compared to group II. There were no differences in insulin levels between the groups.
In a study by Monsivais et al.,17 solutions of HFCS-55 and
sucrose exerted similar effects on insulin levels, satiety, and food intake in rats. Similar results were also reported by Akhavan and Anderson18 in men, and Melanson et al.9
in women. Soenen and Westerterp–Plantenga19 observed
no effect of HFCS consumed in soft drinks on either sati-ety, energy intake or body weight in men and women. They observed similar changes in the concentrations of ghre-lin, insulin and glucose resulting from the consumption of HFCS- and sucrose-containing drinks.
HFCS-55 administered in solid foods or fluids, in the amounts equivalent to 10–15% of dietary energy value, did not differ significantly from sucrose in terms of the effect on either levels of hormones regulating food intake, the sensation of satiety or energy intake. However, in the aforementioned studies,18,19 the insulin and leptin
levels were determined several times a day, directly after the consumption of drinks or foods containing HFCS-55 or sucrose. In our study, insulin and leptin levels were de-termined in fasting blood samples, so their changes should have resulted from long-term physiological processes and may affect long-term food intake. Despite the lower leptin levels in rats fed with a HFCS-containing mixture, their energy intake was not higher than in group II.
Despite the similar energy intake, the animals fed with modified feeds achieved greater weight gain, both absolute and relative (per 100 g of food consumed and per energy unit consumed), the effect of HFCS-55 being in this respect similar to sucrose. Insignificant effects of HFCS on body weight gain were also observed during the 8–10-week ex-periments by Akar et al.20 in male rats and by Light et al.21
in female rats. Similarly to our experiment, the female rats which consumed HFCS-55 had higher body weight gain compared to the control group but comparable
Table 4. Effect of diet type on body weight gain and amount and localization of fatty tissue in rats, ±SD, n = 30
Trait Group I Group II Group III
Initial body weight [g] 398 ±36.9a 399 ±31.9a 397 ±30.2a Final body weight [g] 447 ±42.1a 457 ±37.0a 460 ±31.5a Body weight gain [g] 48.4 ±9.6a 57.2 ±13.4b 63.1 ±11.1b Body weight gain
[g/100 g feed] 5.54 ±0.89a 6.82 ±1.47b 7.24 ±1.26b Body weight gain
[g/1000 kJ] 3.90 ±0.63a 4.73 ±1.02b 5.04 ±0.87b
Intraperitoneal fat [g] 3.57 ±0.99a 3.58 ±0.72a 3.34 ±0.70a Intraperitoneal fat
[g/100 g b.w.] 0.779 ±0.190a 0.787 ±0.118a 0.724 ±0.074a Intraperitoneal fat
[g/100 g feed] 0.409 ±0.105a 0.427 ±0.069a 0.383 ±0.074a Intraperitoneal fat
[g/1000 kJ] 0.288 ±0.074a 0.296 ±0.048a 0.267 ±0.051a Retroperitoneal fat [g] 3.18 ±1.31a 3.08 ±0.99a 3.13 ±0.88a Retroperitoneal fat
[g/100 g b.w.] 0.685 ±0.211a 0.678 ±0.179a 0.675 ±0.165a Retroperitoneal fat
[g/100 g feed] 0.362 ±0.135a 0.366 ±0.094a 0.357 ±0.091a Retroperitoneal fat
[g/1000 kJ] 0.255 ±0.090a 0.254 ±0.065a 0.249 ±0.063a Sum of intra- and
retroperitoneal fat [g] 6.75 ±1.02a 6.66 ±0.82a 6.47 ±0.76a Sum of intra- and
retroperitoneal fat [g/100 g b.w.]
1.46 ±0.40a 1.46 ±0.29a 1.40 ±0.24a
Sum of intra- and retroperitoneal fat
[g/100 g feed] 0.770 ±0.226
a 0.793 ±0.155a 0.741 ±0.141a
Sum of intra- and retroperitoneal fat
[g/1000 kJ] 0.542 ±0.159
a 0.550 ±0.107a 0.515 ±0.098a
to the animals receiving sucrose.21 Similar results were also
obtained by Figlewicz et al.22 Detailed studies on the effect
of HFCS on body weight gain was performed by Bocarsly et al.,23 who, in contrast, observed a significantly higher
weight gain in animals receiving HFCS compared not only to controls, but also to sucrose-receiving rats.
However, the form of administration of sugars was dif-ferent than in our study, i.e., in aqueous solution, which may modify the rate of absorption of monosaccharides, in-crease the glycemic effect, enhance energy overconsump-tion, and lead to fatty tissue accumulation. It is interesting that the modified feeds (both sucrose- and HFCS-con-taining one) produced not just greater weight gain than the standard feed, but also greater weight gain per energy unit consumed. This may indicate not just a basic ther-modynamic consequence of consuming more calories, but a change in the metabolic efficiency when consuming a diet with simple sugars and refined carbohydrates.
Therefore, the observed higher weight gain in animals fed with mixtures containing simple sugars and refined carbohydrates were not associated with intra-abdominal fat accumulation. They may have resulted from higher absorption of sodium and water in the digestive tract, enhanced by glucose present in food,24 and from higher
synthesis of glycogen (which binds water) or from fat accu-mulation in regions other than the examined visceral area. In an experiment by Bocarsly et al.,23 male rats
receiv-ing 8% HFCS solution accumulated much higher amounts of fat around the urinary tract and intra-abdominal fat, but not perivisceral fat, compared to rats receiving 10% sucrose solution. Marini et al.25 observed that 10% HFCS solution
had a similar effect on the accumulation of adipose tissue to the analogous solution of sucrose; a significant effect of HFCS in this regard was observed at a 20% concentra-tion. Bravo et al.,26 who administered 8%, 18% and 30%
solutions of HFCS and sucrose to people, observed no dif-ference in their effects on body weight, total body fat as well as intramuscular and hepatic fat between 8% and 18% sug-ars solutions. Consumption of 30% solutions of both sugsug-ars increased the body weight but not fat content, and there was no difference between HFCS and sucrose.
Conclusions
In conclusion, the obtained results indicate similar meta-bolic effects of HFCS-55 and sucrose in feed, at the level of 11% dietary energy value, on the energy intake, body weight gain and periorgan adipose tissue accumulation in rats. The results suggest that accusations against HFCS as the major dietary contributor to overweight and obesity are unfounded, and the total elimination of HFCS from the diet seems to be unnecessary. The modified feeds (both sucrose- and HFCS-containing) produced greater, com-pared to the standard feeds, absolute weight gain and weight gain per kilojoule consumed. This may indicate not just
a basic thermodynamic consequence of consuming more energy, but a change in the metabolic efficiency when con-suming a diet with simple sugars and refined carbohydrates.
References
1. Melanson KJ, Angelopoulos TJ, Nguyen V, Zukley L, Lowndes J, Rippe JM. High-fructose corn syrup, energy intake, and appetite regulation.
Am J Clin Nutr. 2008;88(6):1738S–1744S.
2. Bray GA. Soft drink consumption and obesity: It is all about fructose.
Curr Opin Lipidol. 2010;21(1):51–57.
3. Elliott SS, Keim NL, Stern JS, Teff K, Havel PJ. Fructose, weight gain, and the insulin resistance syndrome. Am J Clin Nutr. 2002;76(5):911–922. 4. Tappy L, Lê KA. Metabolic effects of fructose and the worldwide
increase in obesity. Physiol Rev. 2010;90(1):23–46.
5. Tetri LH, Basaranoglu M, Brunt EM, Yerian LM, Neuschwander- -Tetri BA. Severe NAFLD with hepatic necroinflammatory changes in mice fed trans fats and a high-fructose corn syrup equivalent. Am J Physiol Gastrointest Liver Physiol. 2008;295(5):G987–G995. 6. Angelopoulos TJ, Lowndes J, Zukley L, et al. The effect
of high-fruc-tose corn syrup consumption on triglycerides and uric acid. J Nutr. 2009;139(6):1242S–1245S.
7. Bray GA, Nielsen SJ, Popkin BM. Consumption of high-fructose corn syrup in beverages may play a role in the epidemic of obesity. Am J Clin Nutr. 2004;79(4):537–543.
8. White JS. Straight talk about high-fructose corn syrup: What it is and what it ain’t. Am J Clin Nutr. 2008;88(6):1716S–1721S.
9. Melanson KJ, Zukley L, Lowndes J, Nguyen V, Angelopoulos TJ, Rippe JM. Effects of high-fructose corn syrup and sucrose consumption on cir-culating glucose, insulin, leptin, and ghrelin and on appetite in nor-mal-weight women. Nutrition. 2007;23(2):103–112.
10. Stanhope KL, Griffen SC, Bair BR, Swarbrick MM, Keim NL, Havel PJ. Twenty-four-hour endocrine and metabolic profiles following con-sumption of high-fructose corn syrup-, sucrose-, fructose-, and glu-cose-sweetened beverages with meals. Am J Clin Nutr. 2008;87(5): 1194–1203.
11. Heden TD, Liu Y, Kearney ML, Kanaley JA. Weight classification does not influence the short-term endocrine or metabolic effects of high-fructose corn syrup-sweetened beverages. Appl Physiol Nutr Metab. 2014;39(5):544–552. doi:10.1139/apnm-2013-0407
12. American Dietetic Association. Position of the American Dietetic Association: Use of nutritive and nonnutritive sweeteners. J Am Diet Assoc. 2004;104(2):255–275.
13. https://www.ama-assn.org/sites/ama-assn.org/files/corp/media- browser/public/about-ama/councils/Council%20Reports/council-on-science-public-health/a08-csaph-high-fructose-syrup.pdf 14. AOAC 2003. Association of Official Analytical Chemists, Official
Meth-ods of Analysis. 17th ed., Gaithersburg, MD.
15. Matthews DR, Hosker JP, Rudenski AS, Naylor BA, Treacher DF, Turner RC. Homeostasis model assessment: Insulin resistance and beta-cell function from fasting plasma glucose and insulin concen-trations in man. Diabetologia. 1985;28(7):412–419.
16. DiMeglio DP, Mattes RD. Liquid versus solid carbohydrate: Effects on food intake and body weight. Int J Obes Relat Metab Disord. 2000; 24(6):794–800.
17. Monsivais P, Perrigue MM, Drewnowski A. Sugars and satiety: Does the type of sweetener make a difference? Am J Clin Nutr. 2007;86(1): 116–123.
18. Akhavan T, Anderson GH. Effects of glucose-to-fructose ratios in solu-tions on subjective satiety, food intake, and satiety hormones in young men. Am J Clin Nutr. 2007;86(5):1354–1363.
19. Soenen S, Westerterp-Plantenga MS. No differences in satiety or ener-gy intake after high-fructose corn syrup, sucrose, or milk preloads.
Am J Clin Nutr. 2007;86(6):1586–1594.
22. Figlewicz DP, Ioannou G, Bennett Jay J, Kittleson S, Savard C, Roth CL. Effect of moderate intake of sweeteners on metabolic health in the rat. Physiol Behav. 2009;98(5):618–624.
23. Bocarsly ME, Powell ES, Avena NM, Hoebel BG. High-fructose corn syrup causes characteristics of obesity in rats: Increased body weight, body fat and triglyceride levels. Pharmacol Biochem Behav. 2010;97(1): 101–106.
24. Loo DDF, Zeuthen T, Chandy G, Wright EM. Cotransport of water by the Na+/glucose cotransporter. Proc Natl Acad Sci USA. 1996;93(23):
13367–13370.
25. Marini L, Trushenski J, Wendt DL, Strader AD. Acute and long-term metabolic consequences of chronic consumption of dietary sweet-eners. Appetite. 2007;49(1):310.
![Table 1. Component composition of feeds used in the experiment [g/100 g]](https://thumb-us.123doks.com/thumbv2/123dok_us/8763675.1753319/2.595.311.550.521.724/table-component-composition-of-feeds-used-the-experiment.webp)