SIMULATION OF WIND-DIESEL HYBRID POWER SYSTEM FOR A
RURAL COMMUNITY IN NIGERIA
I. E. Major
1,*and B. Oshiemele
21,2,
D
EPARTMENT OFM
ECHANICALE
NGR’
G,
U
NIV.
OFP
ORTH
ARCOURT,
C
HOBA,
R
IVERSS
TATE.
NIGERIA
E-mail addresses:
1[email protected]
2[email protected]
ABSTRACT
This paper presents a Wind-and-Diesel Hybrid power system to be sited at Abonnema, a community located in the suburb of Port Harcourt, Rivers State of Nigeria (latitude 4.71N, longitude 6.79E).This was achieved through five phases of work: a wind resource assessment was undertaken using Weibull probability distribution; an optimal wind turbine blade was designed applying the tip-loss model approach; the hybrid system was sized; Simulation using MATLAB® programme were performed on the hybrid power system; and an economic analysis was conducted on the system adopting the life cycle cost method. The results obtained on the wind data analysis showed that even at a high hub height, the wind speed of Port Harcourt zone is low. The simulation results obtained shows that wind-and-diesel hybrid power system with battery storage can be operated suitably to obtain a more reliable power supply as well as improve fuel savings. Economic analysis conducted shows the positive benefits of implementing the hybrid wind-and-diesel power system rather than continuing with the existing diesel power plant over the project life cycle of 20 years.
Keywords:Wind power, diesel generator, hybrid power, design and simulation of power system.
1. INTRODUCTION
In many countries power networks are widely spread for continuous and high-quality power supply. However, an exception to this is experienced in Nigeria where the absence of stable and adequate electricity supply is not only limited to the rural regions but is also experienced in most urban areas. Thus, individuals who need continuous power supply utilize diesel generators to meet electricity demand either for private or commercial purpose. Over the years it is observed that the fuel price and environmental hazards caused from usage of diesel generator has increased. Hence, application of renewable energy has become popular as an alternative and clean energy. Recently, an alternative energy source such as wind is being used to reduce fuel consumption for power generation. However, the output power generated by renewable power sources always fluctuates depending on the environmental conditions. In order to continuously generate power from renewable energy,
there is need for a backup system such as a battery or diesel generator. Various aspects of the wind-and-diesel hybrid power system have been extensively studied by researchers. Bargiogas, et al [1] studied offshore wind speed and wind power characteristics for ten locations in Aegean and Ionian Seas, Carvalho, et al [2] presented ocean surface wind simulation forced by different reanalyses, while Olayinka and Olaolu [3] carried out an assessment of wind energy potential and the economics of wind power generation in Jos, Plateau State, Nigeria. These studies were focused on understanding the behaviour of wind for power generation and thereafter the energy yield obtainable from wind at wind turbine power stations. Other researchers have focused on methodologies for analysing different hybrid power systems. Seeling-Hochmuth [4] developed an approach for sizing and operation control of a hybrid system comprising of wind, diesel and battery. The goal was to minimize the life cycle cost per kWh and meet the required supply
Nigerian Journal of Technology (NIJOTECH)
Vol. 38, No. 3, July 2019, pp.
636 – 646
Copyright© Faculty of Engineering, University of Nigeria, Nsukka,Print ISSN: 0331-8443, Electronic ISSN: 2467-8821
www.nijotech.com
reliability. Ta z vi ng a a nd Hove [5] formulated a
rule of thumb methodology to size the units of a photovoltaic/diesel/battery hybrid power system. M o r i a r t y [6] designed a software package, AeroDyn which is a set of routines used in conjunction with an aero elastic simulation code to predict the aerodynamics of horizontal axis wind turbines. AeroDyn contains two models for calculating the effect of wind turbine wakes: the blade element momentum theory and the generalized dynamic-wake theory. Ingram [7] also conducted analysis on wind turbine blade using the blade element momentum theory. Andersson and Hansen [8] developed a simulation model for improved battery lifetime for renewable based energy systems for the rural areas.
Research into the use of different hybrid power systems for electricity generation have been given meaningful attention. R e h m a n a n d E l - A m i n [9] presented a study of a solarphotovoltaic/ wind/diesel(pv/wind/diesel) hybrid power station for a remotely located population near Arar, Saudi Arabia, Haidar, et al [10] proposes the use of a pv/wind/diesel generator hybrid system in order to determine the optimal configuration of renewable energy in Malaysia, Chen, et al [11] carried out a strategic selection of suitable projects for hybrid solar-wind power generation systems in China, while Kusakana and Vermaak [12] presented a paper that investigates the possibility of using hybrid Photovoltaic–Wind renewable systems as primary sources of energy to supply mobile telephone Base Transceiver Stations in
the rural regions of the Democratic Republic of Congo. A hybrid system was proposed by Dihrab and Sopian [13] as a renewable resource of power generation for grid connected applications in three cities in Iraq. The proposed system was simulated using MATLAB solver, in which the input parameters for the solver were the meteorological data for the selected locations and the sizes of PV and wind turbines. Results showed that it is possible for Iraq to use the solar and wind energy to generate enough power for some villages in the desert or rural area. Ismail, et al [14] designed a PV/Diesel standalone hybrid system for a remote community in Palestine and found that electrifying the rural small community using this hybrid system was very beneficial and competitive with other types of conventional sources as it decreased both operating costs and pollutant emissions.
2. MATERIALS AND METHODS
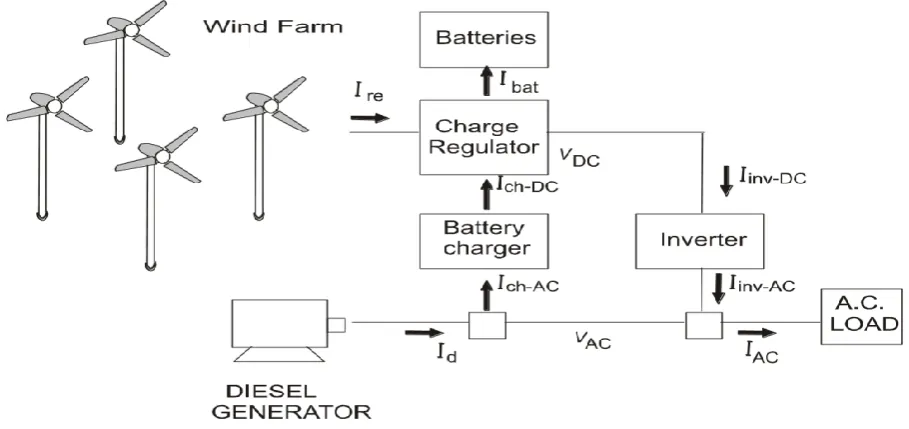
The wind-diesel hybrid power system studied is an AC-only system (no DC-loads) as shown in Figure 1. The wind farm is run by a DC wind turbine generator meant to meet up to the community load demand. A battery bank is meant to store current up to its maximum capacity when an excess of wind power is supplied to the community. The AC- powered battery charger used in this study charges the battery whenever the power from wind is at a surplus. In order to supply DC current to the batteries, the charger has an inbuilt AC/DC inverter.
A charge regulator as shown in Figure 1 acts as a DC
bus that regulates the DC current from the various components, ensuring that all DC currents are balanced. The AC/DC inverter ensures that the DC current output from the charge regulator is converted to AC current required by the community appliances. The diesel generator unit serves as a power supplement unit to the hybrid system. The strategy adopted in this study ensures that the diesel generator operates only when the wind turbine and batteries are unable to meet community load demand.
2.1.The Hybrid System
The following input data are to be estimated on hourly basis: the current from wind turbine generator (IWT), the AC load current (IAC) which depends on predicted load, the current from diesel generator (Id) and the nominal capacity (CN) and state of charge (SOC) of the batteries.
2.1.1. Wind Turbine
The wind data used in this study was obtained from [15]. The wind energy potentiality was assessed using the Weibull wind speed distribution model. The wind profile power law relationship according to Islam, et al [16] is expressed as:
𝑣𝑧 = 𝑣0(
𝑧 𝑧0
)
𝛼
(1) Where vz and vo are the velocities at the hub height z
[m] and reference height zo [m] respectively.
The exponent α is dependent on surface roughness and is given by Manwell, et al [17] as:
𝛼 = 0.096 log10𝑥0+ 0.016 (log10𝑥0)2+ 0.24 (2)
Where xo [m] is the surface roughness. For
calculating the wind speed probability density function f(v), the following expression can be used,
𝑣̅ = 1
𝑁(∑ 𝑣𝑖𝑓𝑖
𝑛
𝑖=1
) (3)
where vi[m/s] andfi are the average wind speeds and
frequencies respectively within each bin, ito n. 𝑣̅[m/s] is the mean wind speed of the wind speed observations and N is the number of wind speed observations. The standard deviation can be calculated from Equation (4)
𝑆. 𝐷. = { 1
𝑁 − 1[∑ 𝑣𝑖
2𝑓 𝑖 𝑛
𝑖
− 𝑁 (1
𝑁∑ 𝑣𝑖𝑓𝑖
𝑛
𝑖
)
2
]}
1 2
(4) The most probable wind speed (𝑣𝑚𝑝) can then be
calculated using equation (5)
𝑣𝑚𝑝= 𝑐 (1 −
1 𝑘)
1 𝑘
(5)
where c is the scale factor and k is the shape factor. The wind turbine power curve was used to determine the wind turbine power output. In this simulation, the mathematical model of the wind turbine is designed to convert hourly wind speed to electrical power using the following equations:
𝑃𝑊𝑇(𝑡) = {
0, 1 2𝐶𝑝𝜌𝐴𝑣
3(𝑡)𝑁 𝑊𝑇
𝑃𝑟𝑎𝑡𝑒𝑑𝜂𝑁𝑊𝑇
𝑣𝑓< 𝑣(𝑡) < 𝑣𝑐
𝑣𝑐 < 𝑣(𝑡) < 𝑣𝑟
𝑣𝑟< 𝑣(𝑡) < 𝑣𝑓
(6)
Where:
ρ = Air density [kg/m3]
A = Swept area of rotor [m2]
η = Mechanical efficiency of wind turbine [%] v(t) = Wind speed [m/s]
vc = Cut-in speed [m/s]
vr = Rated speed [m/s]
vf = Furling speed [m/s]
Prated = Rated power of wind turbine [kW]
NWT = Number of wind turbine
Cp = Blade coefficient of performance
The design of the turbine blade accounts for tip losses around the blade. The first procedure begins with choice of rotor parameters. The statement algorithm according to Manwell, et al [17] is presented below:
Start
Select a Tip speed ratio (TSR) based on the blades application.
Select the number of rotor blades.
Get the radius of the blade used in design. The radius can be obtained from Equations (7) to (9)
𝑇𝑅𝑆 = Ω 𝑉𝑟𝑎𝑡𝑒𝑑
(7) Where: Ω = tip speed velocity and
Vrated = turbine rated velocity
and Ω= 𝜔𝑅 = 2𝜋𝑛𝑅 60⁄ (8𝑏)
Thus R = 60𝜆𝑉𝑟𝑎𝑡𝑒𝑑⁄(2𝜋𝑛) (9)
Where: ω = angular velocity and n = rotational
speed
Stop
The second step considered in determining the blade design is as follows:
Start
Get initial guesses for the axial and angular induction factors (i.e. a and a’ respectively).
Having initial guesses, start the iterative solution procedure for the next iteration.
For the first iteration, calculate and the tip loss factor, F.
𝑡𝑎𝑛𝜑 = 1 − 𝑎 (1 + 𝑎)𝜆𝑟
(10𝑎) and
𝐹 = (2 𝜋) 𝑐𝑜𝑠
−1{𝑒𝑥𝑝 [− ((𝐵 2⁄ )(1 − (𝑟 𝑅⁄ ))
(𝑟 𝑅⁄ )𝑠𝑖𝑛𝜑 )]} (10𝑏)
Determine the lift coefficient Cl and drag
coefficient, Cd
Calculate the local thrust coefficient, CT:
𝐶𝑇=
𝜎(1 − 𝑎)2(𝐶
𝑙cos 𝜑 + 𝐶𝑑sin 𝜑)
𝑠𝑖𝑛2𝜑 (11)
Update a and a’ for the next iteration: If CT < 0.96:
𝑎 = 1
(1 + 4𝐹𝑠𝑖𝑛2𝜑
𝜎𝐶𝑙cos 𝜑)
(12𝑎)
Else: 𝑎 = (1
𝐹) [0.143 + √0.0203 − 0.6427(0.889 − 𝐶𝑇)] (12𝑏)
𝑎′= 1
(4𝐹 cos 𝜑
𝜎𝐶𝑙 − 1)
(13)
The iteration stops when the newest induction factors got are within a set tolerance limit.
The power coefficient is determined using a sum approximating the integral:
𝐶𝑝= (8 𝜆⁄ ) ∫ 𝐹𝑠𝑖𝑛2 2𝜑(cos 𝜑 − 𝜆𝑇sin 𝜑)(sin 𝜑 𝜆
𝜆ℎ
+ 𝜆𝑇cos 𝜑) [1
− (𝐶𝑑⁄ ) cot 𝜑] 𝜆𝐶𝑙 2𝑇𝑑𝜆𝑇 (14)
If the total length of blade is divided into N equal parts, where k is the index of the first blade
𝐶
𝑝= (8 𝜆
⁄ ) ∑
2∫ 𝐹𝑠𝑖𝑛
𝜆𝜆 2𝜑(cos 𝜑 −
ℎ
𝑁 𝑖=𝑘
𝜆
𝑇sin 𝜑)(sin 𝜑 + 𝜆
𝑇cos 𝜑) [1 −
(𝐶
𝑑⁄ ) cot 𝜑] 𝜆
𝐶
𝑙 𝑇2𝑑𝜆
𝑇(15)
Stop
In the hybrid system simulation, the wind turbine output current can be calculated for each power output, PWT (depending on the wind speed) as:
𝐼𝑊𝑇=
𝑃𝑊𝑇
𝑉𝑊𝑇
(16) Where:
VWT = wind turbine output voltage.
2.1.2. Load Model
The power supply from the wind-and-diesel hybrid system is determined by the load demand. The demand increases from 2.8MW to 8.4MW at 10% rate throughout the project life cycle of 20 years. The community load current can be obtained from:
𝐼𝐴𝐶 =
𝑃𝑖,𝑑𝑒𝑚𝑎𝑛𝑑
0.707𝑉𝐴𝐶
(17)
At each time step (1hr), adopting the balance of system current equation of Seeling-Hochmuth [ 4 ] , net load in DC converted to AC can be calculated as:
𝐼𝑁𝐸𝑇(𝐷𝐶)= 𝐼𝐴𝐶 ×
𝑉𝐴𝐶
𝑉𝐷𝐶𝜂𝑖𝑛𝑣
− 𝐼𝑊𝑇 (18)
Where:
VDC and VAC = net DC and AC voltages respectively
IAC, IWT and ηinv = AC load current, wind turbine
current and inverter efficiency respectively.
2.1.3. Battery Storage Model
Power from battery is required whenever the wind turbine is unable to supply the load demand. On the other hand, power is stored whenever the supply from the wind turbines and the diesel generators exceeds the load demand. Two cases are considered in expressing the energy stored in the batteries for hour, t.
Case 1: During the charging process, when INET(DC) ≥ 0
The maximum current that the battery can provide in one-time step, IBAT(max), depends on the SOC.
𝐼𝐵𝐴𝑇(max)(𝑡 +Δ𝑡)
= max {0, min [𝐼𝑚𝑎𝑥𝐶𝐻, (
𝑆𝑂𝐶𝑚𝑎𝑥− 𝑆𝑂𝐶𝑡
Where:
SOCmax = Nbat . CN is the maximum state of charge of
the batteries
Nbat = number of batteries; CN = nominal capacity of
the selected battery, and
Imax = maximum charge current of the battery rated
by the manufacturer.
Thus, the quantity of the charged current, , added to the battery is expressed as:
𝐼𝐵𝐴𝑇(𝐶ℎ𝑎𝑟𝑔𝑒)= min(|𝐼𝑁𝐸𝑇(𝐷𝐶), |𝐼𝐵𝐴𝑇,𝑚𝑎𝑥) (20)
Thus, the present SOC of the batteries depends on the previous SOC and can be expressed as:
𝑆𝑂𝐶(𝑡 + Δ𝑡) = 𝑆𝑂𝐶(𝑡)(1 − 𝛿)
+ (𝐼𝐵𝐴𝑇(𝑡))Δ𝑡𝜂𝑐ℎ(𝐼𝐵𝐴𝑇(𝑡)) (21)
According to Gergaud, et al [18], the global efficiency can be used to calculate the charging efficiency of the battery charger. At each time step𝜂𝑐ℎ is
expressed as:
𝜂𝑐ℎ(𝑡) = 1 − exp [(
20.73
𝐼𝐵𝐴𝑇
𝐼𝑅 + 0.55
) (𝑆𝑂𝐶(𝑡) − 1)] (22)
Where: 𝐼𝑅=
𝐶𝑁
𝑇, T [hrs] = time interval at which CN was
obtained, 𝐼𝐵𝐴𝑇= 𝐼𝑅(1.2765 + 0.013845.Δ𝑇)1.11, and
ΔT = accumulator temperature.
Case 2: During the discharging process, when INET(DC)> 0
The operational strategy selected for this hybrid system ensures that the diesel generator runs at full power, charging the batteries only if the batteries could not meet up to the required load.
𝐼𝐵𝐴𝑇(max)(𝑡 +Δ𝑡)
= max 7 {0, min [𝐼𝑚𝑎𝑥𝐶𝐻, (
𝑆𝑂𝐶 (𝑡) − 𝑆𝑂𝐶𝑚𝑖𝑛
Δ𝑡 )]} (23)
Where:
𝑆𝑂𝐶𝑚𝑖𝑛= 𝑁𝑏𝑎𝑡. 𝐶𝑁. (1 − 𝐷𝑂𝐷𝑚𝑎𝑥) is the minimum SOC
DODmax = maximum depth of discharge (at 80%).
The current that can be supplied to the community at that time is given by:
𝐼𝐵𝐴𝑇(𝐷𝑖𝑠𝑐ℎ)= min(𝐼𝑁𝐸𝑇(𝐷𝐶), 𝐼𝐵𝐴𝑇(max)) (24)
If IBAT(Disch) does not meet the demand, then the diesel
generator supplements the current:
𝐼𝑑= 𝑚𝑎𝑥 [
𝑃𝑁,𝐺𝐸𝑁
𝑉𝐴𝐶
, (𝐼𝐴𝐶+
𝐼𝐵𝐴𝑇(𝐷𝑖𝑠𝑐ℎ)𝑉𝐷𝐶
𝜂𝑉𝐴𝐶
− 𝐼𝑊𝑇
𝜂𝑉𝐷𝐶
𝑉𝐴𝐶
)] (25)
The remaining current from the diesel generator used to charge the batteries is expressed as:
𝐼𝐵𝐴𝑇(𝐶ℎ𝑎𝑟𝑔𝑒)= min [𝐼𝐵𝐴𝑇,𝑚𝑎𝑥(
𝑃𝑁,𝐺𝐸𝑁
𝑉𝐴𝐶
− 𝐼𝐴𝐶
+ 𝐼𝑊𝑇
𝑉𝐷𝐶𝜂𝑖𝑛𝑣
𝑉𝐴𝐶
)𝑉𝐴𝐶𝜂𝑐ℎ 𝑉𝐷𝐶
] (26)
Where:
PN,GEN = diesel generator rated capacity, and ηinv =
inverter efficiency.
For both cases, SOC(t) is the present state of charge of the batteries at t hours and cannot be more than the maximum state of charge (at 100%) or less than the minimum SOC (at 20%) of the batteries. Mathematically, the constraint of the battery’s operation can be expressed as follows:
𝑆𝑂𝐶𝑀𝐼𝑁 ≤ 𝑆𝑂𝐶(𝑡)
≤ 𝑆𝑂𝐶𝑀𝐴𝑋 (27)
2.2. Unit Sizing of Hybrid System
A system modelled without near optimal sized components, will make a particular oversized component more operational. However, a rule of thumb sizing method proposed by Tazvinga and Hove [5] was adopted in this study for sizing the hybrid system units.
2.2.1. Wind Turbine
The developed wind turbine is supposed to meet the peak load demand of the community. The number of wind turbine required can be obtained using the equation:
𝑁𝑊𝑇=
𝑃𝑝𝑒𝑎𝑘
𝑃𝑟𝑎𝑡𝑒𝑑
(28) Where: Ppeak = community peak load demand, and
2.2.2. Diesel Generator
This study assumes that the diesel generator is supposed to run for at most 20 hours in a day (worst case assumption). Equation (29) below was used in sizing the diesel generator:
𝑃𝑅=
𝑃𝑡𝑜𝑡𝑎𝑙(𝑑𝑎𝑖𝑙𝑦)𝜂𝑏𝑎𝑡
𝑇(1 − 𝜂𝑑)(1 − 𝜂𝑎)
(29)
Where:
PR [kW] = diesel generator rated power,
Ptotal(daily)= total daily load obtained from the load
profile used for simulation,
𝜂𝑑 and 𝜂𝑎 = temperature and altitude derating
efficiencies respectively.
2.2.3. Battery
For the battery sizing, plots of cumulative normalized diesel power and load against time (t) were used, which are superimposed to obtain the maximum deficit and maximum surplus power. The sum of the maximum surplus and deficit, Csum can be used to
obtain the minimum battery storage capacity CN as
shown in Equation (30):
𝐶𝑁=
𝐶𝑠𝑢𝑚. 𝑃𝑡𝑜𝑡𝑎𝑙(𝑑𝑎𝑖𝑙𝑦)
%𝐷𝑂𝐷𝜂𝑑𝑖𝑠
(30) Where:
%DOD and ηdis is the battery depth of discharge and
discharge efficiency respectively.
2.3. Economic Model Based on LCC Concept
Economical calculation based on the concept of Life Cycle Cost (LCC) adopted by Seeling-Hochmuth [ 4 ] is utilized in order to find the best benchmark of system cost analysis in this study. LCC can be calculated from the following equations:
𝐿𝐶𝐶
= 𝑇𝑜𝑡𝑎𝑙 𝐼𝑛𝑖𝑡𝑖𝑎𝑙 𝐶𝑜𝑠𝑡𝑐𝑜𝑚𝑝
+ ∑ 𝐷𝑖𝑠𝑐𝑜𝑢𝑛𝑡𝑒𝑑 𝑂𝑝𝑒𝑟𝑎𝑡𝑖𝑜𝑛 𝐶𝑜𝑠𝑡𝑐𝑜𝑚𝑝 (31)
Where:
𝐷𝑖𝑠𝑐𝑜𝑢𝑛𝑡𝑒𝑑 𝑂𝑝𝑒𝑟𝑎𝑡𝑖𝑜𝑛 𝐶𝑜𝑠𝑡𝑐𝑜𝑚𝑝
= ∑ 𝑂𝑝𝑒𝑟𝑎𝑡𝑖𝑜𝑛 𝑐𝑜𝑠𝑡(𝑛)
(1 + 𝑟)𝑛 𝑝𝑟𝑜𝑗𝑒𝑐𝑡 𝑙𝑖𝑓𝑒
𝑛
(32)
The Initial Hybrid System Cost is given by equation (33) as:
𝐼𝑛𝑖𝑡𝑖𝑎𝑙 𝐶𝑜𝑠𝑡 = (∑ 𝐼𝑛𝑖𝑡𝐶𝑜𝑠𝑡
𝑐𝑜𝑚𝑝
)
+ % 𝑜𝑓 (∑ 𝐼𝑛𝑖𝑡𝐶𝑜𝑠𝑡
𝑐𝑜𝑚𝑝
) + 𝐹𝑖𝑥𝑒𝑑𝐶𝑜𝑠𝑡 (33)
For Initial Cost (Component i) = f (Xsize,type,i, Xnumber,type,i).
Equations (34) below, summarizes the different components of operations cost. The Wind turbine operational cost is obtained from equation (34a) as:
𝑂𝑝𝐶𝑜𝑠𝑡𝑊𝑇(𝑛 𝑦𝑒𝑎𝑟𝑠)
= 𝑋𝑤𝑡𝐹𝑖𝑥𝑒𝑑𝐶𝑜𝑠𝑡𝑤𝑡. (1
+ %𝐶𝑎𝑝𝑖𝑡𝑎𝑙 𝐶𝑜𝑠𝑡𝑤𝑡) 𝑅𝑦𝑒𝑎𝑟𝑙𝑦 (34𝑎)
Where:
Xwt = number of wind turbines and
Ryearly = discount factor for a cost incurred every year
for n years and is given by equation (34b):
𝑅𝑦𝑒𝑎𝑟𝑙𝑦 = (
1 + 𝑒𝑠𝑐
𝑟 − 𝑒𝑠𝑐) [1 − ( 1 + 𝑒𝑠𝑐
1 + 𝑟 )
𝑛
] (34𝑏)
Where:
r = discount rate per annum for n years and esc = real escalation factor per annum for n years. The Diesel Generator operational cost is obtained from equation (34c) as:
𝑂𝑝𝐶𝑜𝑠𝑡𝐷𝐺(𝑛 𝑦𝑒𝑎𝑟𝑠)
= 𝐹𝑖𝑥𝑒𝑑𝐶𝑜𝑠𝑡𝐷𝐺(1 + %𝐶𝑎𝑝𝐶𝑜𝑠𝑡𝐷𝐺)
+ 𝐹𝑢𝑒𝑙𝐶𝑜𝑠𝑡𝑦𝑒𝑎𝑟𝑙𝑦𝑅𝑦𝑒𝑎𝑟𝑙𝑦 (34𝑐)
While the operational cost of the batteries is obtained using equation (34d) given as:
𝑂𝑝𝐶𝑜𝑠𝑡𝐵𝐴𝑇(𝑛 𝑦𝑒𝑎𝑟𝑠)
= 𝑋𝑏𝑎𝑡. 𝐹𝑖𝑥𝑒𝑑𝐶𝑜𝑠𝑡𝑏𝑎𝑡. (1
+ %𝐶𝑎𝑝𝑖𝑡𝑎𝑙𝐶𝑜𝑠𝑡𝑏𝑎𝑡)𝑅𝑦𝑒𝑎𝑟𝑙𝑦
+ 𝑅𝑒𝑝𝐶𝑜𝑠𝑡𝑏𝑎𝑡 (34𝑑)
Where:
𝑅𝑒𝑝𝐶𝑜𝑠𝑡𝑏𝑎𝑡 = 𝑖𝑛𝑖𝑡𝑖𝑎𝑙𝐶𝑜𝑠𝑡𝑏𝑎𝑡. [1 (1 + 𝑟)⁄ 𝑁𝑅] and NR =
3. RESULTS AND DISCUSSION
3.1. Wind Resource Assessment
A wind turbine at 70m hub height was used in this study. Table 1 shows the average monthly wind speed obtained at this altitude. Typically, the wind speed data was grouped into classes called bins. This study uses a wind bin width of 0.19 [m/s]. Table 2 shows the wind data arranged in frequency distribution format.
It was observed that the most probable wind speed occurring in Abonnema is 5.3 [m/s] and an annual wind energy density of 802 kWh/yr.
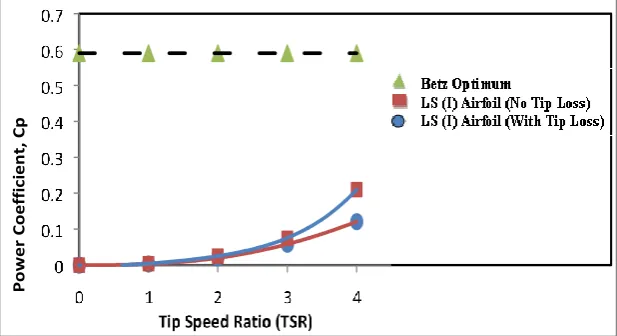
3.2. Optimum Blade Design
Using Equations (7) – (16), the wind turbine blade design was carried out on a three-bladed LS (I) airfoil
with a Tip Speed Ratio of 4. The blade radius was obtained as 34.373 m. Analysis on the blade geometry was carried out, adopting the Beam Element theory (BEM) and Tip loss model which accounts for wake vortex and drag around the blade tip. Figure 2 shows the power coefficient of the LS (I) airfoil under different design considerations. Considering the ideal Betz optimum rotor design, the power coefficient is 0.59. Applying the generalized rotor design procedure without tip losses and drag, the power coefficient is obtained as 0.21, while on accounting for tip losses a Cp of 0.12 was obtained. Thus, the Tip Loss model in blade design consideration is a realistic and safe consideration in designing a practical blade.
Table 1: Averaged monthly Wind speed data for Abonnema at altitude of 70 [m]
Month Jan Feb Mar Apr May Jun July Aug Sept Oct Nov Dec Wind Speed(m/s) 4.17 5.44 7.45 6.06 4.79 4.76 5.05 5.84 5.49 4.09 3.24 4.33
Table 2: Data arranged in probability density distribution format calculated from Weibull function f(vi)
Bin, i Wind Class, v(m/s) Wind Speed, vi(m/s) Frequency, fi fi(vi)
1 0 - 2.29 0 0 0
2 2.60 - 2.79 0 0 0
3 2.80 - 2.99 0 0 0
4 3.00 – 3.19 0 0 0
5 3.20 – 3.39 3.24 1 0.108423
6 3.40 – 3.59 0 0 0
7 3.60 – 3.79 0 0 0
8 3.80 -3.99 0 0 0
9 4.00 – 4.19 4.13 2 0.223934
10 4.20 – 4.39 4.33 1 0.25043
11 4.40 – 4.59 0 0 0
12 4.60 – 4.79 4.775 2 0.298935
13 4.80 – 4.99 0 0 0
14 5.00 – 5.19 5.05 1 0.316205
15 5.20 – 5.39 0 0 0
16 5.40 - 5.59 5.465 2 0.315863
17 5.60 – 5.79 0 0 0
18 5.80 – 5.99 5.84 1 0.285619
19 6.00 – 6.19 6.06 1 0.256275
20 6.20 – 6.39 0 0 0
21 6.40 – 6.59 0 0 0
22 6.60 – 6.79 0 0 0
23 6.80 – 6.99 0 0 0
24 7.00 – 7.19 0 0 0
25 7.20 – 7.39 0 0 0
Figure 2: Power coefficient of LS (I) Airfoil.
3.3. Wind Turbine Power Curve
The power curve of the wind turbine generator was designed and rated as shown in Figure 3based on the most probable wind speed. An efficiency of 0.9 was assumed for the generator.
Figure 3: Power curve of wind turbine generator
The resulting curve obtained for the turbine generator shows that:
• The cut-in velocityVC is 1.5m/s which generates
not more than 2.5kW.
• The rated velocityVr is 5.3m/s at which the wind
turbine generates 40kW of power.
• The cut-out or furling velocity Vf of the wind
turbine is 6m/s. Within (Vr ≤ V(t) ≤ Vf), the wind
turbine is expected to generate the rated power of the wind turbine.
At wind speed aboveVf, the generator is expected to
shut down for safety of the wind turbine.
3.4. Load profile
The hourly distribution of daily load in the community used for the simulation is shown in Figure 4.
In this study, the electricity load demand was
conveniently determined by adopting the energy (Watt-hour) method.
3.5. Hybrid system unit sizing.
In resizing the hybrid diesel generator (DG), the battery inefficiency of 0.85, temperature and altitude derating of 30% and 10% respectively was accounted for. Hence, the rated power of the DG was obtained as 1.63MW for the first year. Accounting for 10% load increment over 20 years, a 4.9MW DG was selected for the hybrid system against the 8.4MW DG for the diesel-only system. The wind turbine is designed to generate a maximum power of 40kW. Thus, to meet up the 8.4MW power demand of Abonnema, a wind farm comprising of 200 wind turbines would be formed. Graphs of cumulative normalized diesel power against time and cumulative load against time was plotted and superimposed to get the maximum deficit and surplus power as shown in Figure 5. From Figure 5, it can be observed that the maximum load surplus of 0.1305 occurred at the 13th hour (1p.m) while the maximum load deficit of 0.05 occurred at the 6th hour (6 a.m). Thus, the minimum storage capacity of the battery for the hybrid system was obtained as 36,875Ah. The battery specification used in this study is shown in Table 4.
3.6. Simulation
In this study, the simulations were executed using MATLAB©. At each time step, the data required by the model are inputted in the programme.
3.6.1. Wind Parameter
The Wind Turbine (WT) specification needed to execute the MATLAB© code is shown in Table 3.
3.6.2. Battery Parameter
The battery parameters needed for the system simulation are shown in Table 4.
Figure 6 shows the result of the battery simulation in the hybrid system. At mid-day periods it was observed that the battery contribution was needed. The 5th hour of the day saved the most energy because the energy supplied from the wind turbine at that time was at a maximum as shown in Figure 6.
Figure 5: Cumulative normalized load and diesel power against time
Table 3: Wind Turbine Parameters Parameter Value Voltage 48V DC
Capital Cost N 60,000,000 (X 200 WT’s) Maintenance Cost N 1,200,000 (X 200 WT’s) Where the maintenance cost is obtained as 2% of the capital cost.
Table 4: Battery parameter
Parameter Value
Nominal voltage 24V DC
Nominal capacity 250Ah at 20hr rate Self-discharge rate/ Battery
inefficiency
4% of capacity per month
Maximum charge current 80A Allowable DOD 80%
Capital cost N 50,000 (X 200)
Replacement cost N 50,000 (X 200) every 5 years
3.6.3. Diesel Generator Parameter
The parameters of the Diesel generator (DG) used in simulation are presented in Table 5.
In comparison to the DG-only system which operates for 24 hrs, the hybrid wind-and-diesel system proves to be fuel saving and also reduces maintenance cost of diesel generator. The fuel consumed (l/hr), at those operational periods of the DG are tabulated in Table 6.
3.6.4. Demand Parameter
The load demanded by the community inputted in the programme is shown in Figure 5.
4. ECONOMIC ANALYSIS
Economic simulation was performed on the Hybrid and the DG-only system using MATLAB©. The simulation was carried out by inputting the cost of each unit of the Wind-and-diesel hybrid system and the data chat for the fuel consumption in the 2.8MW Diesel generator only system, into Equations (31) – (34). Figure 7 shows that the life cycle cost (LCC) of the hybrid system was estimated at N20, 000,000,000. As a result of the battery replacement cost, the curve turned sloppy every 5 years.
Table 5: Diesel generator parameters
Parameter Value
Voltage 220V AC
Rated Power 4.9MW (Hybrid system); 2.8MW X 3 (DG-only) Fuel Curve
characteristics
Intercept (A=0.246); Slope (B=0.08415) Power factor/efficiency 0.9
Capital Cost N 210,000,000 (4.9MW); N 120,000,000 (2.8MW)
Table 6: Fuel consumption per day for the 4.9MW hybrid diesel generator
Hour of the
day Fuel consumption (l/hr)
Cost of Fuel (l/hr) N
7:00 876.25 197,100
12:00 10889.35 2,450,103.75 16:00 10889.35 2,450,103.75
Figure 7: Comparison of LCC of wind-and-diesel Hybrid system to diesel generator only.
Also, the LCC for the DG-only system was estimated as N22, 000,000,000. This increment in LCC was due to the operational cost of running the DG-only power system. Figure 7, it is observed that the profitability of the wind-and-diesel hybrid system was not constant at the 9th year due to replacement cost. It became stabilized from the 11th year.
5. CONCLUSION
The sizing and simulation of a wind-diesel hybrid power system for Abonnema, Nigeria has been presented in this paper. Based on the results of this study, the following conclusions are made: The average wind velocity for Abonnema at 70m height was determined and obtained as 5.3m/s. The LS (I) airfoil used for the wind turbine blade was optimally designed with a Cp of 0.12122 which was used to obtain the power curve of the wind turbine generator. The MATLAB© simulation results shows that wind-and-diesel hybrid system offered a more reliable power system with a minimal rate of fuel consumption as compared to the DG-only systems. Economic analysis conducted shows that N2,000,000,000 would be saved if the wind-and-diesel hybrid system project is implemented as compared to the existing diesel plant.
The following recommendations are suggested for further work in this field: A cost analysis to account for the emissions. An ecological impact analysis of the wind turbine should be performed. A study of how the waste energy from the wind turbine at high wind speeds can be channelled and used as a source of energy for other systems is highly recommended. More LS (I) airfoils should be used to compare the performance of the blade.
LCC (Hybrid)
6. REFERENCES
[1] Bagiorgas, H. S., Mihalakakou, G., Rehman, S. and Al-Hadhrami, L. M. “Offshore wind speed and wind power characteristics for ten locations in Aegean and Ionian Seas”. Journal of Earth System Science, Vol. 121, Number 4, 2012, pp 975-987.
[2] Carvalho, D., Rocha, A., Gómez-Gesteira, M. “Ocean surface wind simulation forced by different reanalyses: Comparison with observed data along the Iberian Peninsula coast”. Ocean Modelling, Vol. 56, 2012, pp 31 -42.
[3] Olayinka, S. and Olaolu, O. “Assessment of Wind Energy Potential and the Economics of Wind Power Generation in Jos, Plateau State, Nigeria”. Energy for Sustainable Development, Vol. 16, 2012, pp 78-83.
[4] Seeling-Hochmuth, G. C. Optimization of hybrid energy systems sizing and operation control. PhD Dissertation, Department of Mechanical Engineering, University of Kassel, South Africa, 1998.
[5] Tazvinga, H. and Hove, T. (2010). “Technical model for optimising PV/diesel/battery hybrid power systems”. Science Real and Relevant, CSIR 3rd Biennial Conference, Pretoria, South Africa, 2010.
[6] Moriarty, J. P. “AeroDyn Theory Manual”. National Renewable Energy Laboratory Technical Report. NREL/EL-500-36881, 2005.
[7] Ingram, G. Wind turbine blade analysis using blade element momentum method. In Note on the BEM method; School of Engineering, Durham University: Durham, NC, USA, 2005.
[8] Andersson, A. and Hansen A. C. “Battery Lifetime Modelling”. Riso National Laboratory Report, No. R-2440, 2006.
[9] Rehman, S. and El-Amin, I. “Study of a solar pv/wind/diesel hybrid power system for a remotely located population near Arar, Saudi Arabia”. Energy Exploration and Exploitation, Vol. 33, Number 4, 2015, pp 591-620.
[10] Haidar, A. M. A., John, P. N. and Shawal, M. “Optimal configuration assessment of renewable energy in Malaysia”. Renewable Energy, Vol. 36, Number 2, 2010, pp 881-888.
[11] Chen, H. H., Kang, H. Y. and Lee, A. H. I. “Strategic selection of suitable projects for hybrid solar wind power generation systems”. Renewable and Sustainable Energy Reviews, Vol. 14, 2010, pp 413-421.
[12] Kusakana, K. and Vermaak H. J. “Hybrid renewable power systems for mobile telephony base stations in developing countries”. Renewable Energy, Vol. 51, 2013, pp 419-425.
[13] Dihrab, S. S. and Sopian, K. “Electricity generation of hybrid PV/wind systems in Iraq”. Renewable Energy, Vol. 35, 2010, pp 303-1307.
[14] Ismail, M. S., Moghavvemi, M. and Mahlia, T. M. I. “Design of a PV/Diesel standalone hybrid system for a remote community in Palestine”. Journal of Asian Scientific Research, Vol. 2, Number 11, 2012, pp 599-606.
[15] Oko, C. O. C. and Ogoloma, O. B. “Generation of a typical metrological year for Port Harcourt Zone”. Journal of Engineering Science and Technology, Vol. 6, Number 2, 2011, pp 204-211.
[16] Islam, M. R., Saidur, R. and Rahim, A. “Assessment of wind energy potentiality at Kudat, Labuan and Malaysia using Weibull distribution function”. Energy, Vol. 6, Number 2, 2011, pp 985-992.
[17] Manwell, J. F., McGowan, J. G. and Rogers, A. L. Wind Energy Explained: theory, design and application, 2nd Edition. Chichester: John Wiley and Sons, Inc, 2010.
![Table 1: Averaged monthly Wind speed data for Abonnema at altitude of 70 [m]](https://thumb-us.123doks.com/thumbv2/123dok_us/9987257.1986921/7.595.52.539.396.780/table-averaged-monthly-wind-speed-data-abonnema-altitude.webp)