Can We Boost the Competitiveness of the European Union through Reducing
Regional Inequalities in Human Capital?
Lela Tijanic
1, Alka Obadic
21
Juraj Dobrila University of Pula P. Preradovica 1/1, 52 100 Pula, Croatia E-mail. letijan@unipu.hr
2 University of Zagreb
J. F. Kennedy Square 6, 10 000 Zagreb, Croatia E-mail. aobadic@efzg.hr
http://dx.doi.org/10.5755/j01.ee.26.3.8029
The trade-offs involved in boosting the competitiveness of EU member states, while reducing within-country regional inequalities, constitute an important, but underinvestigated relation in competitiveness and regional policy analyses. The article studies the influence of regional inequalities in human capital on the competitiveness of the EU member states, drawing on a panel dataset of 22 EU countries and 266 NUTS 2 regions, over the period 2000-2011. The analysis is extended with the variables that can have a significant influence on the observed relationship, including the EU’s Structural and Cohesion Funds, and differences in the levels of development between EU member states and regions. Applying different panel data estimators, it is determined that higher regional inequalities in human capital reduce the competitiveness of the EU member states. The EU’s Structural and Cohesion Fund payments have a positive influence on competitiveness in the long run. The EU’s new member states, as well as the EU countries in which most of the regions are classified as less developed regions, have lower competitiveness. The conclusions imply that the absorption of the EU’s Structural and Cohesion Funds in less developed regions does not contribute sufficiently to the strengthening of national competitiveness. The results also confirm the need to integrate a more place-based approach into the EU’s regional, and even national, competitiveness policies. With its approach in analysing the influence of regional inequalities in human capital, this article adds empirically to the existing studies about the ambiguous relation between regional inequalities and competitiveness. The conclusions can be used in the future EU regional policy planning that places special emphasis on measures, which are directed towards developing human capital potential.
Keywords: regional inequality; human capital; competitiveness; EU funds, EU.
Introduction
The process of enlargement of the European Union (EU) is likely to cause transformations inside the European socio-economical structure, at both the international and intra-national levels (De Dominicis, 2014, 127; Mencinger & Aristovnik, 2013). Bogumil (2009, 1) confirms that, although income levels have been growing steadily in the new member states, within-country regional disparities at the second level of the Nomenclature of Territorial Units for Statistics (NUTS 2) have increased. Huge economic, social and territorial disparities can have a negative impact on balanced development across the Union and can weaken its competitiveness (Stanickova & Skokan, 2012). The EU must consider the determinants that might cause such disparities. The role of human capital in contributing to regional differences in development has been determined in numerous papers (Mora, 2008; Hippe & Baten, 2011; Gennaioli et al., 2012).
The Treaty establishing the European Community sets economic and social cohesion as one of the main priorities of the Union, and it has been operationalised by EU cohesion policy (Monford, 2009, 3). Cohesion policy, as an investment policy, has a significant role in reducing disparities. At the same time, the cohesion policy supports
competitiveness, which, today, is in line with Europe 2020, the European growth strategy. According to the European Commission-Regional Policy-Inforegio (2014a), funding for the EU cohesion policy in 2014-2020 amounts to €351,t. It works through financial instruments, of which the most important are the Structural Funds, i.e., the European Regional Development Fund, the European Social Fund, and the Cohesion Fund. The member states and the managing authorities can use these instruments to meet the specific needs of regions or countries. For many countries, tackling disparities and strengthening competitiveness are very often presented as development priorities. The causal relationship between cohesion (the reduction of regional inequalities) and competitiveness has not yet been unambiguously determined; consequently, it cannot be adequately considered in the planning of cohesion and competitiveness policies.
have GDP per capita between 75 % and 90 % of the EU average. Also, there are more developed regions having GDP per capita above 90 % of the EU average (European Commission-Regional Policy-Inforegio, 2014a).
Inequalities, both between regions and between the EU member states, are very often increasing, despite a strong and financially abundant policy of regional development and cohesion. Human capital is a factor which has an inevitable role in the successful absorption of the EU funds and which can boost competitiveness. Conversely, regional inequalities in human capital can be reduced by an adequate absorption of the EU funds. Human capital has been confirmed to be an important determinant of competitiveness. However, it is unevenly distributed among the EU member states or regions, which may be harmful to competitiveness. The influence of regional inequalities in human capital can have a significant positive or negative impact on national competitiveness, which motivates detailed study. It can be assumed that this influence depends on the successful absorption of the EU funds and on the differences in the development of EU member states and regions.
The scientific problem addressed in this paper is the
ambiguous relation between the competitiveness of the EU member states and regional inequalities, with a special emphasis on inequalities in human capital. Thus, the following main research questions arise: Is it possible to boost the competitiveness of the EU member states and to reduce regional inequalities in human capital? Are these two goals complementary? The main aim of this study is to analyse the influence of the regional inequalities in human capital on the competitiveness of the EU member states. We will also consider other factors that can have a significant influence on these inequalities and on competitiveness, or on their relationship, i.e. the EU’s Structural and Cohesion Funds and the differences in the development of member states and regions. The results obtained in this study can be of importance for investigators and policy actors who consider competitiveness and cohesion, and who observe the role of inequalities in human capital in strengthening the competitiveness of the EU member states.
The methods used in the theoretical background of this
paper include the analysis and comparison of various scientific papers addressing competitiveness and regional inequalities, as well as their relationship. Static and dynamic panel data analyses (precisely, random effects, a feasible generalised square estimator and a two-step system generalized method of moments (GMM) estimator) are used in the empirical portion of the paper. A final critical examination of the results can be seen in the last section.
This paper contributes in several ways to the literature addressing the trade-offs involved in within-country regional disparities and national competitiveness. These include the application of a unique methodological approach in analysing the (underinvestigated) influence of regional inequalities in human capital on the competitiveness of the EU member states. The database for the research covers the EU member states, including Croatia. To the best of the authors’ knowledge, this is the first time that the dispersion of human capital intensity has been calculated on the NUTS 2 level. We apply different
panel data estimators in this kind of analysis. Moreover, we provide conclusions and recommendations for strategic directions based on the analysis.
The following section presents the theoretical background for performing the analysis, and it has been synthesised through a literature review. In the empirical part of the paper, the described relationship between the competitiveness of the EU member countries and the regional inequalities of the within-countries will be estimated and critically evaluated using panel data models. The final section concludes and presents the implications for future studies.
Theoretical Background - Literature Review
The EU faces a double challenge: increasing global competitiveness and avoiding the risks and costs of widening disparities (Petrakos, 2009, 40). It is also important to analyse the relation between these challenges. (Brante, 2012) emphasises that the relationship between competitiveness and inequalities has been subject to little study in the EU, confirming the need for detailed investigations to define, measure and evaluate the interconnectedness of these two concepts.
A definition of competitiveness is never right or wrong; rather, it is simply more or less appropriate to address a particular issue (Ketels, 2013, 271). Hereinafter, we elaborate on investigations that observe the aspects that are more “appropriate” to form the background of our study. There are many works on competitiveness, starting with (Porter, 1990) and criticised by (Krugman, 1994), relating to macro or micro level competitiveness (Bruneckiene et al., 2012). A diversity of thoughts on competitiveness is provided by the Institute for Management Development (IMD) (2014). One of its notions is that competitiveness describes how a nation manages the totality of its resources and competencies to increase the prosperity of its people (IMD, 2014, 498). A new framing of competitiveness explains the role of regions (Ketels, 2013, 269). Competitiveness has a strong regional dimension; this is important because many of the factors affecting competitiveness are influenced by regional and local authorities (European Commission-Directorate-General for Regional and Urban Policy, 2014, 50).
Depending on the subject and the aim of the analysis, a variety of indicators, models and methods of measuring competitiveness can be used. The issue of the measurement of competitiveness is also important, because public authorities and international institutions tend to follow “evidence-based policies”, i.e., policies that are guided by indicators and benchmarks, which are usually in the form of hard statistical data (Alquezar et al., 2010, 236).
the potential for increased economic growth vis-a-vis other countries (Alquezar Sabadie & Johansen, 2010, 237). This is also the approach we used in our investigation. (Stanickova & Skokan, 2012) explain that the evaluation of competitiveness in terms of the differences between countries and regions should be measured using complex criteria that can identify the areas causing major disparities. In this study, we use the IMD index as a complex measure of competitiveness, which considers the interaction of different factors.
Furthermore, competitiveness in the EU can be measured by indicators of the EU’s growth strategies or by macro-econometric modelling, e.g. by (regional) econometric panel data models (Kristjansdottir, 2008). Data envelopment analysis can be used to measure national or regional efficiency and national-regional competitive potential (Stanickova & Skokan, 2012).
As was emphasised above, regional inequalities can have a significant influence on national competitiveness, but investigations regarding their relationship are still scarce. The main theoretical debate on regional inequalities has been between the convergence and divergence schools (for a more detailed discussion, see (Simanaviciene et al., 2014). (Vrtenova et al., 2009) determine that efforts concerning the reduction of economic disparities among regions can threaten competitiveness. Regional disparities can also be an impulsive force for competitiveness (Vrtenova et al., 2009, 299). (Galbraith & Garcilazo, 2010) test whether a trade-off exists between cohesion and competitiveness, and they find no evidence of such a trade-off. Furthermore, if we want to investigate the influence of regional inequalities on competitiveness in more detail, it is important to provide an overview of the possible determinants of regional inequalities. (Barrios & Strobl, 2009) analyse the dynamics of regional inequalities in GDP per capita using regional data for a panel of European countries. (Seguino, 2005) explains that certain inequalities, such as those in education, can have an influence on growth that is different from that of inequalities in income. In (OECD, 2012), education is recognised as one of the factors that can reduce income inequality. (Gennaioli et al., 2012) present evidence of the paramount importance of human capital in accounting for regional differences in development.
According to a study conducted by (Szorfi, 2007), the date of EU accession has a significant influence on disparities (greater than national income). In addition, Szorfi found that several other factors have an effect on disparities: the economic transition process in the new member states, the Economic and Monetary Union, the funds made available by the EU Structural and Cohesion Funds, and effective institutions. (Bogumil, 2009) elaborates that one of the standard mechanisms for the equalisation of regional income and labour market disparities in Europe is EU fund inflows. (Petrakos, 2009) notes that the impact of the EU Structural Funds is one of the reasons why the levels of inequalities decreased in the EU-27 and the benefits of the reduction in inequalities have not been spread equally among the regions in converging Eastern or Southern countries. In most of them, especially in the new member states, convergence has been achieved because of the superior performance of
metropolitan areas, which have driven up national averages (Petrakos, 2009, 28).
In this study, our interest is directed towards the influence of regional inequalities in human capital on the competitiveness of the EU member states. We consider this in light of the elaborations discussed above. Moreover, we recognise the fact that the variation in human capital between regions within EU member states is often larger than that between member states (European Commission, 2011, 7). Further, it is important to consider that the distribution of human capital has not received much attention until very recently (Lim & Tang, 2008, 26). This is due, in part, to the scarcity of available data regarding inequalities in human capital (Castello-Climent & Domenech, 2002). Additional discussion of the measurement of inequalities in educational and human capital can be found in (De Gregorio & Lee, 2002; Castello-Climent & Domenech, 2014). Remarks about the measurement of human capital are provided in (Van Leeuwen & Foldvari, 2008; Obadic et al., 2014; Aristovnik, 2014a, 2014b).
(Taylor, 2000) analyses the importance of a region’s human capital in determining its competitiveness. He highlights that the existence of a (two-way) interaction between human capital and competitiveness implies the need for policies designed to improve educational attainment and skill levels in less developed regions. (Alquezar et al., 2010) observe the measurement of the components of human capital in the dominant competitiveness indices and highlight the degree to which education and training contribute to national economic competitiveness. The authors argue that education and training remain cornerstones of national economic competitiveness, despite being marginalised as independent variables in the dominant models of competitiveness. Data availability constrains the use of more complex measures of EU regional human capital inequalities; however, being mindful that education is one of the determinants which are central to the strategy set forth in Europe 2020, we have decided to use educational data to measure human capital inequalities in our investigation. (Golejewska, 2012) compares competitiveness and the intensity of human capital in the Visegrad Group regions (i.e. the Polish, Czech, Hungarian and Slovak regions) using educational data as proxy estimates of human capital. She determines the differences among the regions regarding competitiveness and human capital. Further, she defines a positive link between education and regional competitiveness. She also implies that further econometrical research is needed.
Regional inequalities in GDP per capita will be included in our empirical analysis because the differences in the levels of development of the observed regions can have an influence on competitiveness and because EU fund allocations also depend on the level of development, as was mentioned above.
similar development profiles or the differences between new and old EU member states.
Before we perform our empirical analysis, it can be concluded, based on the previous studies, that there has been no unified conclusion about the influence of regional inequalities on the competitiveness of the EU member states. It can be expected that higher regional inequalities (in GDP per capita or human capital) will lower competitiveness; however, on the other hand, it is possible that the agglomeration effect and the concentration of human capital in some regions will strengthen regional inequalities, and at the same time, boost competitiveness at the national level. Structural and Cohesion Fund payments can reduce regional inequalities and have a positive influence on competitiveness. However, if their absorption in some regions is low (especially in less developed regions), the Structural and Cohesion Fund payments will not have a statistically significant and/or positive influence on competitiveness. This can be the case despite the fact that EU member states having a higher number of less developed regions have access to more funds.
Given the scarcity of empirical analyses that deal with the ambiguous influence of regional inequalities in human capital on the competitiveness of the EU member states, and taking into account the significant differences in the development of the observed countries and the impact of EU funds, we present our empirical analysis in the next section.
Methodology and Data
The empirical analysis in this article starts with observations regarding the inequalities in human capital within European countries and among the EU NUTS 2 regions. According to (Lessmann, 2013), the territorial level to be applied is one of the difficulties in the measurement of regional inequalities. There are several reasons why the NUTS 2 level was chosen for our analysis. Before observing the availability of data, in measuring regional inequalities, it is necessary to use a territorial classification that creates homogeneous regions (Lessmann, 2013, 132; Obadic, 2006). This is important for economic analyses, as well as for regional policy implementations, such as those within the NUTS 2 regions. (Stanickova & Skokan, 2012, 351) confirm that to evaluate regional competitiveness in terms of the EU, the most appropriate territorial unit is the NUTS 2 level. It is the centre of interest for the European Commission in fulfilling the objectives of the EU’s cohesion policy.
In our study, the indicators of regional inequalities are calculated using the sample of the 266 NUTS 2 regions for 22 out of the 28 EU member countries. This is because (similar to Szorfi, 2007) the other 6 EU countries themselves are classified as NUTS 2 regions, so no regional differences can be observed. The analysis is performed for the period 2000–2011 (due to data availability), using panel data analysis. It takes into consideration that the sample has a cross-sectional and time series dimension.
In this paper, as a suitable measure of regional inequalities, a derived indicator of dispersion (“D”) is used, based on (European Commission-Eurostat, 2012). It records differences across the regions of the same country
that are between the regional values (in our case, the NUTS 2 regions) and the national average, and it enables them to be comparable between countries. In European Commission-Eurostat (2012, 29), it is explained that, for a given country, the dispersion “D” of regional GDP for the NUTS level 2 regions is defined as the sum of the absolute differences between the regional and national GDP per inhabitant, weighted according to the regional share of population and expressed as a percentage of the national GDP per inhabitant:
p P
Y y Y
D i
n
i
i ) /
( ) / 1 ( 100
1
, (1)
where yi is the regional GDP per inhabitant of region i,
Y is the national average per inhabitant for GDP per inhabitant, pi is the population of region i, P is the national population, and n is the number of regions in the country.
We have applied the relation given by (1) to calculate regional inequalities in human capital, which, in our study, is expressed with an indicator named dispersion of human capital intensity. First, we calculated the Human Capital Intensity Index based on (Dijkstra, 2009) (explained in more detail in Table 1) for the 266 NUTS 2 regions. Next, the dispersion of human capital intensity was compiled using relation (1), where the values of human capital intensity were used, instead of GDP per capita.
The relationship between human capital inequalities and competitiveness in a panel data framework can be expressed by a basic (static) panel regression model with the unobserved effect of the general form, which is defined according to (Szofi, 2007) as:
yit = ßxit + αi + εit , (2)
where the subscript i = 1,…, 22 in our analysis denotes the country and t indicates the time index of our sample, for the period of 2000–2011. αi (also called the heterogeneity effect) contains observable or unobservable country specific, time-invariant factors. εit represents the idiosyncratic error, i.e. unobserved factors that change over time and affect the dependent variable yit (Szofi, 2007, 109). “Random effect” is synonymous with zero correlation between the observed explanatory variables and the unobserved effects (Wooldridge, 2002, 252). Regarding static panel data models, we have decided to use panel data analysis with random effects (RE) in our estimation, based on the results of the Hausman test (Hausman, 1978) and the Breusch Pagan Lagrangian multiplier test for random effects (Breusch & Pagan, 1980), which will be presented in the next section. The feasible generalised least square (FGLS) model, allowing for group-wise heteroscedasticity and panel specific error autocorrelation, is also estimated because of the autocorrelation and heteroscedasticity problems. The FGLS estimator is explained in more detail in (Beck & Katz, 1995).
Introducing variables of interest for dependent and independent variables, equation (2) can be extended and modified as:
COMPit = ß0 + ß1INHCit+ γ
ij it
it
D SF INGDP
i = 1,…, 22 represents the country, t indicates the time index of our sample, while j = 1, 2 represents different dummy variables. A summary of the variables and their data sources, which are used in the analysis, is presented
hereinafter in Table 1. The justification for choosing these variables can be found in the theoretical elaborations provided in the previous sections, although data availability is also considered.
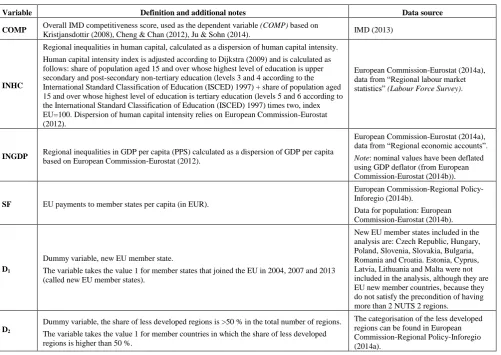
Table 1
Variables and data sources
Variable Definition and additional notes Data source COMP Overall IMD competitiveness score, used as the dependent variable (COMP) based on
Kristjansdottir (2008), Cheng & Chan (2012), Ju & Sohn (2014). IMD (2013)
INHC
Regional inequalities in human capital, calculated as a dispersion of human capital intensity. Human capital intensity index is adjusted according to Dijkstra (2009) and is calculated as follows: share of population aged 15 and over whose highest level of education is upper secondary and post-secondary non-tertiary education (levels 3 and 4 according to the International Standard Classification of Education (ISCED) 1997) + share of population aged 15 and over whose highest level of education is tertiary education (levels 5 and 6 according to the International Standard Classification of Education (ISCED) 1997) times two, index EU=100. Dispersion of human capital intensity relies on European Commission-Eurostat (2012).
European Commission-Eurostat (2014a), data from “Regional labour market statistics” (Labour Force Survey).
INGDP Regional inequalities in GDP per capita (PPS) calculated as a dispersion of GDP per capita based on European Commission-Eurostat (2012).
European Commission-Eurostat (2014a), data from “Regional economic accounts”.
Note: nominal values have been deflated using GDP deflator (from European Commission-Eurostat (2014b)).
SF EU payments to member states per capita (in EUR).
European Commission-Regional Policy-Inforegio (2014b).
Data for population: European Commission-Eurostat (2014b).
D1
Dummy variable, new EU member state.
The variable takes the value 1 for member states that joined the EU in 2004, 2007 and 2013 (called new EU member states).
New EU member states included in the analysis are: Czech Republic, Hungary, Poland, Slovenia, Slovakia, Bulgaria, Romania and Croatia. Estonia, Cyprus, Latvia, Lithuania and Malta were not included in the analysis, although they are EU new member countries, because they do not satisfy the precondition of having more than 2 NUTS 2 regions.
D2
Dummy variable, the share of less developed regions is >50 % in the total number of regions. The variable takes the value 1 for member countries in which the share of less developed regions is higher than 50 %.
The categorisation of the less developed regions can be found in European Commission-Regional Policy-Inforegio (2014a).
The WEF’s Global Competitiveness Index places more emphasis on survey data in comparison with the IMD’s World Competitiveness Yearbook, which focuses more on hard statistics (Annoni & Kozovska, 2010, 14). Most of the independent variables of interest in this analysis rely on hard quantitative data characteristics, so we have chosen to use the index scores, instead of other well-known competitiveness indices from the WEF.
As can be seen above, the relationship between regional inequalities in human capital (INHC) and the competitiveness of the EU member states was controlled for regional inequalities in GDP per capita (INGDP) and Structural and Cohesion Fund payments per capita (SF). The EU’s payments to member states were used as a more reliable indicator than decided amounts or commitments. As (Mohl & Hagen, 2010) elaborate, estimation results might be biased due to the use of imprecise data regarding Structural Fund commitments instead of actual payments; this is because the commitments may not be entirely complete or may be called up with a delay because of missing absorption capacity.
In our paper, in modelling, we also introduced a dummy variable that signifies the differences between new and old member states (D1). Subsequently, we introduced dummy variable (D2), which refers to differences between member states in which the number of less developed regions is higher than 50 % of the total number of regions and the rest of the EU member countries, in which most of the regions are categorised as transition and/or more developed regions (according to the classification of the European Commission-Regional Policy-Inforegio, 2014a). Dummies were introduced because of EU heterogeneity, with the aim of estimating the differences between these countries regarding the different development and competitiveness levels of new and old member states.
the short term, Structural Fund projects usually become effective after some time lag, and cohesion policy has long-term effects.
Baltagi (2005, 135) presents the dynamic relationships with the presence of a lagged dependent variable among the repressors as:
yit= δyi,t-1 + x’it ß + uit i = 1, …, N; t = 1,…, T, (4) where δ is a scalar, x’it is 1
K and ß is K
1. He assumes that the uit follow a one-way error component model uit = µi + νit where µi ~ IID (0, ζ2
μ) and νit ~ IID (0,
ζ2
ν) are independent of each other and among themselves.
Introducing the variables from Table 1, equation (4) can be written as:
COMPit = ß0 + ß1COMPit-1 + ß2INHCit + ß3INGDPit +
ß4SFit + ß5Dij +
2011
2000 t
t
year + µi + νit, (5) As can be seen in equation (5), the dynamic model also includes time dummies (to control for the impact of possible time effects, as is emphasized in Sarafidis et al.
(2009)); however, the variables were not significant in our models, so they were excluded from the final presentation of the results in Table 2.
Several econometric issues should be addressed in this dynamic analysis: the omitted variable bias, which can result from the potential correlation between unobserved characteristics and the dependent variable (competitiveness), the correlation between additional explanatory variables and the error term, and reverse causality between the dependent variable and regional inequalities in human capital. The latter factor is considered because it is possible that competitiveness will also have a significant influence on regional inequalities in human capital because more competitive regions are able to attract a labour force that is highly skilled. This can result in strengthening regional disparities. Thus, we must deal with endogenous or predetermined variables. Niebuhr et al. (2012) explain that the lagged dependent variable on the model’s right-hand
side will alleviate potential problems from unobserved heterogeneity. They use GMM estimators to deal with the predetermined or endogenous explanatory variables in dynamic panel models.
We decided to solve the aforementioned problems in our analysis by applying a two-step system dynamic GMM estimator (Arellano & Bover, 1995; Blundell & Bond, 1998). The standard errors are adjusted following (Windmeijer, 2005). A detailed explanation of the estimator can be found in (Roodman, 2009). (Roodman, 2009) explains that it is possible to include time-invariant regressors in system GMM and presents other advantages of the estimator. Model diagnostics is also addressed (a test of the validity of instruments, the number of instruments, autocorrelation tests, etc. explained in (Sargan, 1958; Blundell & Bond, 1998; Roodman, 2009) and is presented, along with the results of the analysis and the discussion, in the next section.
Results and Discussion
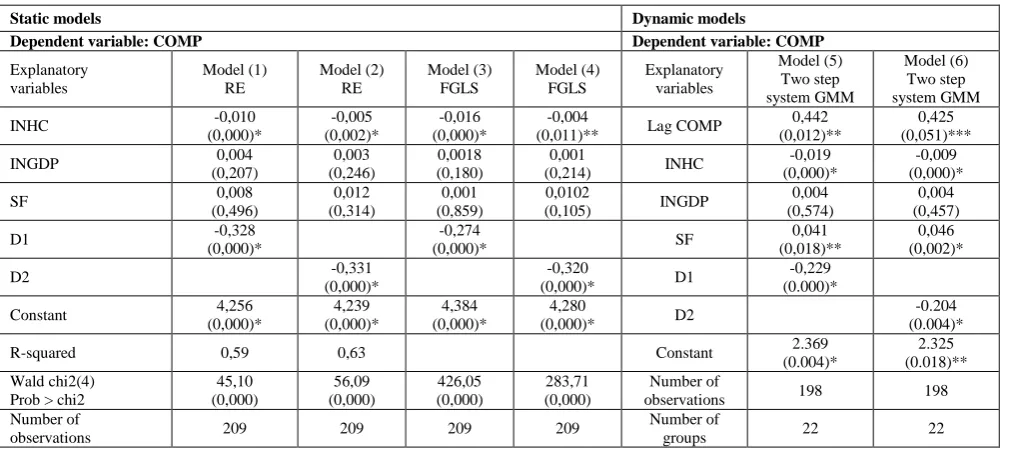
Panel data analysis (static and dynamic) is performed to estimate the influence of regional inequalities in human capital on the competitiveness of the EU member states. The results of the static models (based on equation (3)) and the results of the dynamic panel data models (based on equation (5)) are presented in Table 2.
The results of the Hausman tests (Hausman, 1978), which are presented in columns (1) and (2) of Table 2, imply that it is appropriate to use random effects over fixed effects. In addition, the results of the Breusch Pagan Lagrange multiplier tests for random effects (Breusch & Pagan, 1980) confirm that random effects models can be used over pooled regressions. Postestimation tests show the presence of heteroscedasticity (the results of the modified Wald test, according to Greene, 2000), autocorrelation (Wooldridge, 2002) and the absence of cross sectional dependence (Pesaran, 2004; Friedman, 1937), so the standard errors are cluster robust.
Table 2
Estimation results: RE, FGLS models and two-step system dynamic GMM estimation
Static models Dynamic models
Dependent variable: COMP Dependent variable: COMP Explanatory variables Model (1) RE Model (2) RE Model (3) FGLS Model (4) FGLS Explanatory variables Model (5) Two step system GMM Model (6) Two step system GMM INHC -0,010
(0,000)* -0,005 (0,002)* -0,016 (0,000)* -0,004
(0,011)** Lag COMP
0,442 (0,012)**
0,425 (0,051)*** INGDP 0,004
(0,207) 0,003 (0,246) 0,0018 (0,180) 0,001
(0,214) INHC
-0,019 (0,000)*
-0,009 (0,000)* SF 0,008
(0,496) 0,012 (0,314) 0,001 (0,859) 0,0102
(0,105) INGDP
0,004 (0,574)
0,004 (0,457) D1 -0,328
(0,000)*
-0,274
(0,000)* SF
0,041 (0,018)**
0,046 (0,002)*
D2 -0,331
(0,000)*
-0,320
(0,000)* D1
-0,229 (0.000)* Constant 4,256
(0,000)* 4,239 (0,000)* 4,384 (0,000)* 4,280
(0,000)* D2
-0.204 (0.004)* R-squared 0,59 0,63 Constant 2.369
(0.004)*
2.325 (0.018)** Wald chi2(4)
Prob > chi2
45,10 (0,000) 56,09 (0,000) 426,05 (0,000) 283,71 (0,000) Number of
observations 198 198 Number of
observations 209 209 209 209
Number of
Dependent variable: COMP Dependent variable: COMP Hausman test
Chi2(3) Prob > chi2
6,19 (0,1026)
1,33 (0,7214)
Number of
instruments 15 15
Breusch and Pagan LM test for random effects Chi2(1)
Prob > chi2 351,85 (0,000)
419,24 (0,000)
m1 (p-value) 0,009 0,006
Modified Wald Test Chi2(22)
Prob > chi2 254,22 (0,000)
254,22 (0,000)
m2 (p-value) 0,624 0,698
Wooldridge test Prob > F
F (1, 21) = 4,203 0,053
F (1, 21) = 4,203 0,053
Sargan/Hansen J statistics Prob>chi2
13,62 0,136
14,94 0,093 Pesaran’s test of cross
sectional independence 12,607 0,434 13006 0,438
Wald test Prob>chi2
102,.91 0,000
219,75 0,000 Friedman’s test of
cross sectional independence
23,673 0,309
24,.436 0,2724
Notes: p-values are listed in parentheses.
* significant at 10 %, ** significant at 5 %, * significant at 1 %.
Standard errors in models (1) and (2) are cluster robust. Models (3) and (4) allow for group-wise heteroscedasticity and panel specific autocorrelation.Standard errors in models (5) and (6) are corrected using the approach of Windmeijer (2005). Estimations of models (5) and (6) are done with order xtabond2 (Roodman, 2009).
Source: author’s estimation
In models (1) and (2), the coefficient of the regional inequalities in human capital is statistically significant and negative (at the 1 % significance level), which implies that higher regional inequalities in human capital will reduce the competitiveness of the EU member states. The influence of regional inequalities in GDP per capita is positive, but it is not statistically significant (at 1 %, 5 % or 10 % levels), as is also the case for the influence of Structural and Cohesion Fund payments. The reason for this can also be the endogeneity of these variables, as is explained in (Mohl & Hagen 2010). Furthermore, the coefficients of the dummy variables in Table 2, in models (1) and (2), confirm that new EU member states and countries that have a significant (more than 50 %) share of less developed EU regions have lower competitiveness in comparison with the other EU member states due to statistically significant (at the 1 % level) results. In models (3) and (4), the results of the FGLS models are presented, allowing for group-wise heteroscedasticity and panel specific error autocorrelation due to the described problems in the regression outputs in models (1) and (2). It can be seen that the regressions reported through models (3) and (4) support the findings of the regressions in (1) and (2). It is interesting to investigate whether the significance of the given coefficients will change in dynamic panel data modelling, especially regarding the influence of the EU’s Structural and Cohesion Funds, which try to reduce regional inequalities and boost competitiveness in the long term.
As can be seen in outputs (5) and (6) in Table 2, model diagnostics provides support to the dynamic models. The number of instruments is lower than the number of groups, and the coefficient of the lagged dependent variable takes an absolute value less than unity (Stojcic et al., 2012); m1 and m2 are tests for first-order and second-order serial correlation, where the regression outputs show no second-order serial correlation. This is consistent with the assumption of no second-order autocorrelation, based
on Arellano and Bond (1991). According to Sargan, 1958; Hansen, 1982; Blundell & Bond, 1998), the results of the test of the over-identifying restrictions (Sargan/Hansen J statistics) imply that the null hypothesis of instrument validity can not be rejected (for model (5) at the 10 %, 5 % and 1 % significance levels and for model (6) at the 5 % and 1 % significance levels). The results of the Wald test suggest that the variables jointly have significant explanatory power. In addition, the difference-in Hansen test for the validity of instruments also confirms the validity of instruments based on (Sarafidis et al., 2009) (results are available upon request).
We find a positive and statistically significant (at the 5 % level in model (5) and at 10 % in model (6)) impact of the lagged dependent variable. In outputs (5) and (6), the results confirm the results of the previous models, in which regional inequalities in human capital have a negative and statistically significant (at the 1 % level) influence on the competitiveness of the EU member states. This can be observed in line with (Bogumil, 2009), who explains that skilled labour is more likely to migrate to better developed areas, thus increasing the disparities between the regions. Similarly, Petrakos (2009) notes that although regional policies emphasise the role of human capital and innovation (in addition to entrepreneurship) in most of the less developed regions, such factors are still weak, so these regions are unable to break out of the underdevelopment trap. Certainly, this can increase regional inequalities in human capital, which will have a negative influence on the competitiveness of the EU member states.
Europe as a result of the positive effects generated by the agglomerations and higher investments from richer regions. In the dynamic models, the influence of the dummy variables is again negative and statistically significant (at the 1 % level), which confirms the robustness of the results. It can be concluded that the differences between the EU member states have an influence on competitiveness. More precisely, new EU member states have lower competitiveness, as do countries in which the share of less developed regions is higher than 50 %. This confirms the need to integrate a more place-based approach into regional and competitiveness policies in the EU.
Switching to the two-step system GMM estimator in our estimations, the influence of the EU’s Structural and Cohesion Funds variable becomes statistically significant (at the 5 % level in model (5) and at the 1 % level in model (6)), with a positive influence on the competitiveness of the EU member states. Regarding the significant positive influence of the EU’s Structural and Cohesion Funds in our analysis, as well as the significant negative influence of differences between the countries that have a higher share of less developed regions and the rest of the EU, it is important to emphasise the need for better absorption in less developed regions to achieve faster convergence towards the competitiveness levels of the developed and transition regions. This will boost the competitiveness of the EU member states, including the new EU member states. Taking into account the negative influence of the dummy variables, the results also imply that it is possible that less competitive new EU member states and countries with a significant share of less developed regions are becoming less competitive, while old EU member states, developed regions and transition regions contribute to higher EU competitiveness. If we compare this result with the positive influence of regional inequalities in GDP per capita on competitiveness, it can be assumed (but not confirmed with statistically significant results) and further investigated in future research that although the regional inequalities in GDP per capita are higher, the influence of more developed (and more competitive) EU member countries on competitiveness can be positive.
Conclusions and Implications
This article is directed towards two objectives that are well known in the history of European integration: fostering economic competitiveness and reducing regional inequalities. This study has determined that regional inequalities in human capital have a negative and significant influence on the competitiveness of the EU, that is, regional inequalities in human capital endanger the national competitiveness of the EU member states. The influence of the Structural and Cohesion Funds (which represent important instruments in reducing inequalities) on the competitiveness of the EU member states in our analysis is positive and significant in the long run. The EU member states in which most of the regions are classified as less developed regions have lower competitiveness than the EU member states in which most of the regions are classified as transition and/or more developed regions. This implies that the classification of regions based on their level of development is important for the competitiveness of
the EU member states. It is in line with the cohesion policy fundamentals and with EU fund allocations. The differences in the competitiveness of new and old EU member states are also significant. New EU member states have lower competitiveness, as was expected.
Policymakers are challenged to find ways to provide balance. The results of this analysis imply that, in the long run, economic policymakers cannot focus solely on the economic competitiveness of the EU member states. They need an integrated, place-based approach that will observe competitiveness on the regional level, and analyse and understand the significance of (i.e. the obstacles created by) regional inequalities in boosting competitiveness. Further, they must investigate, in more detail, the absorption of the Structural and Cohesion Funds, in which human capital has an inevitable role. Regarding the positive influence of the EU’s funds and the lower competitiveness of the EU member states in which most of the regions are classified as less developed regions, the question of the effective absorption of the EU’s funds arises. The EU’s funds provide opportunity; however, regional policies should help all regions to grow, rather than merely provide transfers to lagging regions (Ketels, 2013, according to OECD 2010, 2011). The European Commission-Directorate-General for Regional and Urban Policy (2014) confirms that, for less developed member states, being geographically close to competitive regions does not tend to improve the competitiveness of a region. In the same study, it is highlighted that, until 2013, investment in human capital, as a share of total funding, was consistently higher in the other EU-15 regions than in less developed ones. Moreover, the new member states have allocated a much larger share of funding to infrastructure and the environment than to human capital (European Commission-Directorate-General for Regional and Urban Policy, 2014, 206–207). This implies a need to invest more to human capital in less developed regions, as well as in new EU member states.
Local and regional authorities should activate human capital on regional levels and enable the better absorption of investments, as well as the dispersion of the positive multiplicative effects of human capital. This “bottom-up” approach will facilitate the creation of economic value at lower levels. It can also contribute to a reduction in inequalities and have a positive influence on regional or national competitiveness. A nation’s development policies, and its communications at the EU or member state level, must support these processes, especially in new EU member states and less developed regions, where human capital and economic potential is significantly underdeveloped. Policy actors at the EU and national levels should control the implementation of the measures directed towards strengthening human capital, in line with Europe 2020, the EU’s strategic framework for education and heterogeneous action plans, to boost the competitiveness of the observed territories.
NUTS 2 levels, the calculation of the measurement of human capital inequalities is constrained, for example, because of the lack of regional data on the years of schooling, the rates of return, school dropouts, etc. It is possible to distinguish the influence of Structural and Cohesion Fund payments by funds and objectives (where investments in human capital are especially important), groups of regions, and EU member countries, to calculate regional inequalities in the absorption of the EU’s funds, which can lead to higher regional inequalities in human
capital, or to include other differences in the spatial distribution. In future research, it would be interesting to determine whether the inequalities in human capital rise at the lower levels of human capital (development and competitiveness) and subsequently decline at the higher levels of human capital (development and competitiveness). For economic policy implications, it would be useful to ascertain whether it is possible to determine the position of the turning point, which is also a task for future analysis.
References
Alquezar Sabadie, J., & Johansen, J. (2010). How Do National Economic Competitiveness Indices View Human Capital.
European Journal of Education, 45(2), 236–258. http://dx.doi.org/ 10.1111/j.1465-3435.2010.01427.x
Annoni, P., & Kozovska, K. (2010). EU Regional Competitiveness Index 2010. Luxembourg: Publications Office of the European Union. European Commission Joint Research Centre, Institute for the Protection and Security of Citizen. Annoni, P., & Dijkstra, L. (2013). EU Regional Competitiveness Index - RCI 2013. Luxembourg: Publications Office of the
European Union. European Commission Joint Research Centre, Institute for the Protection and Security of Citizen. Arellano, M., & Bond, S. (1991). Some Tests of Specification for Panel Data: Monte Carlo Evidence and an Application to
Employment Equations. Review of Economic Studies, 58(2), 277–297. http://dx.doi.org/10.2307/2297968
Arellano, M., & Bover, O. (1995). Another Look at the Instrument Variable Estimation of Error-Components Models.
Journal of Econometrics, 68(1), 29–51. http://dx.doi.org/10.1016/0304-4076(94)01642-D
Aristovnik, A. (2014a). Efficiency of the R&D sector in the EU-27 at the regional level: an application of DEA. Lex Localis,
12(3), 519–531.http://dx.doi.org/10.4335/12.3.519-531(2014)
Aristovnik, A. (2014b). Development of the information society and its impact on the education sector in the EU : efficiency at the regional (NUTS 2) level. The Turkish Online Journal of Educational Technology, 13(2), 54–60. Available from internet: http://www.tojet.net/articles/v13i2/1326.pdf
Baltagi, B. H. (2005). Econometric Analysis of Panel Data. Chichester: John Wiley and Sons Ltd.
Barrios, S., & Strobl, E. (2009). The dynamics of regional inequalities. Regional Science and Urban Economics, 39(5), 575– 591. http://dx.doi.org/10.1016/j.regsciurbeco.2009.03.008
Beck, N., & Katz, J. N. (1995). What To Do (and Not To Do) With Time Series Cross-Section Data. American Political
Science Review, 89 (3), 634–647. http://dx.doi.org/10.2307/2082979
Blundell, R., & Bond, S. (1998). Initial Conditions and Moment Restrictions in Dynamic Panel Data Models. Journal of
Econometrics, 87(1), 115–143. http://dx.doi.org/10.1016/S0304-4076(98)00009-8
Bogumil, P. (2009). Regional disparities in Poland. ECFIN Country Focus, 6(4), 1–7. Available from internet: http://ec.europa.eu/economy_finance/publications/publication15180_en.pdf
Brante, I. (2012). The between-country inequality: does it hinder the competitiveness? Economics and Management, 17(1), 136–141. http://dx.doi.org/10.5755/j01.em.17.1.2261
Breusch, T. S., & Pagan, A. R. (1980). The Lagrange Multiplier Test and its Application to Model Specification in Econometrics. TheReview of Economic Studies, 47(1), 239–253. http://dx.doi.org/10.2307/2297111
Bruneckiene, J., Cincikaite, R., & Kilijoniene, A. (2012). The Specifics of Measurement the Urban Competitiveness at the National and International Level. Inzinerine Ekonomika-Engineering Economics, 23(3), 256–270. http://dx.doi.org/10. 5755/j01.ee.23.3.1272
Castello-Climent, A., & Domenech, R. (2002). Human Capital Inequality and Economic Growth: Some New Evidence. The
Economic Journal, 112(478), 187–200. http://dx.doi.org/10.1111/1468-0297.00024
Castello-Climent, A., & Domenech, R. (2014). Human Capital and Income Inequality: Some Facts and Some Puzzles. BBVA Research, Working Paper, No. 12/28, March. Available from internet: http://webmeets.com/files/papers/res /2014/715/Castello_Domenech_Inequality_March2014.pdf
Cheng, J. Y., & Chan, S. W. H. (2012). Increasing the competitive positions of countries through employee training. The competitiveness motive across 33 countries. International Journal of Manpower, 33(2), 144–158. http://dx.doi.org/10. 1108/01437721211225408
De Gregorio, J., & Lee, J. W. (2002). Education and Income Inequality: New Evidence from Cross-country data. Review of
Income and Wealth, 48(3), 395–416. http://dx.doi.org/10.1111/1475-4991.00060
De Dominicis, L. (2014). Inequality and Growth in European regions: Towards a Place-based Approach. Spatial Economic
Analysis, 9(2), 120–141. http://dx.doi.org/10.1080/17421772.2014.891157
European Commission (2011). The urban and regional dimension of Europe 2020. Seventh progress report on economic, social and territorial cohesion. Luxembourg: Publications Office of the European Union. Available from internet: http://ec.europa.eu/regional_policy/sources/docoffic/official/reports/interim7/interim7_en.pdf
European Commission-Directorate-General for Regional and Urban Policy (2014). Investment for jobs and growth. Promoting development and good governance in EU regions and cities. Sixth report on economic, social and territorial cohesion. Luxembourg: Publications Office of the European Union. Available from internet: http://ec.europa.eu/regional_policy/sources/docoffic/official/reports/cohesion6/6cr_en.pdf
European Commission-Eurostat (2012). Eurostat regional yearbook 2012. Luxembourg: Publications Office of the European Union. Available from internet: http://epp.eurostat.ec.europa.eu/portal/page/portal/product_ details/publication? p_product_code=KS-HA-12-001
European Commission-Eurostat (2014a). Regions and cities. Regional Labour market statistics-data from the Labour Force Survey. Bruxelles: European Commission. Available from internet: http://epp.eurostat.ec.europa.eu/portal/ page/portal/region_cities/regional_statistics/data/database
European Commission-Eurostat (2014b). Statistics Database. Bruxelles: European Commission. Available from internet: http://epp.eurostat.ec.europa.eu/portal/page/portal/statistics/themes
European Commission-Regional Policy-Inforegio (2014a). Cohesion Policy 2014-2020. Bruxelles: European Commission. Available from internet: http://ec.europa.eu/regional_policy/what/future/index_en.cfm
European Commission-Regional Policy-Inforegio (2014b). EU Payments to Member States with a breakdown by programming periods, Member States, Funds and years. Bruxelles: European Commission. Available from internet: http://ec.europa.eu/regional_policy/impact/evaluation/data_en.cfm
Friedman, M. (1937). The Use of Ranks to Avoid the Assumption of Normality Implicit in the Analysis of Variance. Journal
of the American Statistical Association, 32(200), 675–701. http://dx.doi.org/10.2307/2279372
Galbraith, J. K., & Garcilazo, J. E. (2010). Inequalities, employment and income convergence in Europe: evidence from regional data. International Review of Applied Economics, 24(3), 359–377. http://dx.doi.org/10.1080/ 026921 71003701594
Gennaioli, N., La Porta, R., Lopez-de-Silanes, F., & Shleifer, A. (2013). Human Capital and Regional Development. The
Quarterly Journal of Economics, 128(1), 105-164. http://dx.doi.org/10.1093/qje/qjs050
Greene, W. (2000). Econometric Analysis. Upper Saddle River: Prentice-Hall.
Hansen, L. P. (1982). Large Sample Properties of Generalized Method of Moments Estimators. Econometrica, 50(4), 1029– 1054. http://dx.doi.org/10.2307/1912775
Hausman, J. A. (1978). Specification Tests in Econometrics. Econometrica, 46(6), 1251–1271. http://dx.doi.org/ 10.2307/1913827
IMD (2013). IMD World Competitiveness Yearbook – online database. Lausanne: IMD World Competitiveness Centre. IMD (2014). IMD World Competitiveness Yearbook 2014. Lausanne: IMD World Competitiveness Centre. Available from
internet: http://www.imd.org/wcc/wcy-world-competitiveness-yearbook/
Ju, Y., & Sohn, S. Y. (2014). Development of a national competitiveness index based on a structural equation model.
Technology Analysis & Strategic Management, 26(5), 565–-579. http://dx.doi.org/10.1080/09537325.2014.896891
Ketels, C. (2013). Recent research on competitiveness and clusters: what are the implications for regional policy? Cambridge
Journal of Regions, Economy and Society, 6(2), 269–284. http://dx.doi.org/10.1093/cjres/rst008
Kristjansdottir, H. (2008). Determinants of Nordic Competitiveness. Available from internet: http://www.researchgate.net /publication/241714708_Determinants_of_Nordic_Competitiveness
Krugman, P. (1994). Competitiveness: A Dangerous Obsession. Foreign Affairs, 73(2), 28–44. http://dx.doi.org/10. 2307/20045917
Lessmann, C. (2013). Foreign direct investment and regional inequality: A panel data analysis. China Economic Review, 24(2013), 129–149. http://dx.doi.org/10.1016/j.chieco.2012.12.001
Lim, A. S. K., & Tang, K. K. (2008). Human Capital Inequality and the Kuznets Curve. The Developing Economies, 46(1), 26–51. http://dx.doi.org/10.1111/j.1746-1049.2007.00054.x
Mencinger, J., & Aristovnik, A. (2013). Fiscal Policy Stance in the European Union: The Impact of the Euro. Inzinerine
Ekonomika-Engineering Economics, 24(1), 52–62.http://dx.doi.org/10.5755/j01.ee.24.1.1614
Mohl, P., & Hagen, T. (2010). Do EU structural funds promote regional growth? New evidence from various panel data approaches. Regional Science and Urban Economics, 40(5), 353–365. http://dx.doi.org/10.1016/ j.regsciurbeco. 2010.03.005
Mora, T. (2008). Explaining Within-Country Regional Inequality in the European Union. Scienze Regionali(Italian Journal
of Regional Science), 7(2), 51–69.
Niebuhr, A., Granato, N., Haas, A., & Hamann, S. (2012). Does Labour Mobility Reduce Disparities between Regional Labour Markets in Germany? Regional Studies, 46(7), 841–858. http://dx.doi.org/10.1080/00343404.2010.532118 OECD (2010). Regional Development Policies in OECD Countries. Paris: OECD.
OECD (2011). OECD Reviews of Regional Innovation: Regions and Innovation Policy. Paris: OECD. OECD (2012). Economic Policy Reforms 2012. Going for Growth. Paris: OECD.
Obadic, A. (2006). Influence of Regional Mismatch on the Employment Process in Selected Transition Countries. Ekonomski
pregled (Economic Review), 57(1–2), 3–30.
Obadic, A., Simurina, N., & Sonora, R. (2014). The effects of tax policy and labour market institutions on income inequality.
Zbornik radova Ekonomskog fakulteta u Rijeci: casopis za ekonomsku teoriju i praksu (Proceedings of Rijeka Faculty of
Economics: Journal of Economics and Business), 32(1), 121–140.
Pesaran, M. H. (2004). General Diagnostic Tests for Cross-section Dependence in Panels. The Institute for the Study of Labor, Discussion Paper, No. 1240, August. Available from internet: http://ftp.iza.org/dp1240.pdf
Petrakos, G. (2009). Regional growth and inequalities in the European Union. Discussion Paper Series, 15(2), 23–44. Available from internet: http://www.prd.uth.gr/uploads/discussion_papers/2009/uth-prd-dp-2009-02_en.pdf
Porter, M. E. (1990). The Competitive Advantage of Nations. New York: Free Press.
Roodman, D. (2009). How to do xtabond2: An introduction to difference and system GMM in Stata. The Stata Journal, 99(1), 86–136. http://dx.doi.org/10.2139/ssrn.982943
Sarafidis, V., Yamagata, T., & Robertson, D. (2009). A Test of Cross Section Dependence for a Linear Dynamic Panel Model with Regressors. Journal of Econometrics, 148(2), 149–161. http://dx.doi.org/10.1016/j.jeconom.2008.10.006
Sargan, J. D. (1958). The Estimation of Economic Relationships using Instrumental Variables. Econometrica, 26(3), 329– 338. http://dx.doi.org/10.2307/1907619
Simanaviciene, Z., Kilijoniene, A., Simanavicius, A., & Khadzhynov, I. (2014). Transformation of Lithuania and Ukraine Regional Policy. Inzinerine Ekonomika-Engineering Economics, 25(3), 350–359. http://dx.doi.org/10. 5755/j01.ee. 25.3.6187
Seguino, S. (2005). All Types of Inequality are Not Created Equal: Divergent Impacts of Inequality on Economic Growth. The Levy Economics Institute of Bard College, Working Paper, No. 433, December. Available from internet: http://www.levyinstitute.org/pubs/wp_433.pdf
Stanickova, M., & Skokan, K., (2012). Evaluation of the EU Member States Efficiency by Data Envelopment Analysis Method. International Journal of Mathematical Models and Methods in Applied Sciences, 6(2), 349–357.
Stojcic, N., Becic, M., & Vojinic, P. (2012). The Competitiveness of Exports from Manufacturing Industries in Croatia and Slovenia to the EU-15 market: A Dynamic Panel Analysis. Croatian Economic Survey, 14(1), 69–105.
Szorfi, B. (2007). Development and Regional Disparities – Testing the Williamson Curve Hypothesis in the European Union.
Focus on European Economic Integration, 2, 100–121. Available from internet: http://ideas.repec.org/a/onb /oenbfi/
y2007i2b4.html
Van Leeuwen, B., & Foldvari, P. (2008). How much human capital does Eastern Europe have? Measurement methods and results. Post Communist Economies, 20(2), 189–201. http://dx.doi.org/10.1080/14631370802018932
Verbeek, M. (2004). A Guide to Modern Econometrics. Chichester: John Wiley & Sons Ltd.
Vrtenova, L., Sobotka, M., & Mala, L. (2009). Measurement of regional disparities and economic competitiveness of regions. Available from internet: https://dspace.upce.cz/bitstream/10195/35658/1/VrtenovaL_Measurement OfRegional _SP_FES_2009.pdf
Windmeijer, F. (2005). A finite sample correction for the variance of linear efficient two-step GMM estimator. Journal of
Econometrics, 126(1), 25–51. http://dx.doi.org/10.1016/j.jeconom.2004.02.005
Wooldridge, J. M. (2002). Econometric Analysis of Cross Section and Panel Data. Cambridge, Massachusetts, London: The MIT Press.
WEF (2014). The Global Competitiveness Report 2014–2015. Geneva: World Economic Forum. Available from internet: http://www3.weforum.org/docs/WEF_GlobalCompetitivenessReport_2014–15.pdf