REVIEW OF ELECTRICAL ENERGY LOSSES IN NIGERIA
O. M. Komolafe
1,* and K. M. Udofia
21,2,
D
EPT OFE
LECTRICAL/E
LECTRONIC ANDC
OMPUTERE
NGR’
G,
U
NIV.
OFU
YO,
A
KWAI
BOMS
TATE,
NIGERIA
E-mail addresses:
1[email protected],
2[email protected]
ABSTRACT
The Nigerian electric power sector holds a lot of unfulfilled potentials for the economic development of Africa’s most populous country; the electric energy generated is not up to 30% of the national demand and worse still, over 50% of this paltry sum is recorded as losses—this is not indicative of commercial viability. The visible efforts being made to address the problems, though laudable, do not fully demonstrate complete appreciation of the underlying root causes. In this paper, an examination of the structure of the Nigerian electricity industry is provided followed by a technical review of factors responsible for the excessive losses (technical and non-technical) in the system. The solutions proffered would enable improved response, first to efficiently manage the available energy and also to grow the industry for the good of the nation.
Keywords: Nigerian power distribution system, electric energy theft, power losses in Nigeria.
1.INTRODUCTION
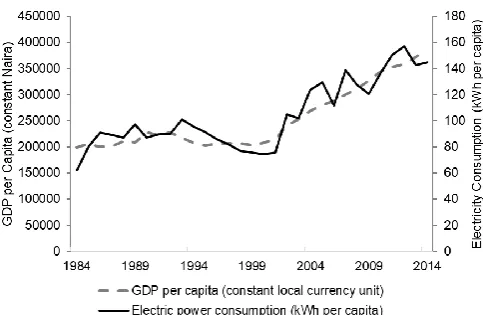
Energy is the basic necessity for national development and in this modern world, it has become part of our daily lives. Availability of sufficient amount of energy has led to shorter working days, improved agricultural output, increased industrial production, better health conditions, more nutritious diets and better transportation facilities [1]. Different forms of energy exist but electrical energy is by far the most important form [2]. Development indicators generally correlate positively with electric power consumption [3]. For example, Figure 1 indicates that development in Nigeria goes hand-in-hand with electric power consumption when Gross Domestic Product (GDP) is used as an indicator. In spite of the criticality of electric power to national development, electric power generation in Nigeria is inadequate—less than 30% of the national demand. Worse still, more than 50% of the energy generated is reported to be lost in the distribution network [4]. This calls for urgent action, almost of the same status as an emergency, backed by a robust understanding of the underlying root causes of the losses in the Nigerian power system. A number of authors have written on the subject of electrical energy losses in Nigeria. In [6], the author attributes losses in the Nigerian power system predominantly to energy theft and proposed
legislation against energy theft as the panacea; other causes of losses were not discussed. The authors of [7] evaluated the non-technical losses in a selected 33 kV network in the Nigerian system and found that it exceeded the technical losses; no effort was made to identify the cause or propose solutions. In [8], the authors viewed consumer apathy in adopting prepaid tariff meters (due to suspicions about its accuracy) as a problem. They proceeded to address it by experimentally determining the energy consumption of some residential loads and compared it with readings from a prepaid tariff meter to show accuracy. This is closely related to [9] where the authors revealed a case study in which a reduction in utility revenue resulted from the migration of a customer from post-paid to prepaid billing, showing the impact of estimated billing on the consumers. A part of the metering problem which contributes to losses in the distribution system was addressed but the works did not cover other factors responsible for losses. In [10] and [11] the authors provided detailed reviews of the Nigerian electricity industry and highlighted the common generation and transmission insufficiency problems with solutions proposed, including improved government funding.
A holistic approach with focus on the key loss contributors in the value chain is missing in these
Vol. 39, No. 1, January 2020, pp.
246 – 254
Copyright© Faculty of Engineering, University of Nigeria, Nsukka,Print ISSN: 0331-8443, Electronic ISSN: 2467-8821
reviewed works; this work attempts to fill the gap. The rest of this work is organized as follows: Section 2 expatiates on the subject of losses in power systems while in Section 3 we discuss the structure of the Nigerian electric power industry. In Section 4, we drill deeper into the operational issues responsible for losses in the system and conclude in Section 5. References are provided in Section 6.
2.LOSSES IN POWER SYSTEMS
Losses are inevitable in the provision of electrical energy; even technologically advanced countries cannot make all the electricity generated available for consumer use; some of it is lost just due to the nature of the business of generating, transmitting and distributing electricity. In Figure 2 a comparison of electrical energy losses as a percentage of total production is presented for some selected countries over a few years.
The chart (Figure 2) suggests that Nigeria made progress over the years in the reduction of total electric power losses even though the over 15% loss in 2014 was almost double the world average of 8.25% for the year. As will be seen shortly, a different picture emerges when other considerations are applied. Electric energy losses are broadly divided into two - technical and non-technical losses.
2.1.Technical Losses
Technical losses occur because the electrical equipment used in the power system, by nature, have losses associated with them which cannot be totally eliminated. Generators/transformers have losses in their windings (due to the winding resistance) as well as their core (due to eddy current and hysteresis).
Figure 1: Correlation of GDP and Electric Power Consumption in Nigeria
Figure 2: Electric Power Distribution and Transmission Losses for Selected Countries (% of
output)
Source: Compiled by the author using data from [5].
Transmission/distribution lines have losses due to the thermal effect of current flow in the conductors, as well as corona at higher voltages. Cables have resistive and dielectric losses; even fiscal meters also have associated losses [9]. Technical losses can be computed from the load flow study together with the equipment parameters. For example, the total losses in the wires of any three-phase balanced distribution system is given by
𝑃𝐿=
2 𝑃2 𝜌𝑙 3𝑎 𝑉𝑚2 𝑐𝑜𝑠2𝜑
(1)
PL is the power loss in the three line conductors in
watts, P is the power transmitted in watts, 𝜌 is the
resistivity of the conductor material, l is the length of the line in meters, a is the cross-sectional area of the conductor, Vm is the peak phase voltage, cos 𝜑 is the
power factor with 𝜑 being the angular difference
between the load current and voltage phasors.. Technical losses can be reduced through the use of more efficient equipment and optimized network design [12].
2.2.Non-Technical Losses
These losses affect the profitability of the power venture and also impose undue strain on the paying customers whose tariff often include factors that account for energy loss. While efforts continue towards investment in the Nigerian Electricity Supply Industry (NESI), it is important to understand the system losses and take corrective actions in order to better utilize the available power. This is further emphasized by the fact that over 55% of the Nigerian populace do not have access to modern electricity [14].
3.THE NIGERIAN ELECTRIC POWER SYSTEM
The Electricity Corporation of Nigeria (ECN) managed electricity supply in Nigeria from 1950 when it was established until circa 1972 when it gave way to the National Electric Power Authority (NEPA). NEPA held sway until its unbundling after the enactment of the Electric Power Sector Reform Act (EPSRA) in 2005 [10]. With the power sector unbundled and generation/distribution sectors privatized, there is now a renewed focus on achieving profitability. Key constituents of the NESI today are discussed in the ensuing sections.
3.1.Generation Companies (GENCOS)
GENCOs are privately owned power plants located across the country. They produce the electricity using any commercially viable approved means and inject into the grid; about 28 power plants exist in Nigeria today with installed capacity ranging from 22 MW to 1074 MW [4]. Figure 3 shows that the bulk of Nigeria’s power supply is derived from fossil fuels; although Nigeria has up to 6.5 kWh/m2 of solar energy per day [15], it is not being exploited sufficiently. Further, as seen in Figure 4, there is a large (and widening) gap between the national demand and the available generation capacity.
3.2.TRANSMISSION COMPANY OF NIGERIA (TCN)
TCN is responsible for managing, operating and expanding the 330 kV and 132 kV transmission system (estimated at over 20000 kilometres) [4]. The System Operator and the Market Operator within TCN manage the daily operation of the electricity grid and administer the commercial exchanges in the NESI respectively, amongst other responsibilities. As seen in Figure 4, the transmission capacity is 8100 MW. Although this falls short of the national power demand, it is not currently the limiting factor as a significant
portion of the installed generation capacity is unavailable for utilization.
Transmission loss is computed from the difference between the power metered at the GENCO and the power metered at the distribution end; regulatory target is 8.05% (although this is above the emerging countries benchmark of 2% to 6%) [4] . Figure 5 shows that this target is generally being met.
3.3.Nigerian Bulk Electricity Trading PLC (NBET)
NBET is a government-owned company responsible for bulk purchase of electric power from the GENCOs using Power Purchase Agreements (PPA) and reselling same to distribution companies (DISCOs) or customers through Vesting Contracts. In a way, NBET provides a form of payment assurance to the GENCOs, shielding them from the market vulnerabilities. Considering the huge losses and insufficient remittances from the DISCOs, the sustenance of NBET in the event that its alternative source of funds becomes unavailable is uncertain.
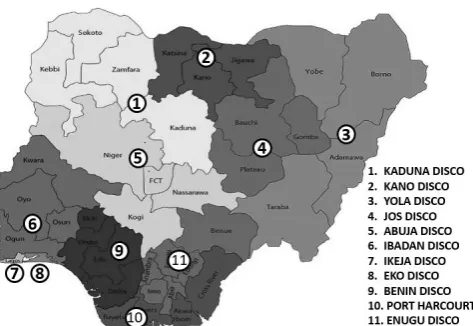
3.4.Distribution Companies (DISCOS)
The country is divided along geographical lines and assigned to DISCOs which are responsible for managing the connection of power to the final consumer (see Figure 6). There are eleven DISCOs in operation; they handle the billing / collection of tariff and remit to the Market Operator for disbursement to eligible stakeholders in the NESI. The Aggregate Technical and Commercial Collection Loss (ATC&C) generally indicates the energy received from TCN but for which remittance is not made. Figure 5 shows an average of more than 50% ATC&C across the DISCOs for the period covered. It is immediately apparent that urgent intervention is required for sustainability. With such magnitude of ATC&C losses, it is not surprising that the DISCOs often reject power (load rejection) that is available for them to take for distribution to the consumers; not minding that the available energy is insufficient in the first place [17].
3.5.Nigerian Electricity Regulatory Commission (NERC)
4.FACTORS AFFECTING THE SYSTEM LOSSES
As seen, although there are opportunities for loss reduction in the transmission subsystem, the bulk of the losses in the NESI can be attributed to the distribution system. A number of contributory factors have been identified; these are discussed in the ensuing subsections, focus being on the distribution system.
4.1.Inadequate Metering
As at the end of December 2018, about 57% of the total registered customers of the DISCOs were unmetered [4]. Although a higher billing efficiency is reported (this is the percentage of the energy received that is billed to customers; the shortfall being attributed to distribution technical losses and energy theft), for example, 81% in the third quarter of 2018 [4], the statistic is of diminished relevance when a significant portion of it is only estimated and subject to dispute by the customers. Little wonder that in the third quarter of the same year 2018, metering and billing complaints constituted more than half of the total complaints received [4].
Further, NERC regulation allows a consumer who has paid for an electricity meter under its Cash Advance for Metering Initiative (CAPMI) to discontinue payment of estimated bills posted by the DISCO after forty-five days if the meter is not deployed [4]. In addition, Maximum Demand customers with no meters are no longer required to pay any estimated bills [18]. This author personally encountered an individual who claimed to have paid for a meter but has not been issued with one and as a result has neither received a bill nor paid for electricity in the last two years. If this is widespread across the country, it further accentuates the loss of revenue occasioned by lack of electricity meters.
In an effort to address the metering challenge, NERC has provided a means for the DISCOs to engage third party companies, known as Meter Asset Providers (MAP), to bridge the gap through provision of financing, procurement, supply, installation and maintenance of electricity meters. This is a step in the right direction. In addition, there is a need to ensure that the metering infrastructure being deployed will be capable of supporting a smart grid which should be the logical next step in the bid to combat energy theft. A smart grid is made when intelligent meters / sensors on a communication network are added to the traditional power grid; the meters and sensors generate and transmit a large amount of electricity
usage data which can be mined to detect energy theft [19].
Table 1: Classes of Electricity Consumers in Nigeria
Tariff Class Description
R Residential A customer who uses his premise exclusively as a residence i.e. house, flat, or multi-storied house
C Commercial
A customer who uses his premise for any purpose other than exclusively as a residence or as a factory for
manufacturing goods
I Industrial A customer who uses his premises for manufacturing goods including welding and ironmongery
A Special
Customers such as agriculture and agro-allied industries, water boards, religious houses, government and teaching hospitals, government research institutes and educational establishments.
S Street Lights Street lights
Source: Compiled from [4]
Figure 3: Electricity Generation Sources in 2016. Left - Nigeria, Right - World.
Source: Prepared by the author using data from [16].
Figure 5: Monthly Transmission Loss and Average Aggregate Technical and Commercial Collection Losses across the DISCOs.
Source: Developed by the author with data sourced from [4].
Figure 6: Map of Nigeria showing DISCO assignment. Source: Developed by the author using base file from
[4]
4.2 Poor Voltage Control
On the 330kV transmission system, voltages as low as 281kV has been recorded, this represents ~ 15% deviation from normal. Cascading to the low voltage distribution system, even lower voltages has been seen. Figure 7 shows the voltage captured at a typical residential home; the input voltage from the DISCO is a paltry 60% of the nominal 240 V. For this reason, it is a common practice for consumers to procure residential voltage regulators (also known as voltage stabilizers in local parlance) in order to provide the required voltage to the load for proper operation. Otherwise, loads like refrigerators and air conditioners may not function properly or in the worst case be subject to damage. The voltage regulator therefore functions to modify the voltage; however, for the required power to be drawn from the utility, the current has to increase. This results in increased losses (I2R) in the conductors.
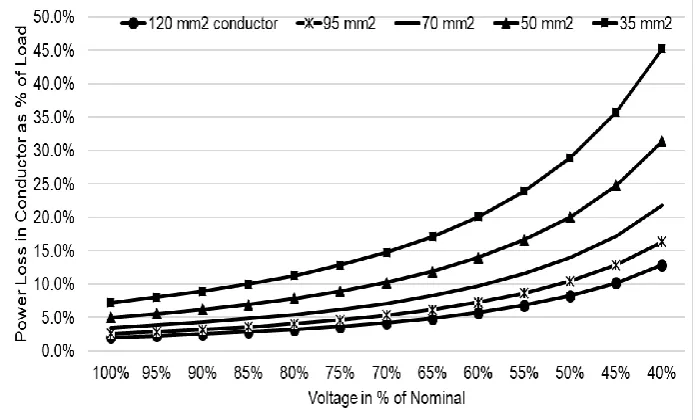
A study of the power loss in the distribution conductors for a single phase 5 kW load located 500 meters from the distribution transformer is presented in Figure 8; it shows that at 60% terminal voltage, using a 95 mm2
conductor, a loss of 7.3% of the power delivered occurs in the conductor whereas if the consumer terminal voltage had been maintained within the NERC Distribution Code requirement of ±6% at the consumer terminal [4], the loss would have been reduced to only 2.9%. The loss in the conductor is clearly unmetered and shows up in the DISCO losses since the TCN would have metered it as energy delivered. However, as noted in Section 1.2, the billing scheme approved by the industry regulator, NERC for the DISCOS inevitably passes some of this cost of losses to the consumers, resulting in a higher tariff [4]. Generally, execution of voltage control farther away from the load results in less line losses. Therefore, to address the voltage problem, it is important that the transmission and primary distribution voltages be maintained within the statutory limits. The methods and equipment for doing this are well established and include voltage control at the generating stations, use of online tap changer transformers (OLTC) and introduction of line reactors [21]. In addition, step voltage regulators should be considered for the distribution network [22] alongside other methods like construction of new distribution substations nearer to the load and deployment of shunt capacitors which is the most cost-effective way of achieving voltage regulation on a feeder [23]. The predominant method of voltage control observed in the Nigerian distribution system is the construction of new distribution substations and adjustment of existing transformer taps. For the case study highlighted in this section, either of these methods can be adopted to resolve the voltage problem.
4.3 Sizing Of Distribution Conductors
This follows from the previous discussion as it can be seen from Figure 8 that even at 95% of nominal voltage, the line loss triples when the conductor size is reduced from 120 mm2 to 35 mm2. The service entry
conductor size is equally important; the loss in the section before the meter is not billed to the consumer. Various sizes of these cables/conductors were observed in the field.
non-renewable energy sources would have to be deployed when renewable sources become insufficient due to inefficient distribution; the impact might be beyond commercial quantification.
4.4 Prevalence Of Electrical Faults
It is common knowledge that there is a direct correlation between the onset of rainfall and initiation of power outage for the average Nigerian electricity consumer [24]. This large-scale load rejection at the distribution level has been reported to cause system overvoltage on the transmission system leading to total system collapse and equipment damage [24]. Rainfall by itself does not necessarily represent a trip command to an adequately designed distribution system but can easily expose inadequately designed/maintained systems. Faults can occur due to swaying trees making contact with the feeder during high winds, degraded insulators flashing over during lightning, mechanically weak sections of the line giving way and short circuit (direct contact or by string of water) between sagged line conductors in high wind. In some instances, the utility even deliberately turns off the supply to prevent anomalies that are almost sure to occur if the system is left energized [25]. The energy cost of an electrical fault in a well-designed 500 kVA distribution substation, as shown in
Table 2 is relatively insignificant at under N5000; the assumption being that the phase protection fuses will act to interrupt the fault, including a low impedance ground fault. This however changes if the substation is not adequately designed or the fault clearing time is long; the result could be equipment damage. In addition, when the faults are frequent, the cost begins to assume some significance. Further, high impedance ground faults will go undetected without separate ground fault protection equipment since the magnitude of the fault current will generally be below the trip curve of the fuses. This will represent an ongoing energy loss to the utility until the fault is detected and rectified or it degenerates into a low impedance fault and trips the phase fuse.
Addressing the system problems causing frequent trips requires some capital outlay [22] but considering the cascaded effect, it is an undertaking that must be done if the dream of constant power supply is to be achieved.
4.5 Unbalanced Loads
It is not uncommon to see all the four supply conductors (three phases and neutral) from the
secondary distribution transformer connected to the single-phase consumer with wire connections to enable phase selection. Whenever there is loss of supply or excessively low voltage on one phase, consumers would then operate their fuse cut-out to transfer to any phase that is still energized. The realization that supply is still available on other phases usually occurs by observation of nearby houses or through indicators (usually light bulbs) installed at the premises (this in itself constitutes a waste of energy when it is left lit perpetually). The impact of this is that there is heavy unbalance in the transformer load, significantly increasing the conductor losses. Figure 9 shows that for a hypothetical 95 mm2 distribution conductor feeding a load located 500 m from the distribution station, the line conductor loss increases almost 18 times when it is supplied as single-phase load versus when it is supplied as a balanced three phase load.
It becomes critical therefore for the utility to focus on distributing the consumer loads as evenly as possible across the transformer phases to reduce conductor losses. Loss of supply, faults or low voltage on a phase should be detected in a timely manner and corrected, to deter consumers from switching and upsetting the system balance. With smart metering, it should be possible to compare the time-stamped voltage waveform reported by the consumer meter with the phase waveforms on the distribution line in order to remotely detect the phase to which a consumer is connected. This will enable proactive balancing action.
4.6 Lack of Legislation on Electric Energy Theft
Nigeria because there is no law on electrical energy theft (although disconnection and payment of a fee before reconnection is practised). However, a bill seeking to criminalize and punish electricity theft with fines and jail terms has been submitted to the National Assembly by NERC [29].
The provision of a “lifeline” tariff of N4/kWH in the NERC MYTO for consumers who do not exceed 50 kWH per month is commendable [4] and will contribute towards reduction of theft. DISCOs need to deploy advanced metering infrastructure leveraging smart meters to detect energy theft. In addition, they need to also look inwards to detect staff who might be colluding with customers to steal electricity [30].
Figure 7: Utility Voltage Captured at a Typical Nigerian Residential Home.
Figure 8: Power Loss in a Bare Overhead Aluminum Conductor Serving a 5 kW Load Located 500 m from the Distribution Source. Source: Prepared by the author with conductor resistance data taken from [20].
Table 2: Simple Estimate of the Cost of a 3-Phase Fault
Parameter
Value
Comment
Transformer Capacity (kVA)
500
Typical
Line Voltage (kV)
0.415
Typical
Impedance, Z (%)
5
Typical
Full Load Current, FLC (A)
695.6
kVA / (1.732 * kV)
3 Phase Max Short Circuit Current (A)
13912.05
FLC / %Z
Fault Clearing Time (s)
0.1
Assumes 5, 50Hz cycles
Fault Impedance (Ohms)
0.01722
Converted %Z to Ohm
Energy Dissipated (kWH)
92.59
Calculated; I
2Rt
Cost of Energy Dissipated (N)
4629.63
Assumes N50 per kWH
5.CONCLUSION
The Nigerian electricity holds a lot of promise for her population especially after the unbundling / privatization exercise. Realizing this promise requires good understanding of the underlying problems in order to tackle them effectively. This paper presented some of these issues relating to losses from a technical perspective, to enable increased comprehension and drive urgent change.
6.REFERENCES
[1]. V. Mehta and R. Mehta, Principles of Power Systems, New Delhi: S. Chand Publishing, 2014.
[2]. D. Kothari and I. Nagrath, Modern Power System Analysis, 4th ed., New Delhi, Tata McGraw Hill Education Private Limited, 2013. [3]. A. A. Ogundipe, O. Akinyemi and O. M.
Ogundipe, "Electricity consumption and economic development in Nigeria,"
International Journal of Energy Economics and Policy, vol. 6, no. 1, pp. 134-143, 2016. [4]. Nigerian Electricity Regulation Commission
(NERC), "Industry statistics” [Online]. Available:
https://nercng.org/index.php/library/industry- statistics/distribution/119-atc-c-losses/464-ph-disco#data. [Accessed 20 March 2019]. [5]. The World Bank, "World development
indicators," [Online]. Available: https://data.worldbank.org/. [Accessed 7 April 2019].
[6]. A. Adeniran, "Mitigating electricity theft in nigeria," 14 March 2018. [Online]. Available: http://cpparesearch.org/nu-en-pl/mitigating-electricity-theft-nigeria/#. [Accessed 10 April 2019].
[7]. L. M. Adesina and A. Ademola, "Determination of power system losses in Nigerian electricity distribution networks," International Journal of Engineering and Technology, vol. 6, no. 9, pp. 322-326, 2016.
[8]. U. Ogbuefi, P. Ene and P. Okoro, "Prepaid meter tariffing for actual power consumption in an average household: a case study of Nigeria DISCOs," Nigerian Journal of Technology, vol. 38, no. 3, pp. 750-755, 2019.
[9]. E. Ogujor and P. Otasowie, "The impact of the pre-paid meter on revenue generation in Nigeria," Pacific Journal of Science and Technology, vol. 11, no. 1, pp. 138-142, 2010. [10]. C. A. Awosope, "Nigeria electricity industry:
issues, challenges and solutions," Covenant University Public Lecture Series, vol. 3, no. 2, p. 40, 2014.
[11]. J. Ekeh, "Positioning the electric power sector for electricity sufficiency in Nigeria to meet up with Vision 2020" Covenant University Public Lecture Series, vol. 1, no. 19, p. 59, 2008. [12]. C. Bandim, J. Alves Jr., A. Pinto Jr., F. Souza,
M. Loureiro, C. Magalhaes and F. Galvez-Durand, "Identification of energy theft and tampered meters using a central observer meter: a mathematical approach," in IEEE PES Transmission and Distribution Conference and Exposition, Dallas, 2003, pp. 163-168.
[13]. J. Nagi, K. Yap, F. Nagi, S. Tiong, S. Koh and S. Ahmed, "NTL detection of electricity theft and abnormalities," in Proceedings of 2010 IEEE Student Conference on Research and Development (SCOReD 2010), Putrajaya, Malaysia, 2010, pp. 202-206.
http://www.energy.gov.ng/reports.php. [Accessed 29 May 2019].
[15]. J. E. Bala, "Nigeria's power sector reform: what next after privatization?" 12 March 2014. [Online]. Available: http://www.energy.gov.ng/papers.php. [Accessed 27 May 2019].
[16]. International Energy Agency, "Key world energy statistics", 7 April 2019. [Online]. Available:
https://www.iea.org/statistics/?country=NIGE RIA&year=2016&category=Electricity&indicat or=ElecGenByFuel&mode=chart&dataTable=E LECTRICITYANDHEAT. [Accessed 7 April 2019].
[17]. Nigeria Electricity System Operator, "Daily Operational Report", [Online]. Available: https://nsong.org/Library.aspx. [Accessed 26 May 2019].
[18]. T. Ogbonna, "Don’t pay electricity bills if you’re not metered – FG”, Vanguard, 12 June 2017. [Online]. Available: https://www.vanguardngr. com/2017/06/dont-pay-electricity-bills-youre-not-metered-fg/. [Accessed 30 June 2019]. [19]. Z. Zheng, Y. Yang, X. Niu, H.-N. Dai and Y.
Zhou, "Wide and deep convolutional neural networks for electricity-theft detection to secure smart grids," IEEE Transactions on Industrial Informatics, vol. 14, no. 14, pp. 1606-1615, 2018.
[20]. Coleman Cables and Wire, "Aerial cable", [Online]. Available: http://www.colemancables.com/products/cata logue/CTIL_Aerial_Cable_Brochure/AERIAL/AA C/ACSR%20CABLES/. [Accessed 5 July 2019]. [21]. T. Xu and P. C. Taylor, "Voltage control
techniques for electrical distribution networks including distributed generation," in
Proceedings of the 17th World Congress, The International Federation of Automatic Control, Seoul, Korea, 2008, pp. 11967-11971.
[22]. W. H. Kersting, Distribution System Modelling and Analysis, Washington D.C.: CRC Press, 2002.
[23]. N. Mithulananthan, M. M. A. Salama, C. A. Can˜izares and J. Reeve, "Distribution system voltage regulation and var compensation for
different static load models," International Journal of Electrical Engineering Education, vol. 37, no. 4, pp. 384-395, 2000.
[24]. O. Nnodim, "Power distribution network collapsing due to rainfall – TCN”, Punch, 16 June 2019, [Online]. Available: https://punchng.com/power-distribution-network-collapsing-due-to-rainfall-tcn/. [Accessed 6 July 2019].
[25]. J. Odeyemi, "Why we cut off power supply during rainfall, AEDC explains”, Daily Trust, 30 June 2019. [Online]. Available: https://www.dailytrust.com.ng/why-we-cut- off-power-supply-during-rainfall-aedc-explains.html. [Accessed 06 July 2019]. [26]. C. Okafor, "Wealthy, not poor Nigerians stealing
electricity, NERC claims”, Thisday, 20 April 2018, [Online]. Available: https://www.thisdaylive.com/index.php/2018/ 04/20/wealthy-not-poor-nigerians-stealing-electricity-nerc-claims/. [Accessed 7 July 2019].
[27]. R. Czechowski and A. M. Kosek, "The most frequent energy theft techniques and hazards in present power energy consumption: cyber security in smart metering low voltage network," in Joint Workshop on Cyber- Physical Security and Resilience in Smart Grids (CPSR-SG), Vienna, Austria, 2016, pp. 1-7, IEEE. https://doi.org/10.1109/CPSRSG.2016.768409 8
[28]. T. B. Smith, "Electricity theft: a comparative analysis," Energy Policy, vol. 32, no. 18, pp. 2067 – 2076, 2004.
[29]. The Nation, "Electricity theft offenders risk seven year jail term," 12 December 2018. [Online]. Available: https://thenationonlineng.net/electricity-theft-offenders-risk-seven-year-jail-term/.
[Accessed 10 April 2019].