OPTIMIZATION OF SUPERPLASTICIZED CONCRETE USING TAGUCHI
APPROACH: A CASE STUDY OF HYDROPLAST 200
D. E. Ogheneochuko
1,*and O. U. Orie
21, 2,
D
EPARTMENT OFC
IVILE
NGINEERING,
U
NIVERSITY OFB
ENIN,
B
ENINC
ITY, E
DOS
TATE, NIGERIA
E-mail addresses:
1[email protected],
2[email protected]
ABSTRACT
The use of superplasticizers in concrete using Hydroplast 200 to optimize the contents in a mix proportion was investigated using Taguchi Experimental Design method. Concrete cubes and beams were cast and Taguchi L16
orthogonal array was used to analyze it with five factors namely: water cement ratio, cement content, fine Aggregate content, coarse aggregate content and superplasticizer content. Four levels were selected and the properties varied at these levels. The mixtures were tested both in fresh and hardened states and the best proportions determined. At the minimum level of superplasticizer content, compressive strength of 34.84N/mm2 was achieved and at highest level of
superplasticizer considered, compressive strength of 40.5N/mm2 was achieved. The result was in consonance with
the predictions of the Taguchi model for optimized superplasticized concrete indicating that at reduced water cement ratio, a 30% increase in compressive strength and 100% increase in flexural strength can be achieved.
Keywords: Compressive strength, Concrete, Flexural Strength, Hydroplast 200, Optimization, Superplasticizer, Taguchi, Workability.
1. INTRODUCTION
Concrete is the major component of most infrastructural facilities in the modern day society due to its wide area of application. Concrete, being a composite material is composed of cement, fine and coarse aggregates, water and other admixtures. There is the need to investigate how an admixture, in this case, a superplasticizer can be used to improve the properties of a particular concrete mix. The workability, dry density, compressive and flexural strengths can thus be improved at reduced water-cement ratio and at minimum water-cement content for a designed mix.
1.1 Components of Concrete
Aggregates constitute a great volume in concrete, between 70 to 80% and it has great impact on the various characteristics and properties of concrete. While components which are natural materials and can vary to any extent in many of their properties, cement is the only factory made standard component of concrete [1]. Water plays a very important role in concrete as an average of 23% of water by weight of cement has been seen as the estimated as being required for chemical reaction with Portland cement compounds as this 23% of water chemically combines
with cement and it’s thus referred to as bound water. It also helps to form the strength giving cement gel [2]. The presence of deleterious substances in water as well as aggregates has been found to be a causative factor capable of leading to the failure of concrete structures at the construction stage of any project, hence the need to maintain quality in water usage for concrete production as such deleterious materials have been found to cause a reduction in the compressive strength of concrete [3].
1.2 Use of Superplasticizers in Concrete Production Superplasticizers are High Range Water Reducers (HRWR) which forms a new category and improved version of plasticizers. Unlike plasticizers which can only achieve water reduction up to 15%, they permit the reduction of water to the extent of 30% without reducing workability [1]. They were developed for use where the amount of water reducer admixtures required to reach a desired slump or flow resulted in unacceptable reductions of other critical properties [4]. The use of superplasticizers finds its application in the production of flowing, self-leveling, self- compacting and both high strength and high performance concrete [5]. They are more powerful as dispersing agents. Its use has made it possible to use
Vol. 37, No. 3, July 2018, pp.
611 – 618
Copyright© Faculty of Engineering, University of Nigeria, Nsukka,Print ISSN: 0331-8443, Electronic ISSN: 2467-8821
www.nijotech.com
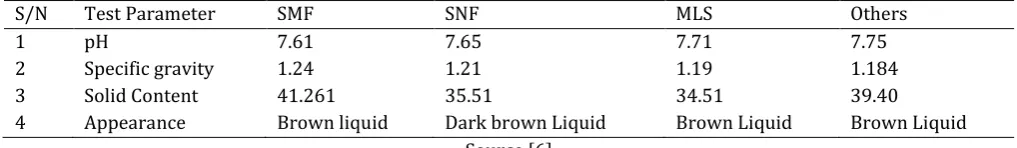
w/c as low as 0.25 or even lower and yet to make flowing concrete to obtain high strength. Superplasticizers are classified into four groups namely: Sulphonated Melanine-formaldehyde condensates (SMF), Sulphonated Naphthalene-formaldehyde condensates (SNF), Modified Lignosulphonates (MLS) and other which include the new generation superplasticizers such as Acrylic polymer based (AP), Copolymer of carboxylic acrylic acid with acrylic ester (CAE), Crossed linked acrylic polymer (CLAP), Polycarboxylate ester (PCE), Multicarboxylatethers (MCE) and any combination of the above [1]. Their properties are shown in Table 1. The dosage of superplasticizers has been investigated to have a significant effect on the properties of concrete. Study was done on the influence of superplasticizers dose of 0.25, 0.3 and 0.35 percentages by weight of cement content on the performance of Self-Compacting Concrete (SCC) containing 10% of fly ash of cement content. The experimental test for fresh and hardened properties of self-compacting concrete for three mixes of M20 Concrete grade were studied and the results compared with normal vibrated concrete. The tests considered for the study were slump test, compaction factor test, unit weight and compressive strength tests. The results showed that for a constant water-cement ratio, increase in superplasticizer dose in SCC leads to gain of good self-compaction ability in addition to marginal reduction of unit weight though with a slight increase in compressive strength than that of normal concrete mix. The study concluded that concrete containing fly ash and superplasticizer yield good workable mix in addition to increase in compressive strength marginally as observed from the slump and compaction factor tests [5].
Several works on the use of superplasticizers revealed that superplasticizers are of great use in concrete industry [6-7].
1.3 Optimization of Concrete Mix
Optimization involves selecting the best from a set of available options. Concrete mix optimization involves the estimation of different concrete compositions with
different combination of aggregate and choosing the best variants of mix by comparing their performance against some desired properties such as economical and mechanical properties as well as durability of the material. Optimization of process parameters is done to have great control over quality, productivity and cost aspects of productivity [8]. Concrete can be optimized when designed as a five component mix in structural engineering even with the use of locally available materials [9].
Study was carried out to optimize the parameters of fly ash geopolymer concrete using Taguchi Orthogonal design to produce concrete that meets the durability requirements in an aggressive environment. The compressive strength, wetting-drying cycle and capillary pores measurement were investigated by measuring the effects of the aggregate content, alkaline solutions/fly ash ratio, ratio of sodium silicate to NaOH and curing condition. For optimization, a three –level factorial experimental design for each parameter was employed. Based on the experimental results, the optimized conditions of fly ash geopolymer concrete mixture for aggressive environment were proposed. It was found out that the curing method was the most important parameter for a durable fly ash geopolyymer concrete from the study of the wetting-drying cycle in 6.54% salt water and oven drying at 80º carried out to investigate geopolymer behaviour in such extreme conditions. [10].
2. MATERIALS AND METHODS
Taguchi’s method was used as it is a simplistic approach, reduces the number of experiments to be carried out to minimum and use a simple graph; Signal to Noise and Response Table.
The Taguchi’s method helps to reduce the number of trials by design of experiments and it is feasible to study the effect and factors and other interactions. As against the number of possible trial for P parameters at L Level as per factorial method design being:
( ) Where L is the number of levels, and P is the number of factors involved.
Table 1: Properties of Superplasticizers
S/N Test Parameter SMF SNF MLS Others
1 pH 7.61 7.65 7.71 7.75
2 Specific gravity 1.24 1.21 1.19 1.184
3 Solid Content 41.261 35.51 34.51 39.40
But with Orthogonal Array, minimum number of trials for combination is given by:
Number of parameters X (number of levels – 1)
( ) ( ) Thus, for 4 parameters at 3 levels,
( ) ( )
2.1 Taguchi Signal – to- Noise Ratio (S/N)
The S/N measures the level of performance and the effect of noise factors on performance and it is an evaluation of the stability of performance of an output characteristic. It is simply a performance characteristic instead of the average value to interpret the trial result. A noise level is described as anything that causes a measurable product or process characteristics to deviate from its target value.
There are three major categories of performance characteristics for evaluating the performance of parameters. They are:
a. Smaller – the – Better: This is chosen when the goal is to minimize the response.
S/N = log ( ∑ ) ( )
Larger – the – Better: This is chosen when the goal is to maximize the response.
log ∑ ( )
Norminal – the – Better:
log ∑ ( ) ( )
Where Yi is the performance value of the ith trial, Yo is
the mean of the experimental data and n is the number of repetitions for an experimental combination.
The approach is to select the best combination of control parameters so that the product or process is the most robust with respect to noise factors. It utilizes Orthogonal Array (OA) from Design of Experiment theory to study a large number of variables with a small number of experiments. An orthogonal array significantly reduces the number of experimental configurations to be studied. Also, conclusions drawn from small-scale experiments are valid over the entire experimental region spanned by the factors and their
settings and the conclusion drawn from such experiments are valid over the entire span.
2.2 Taguchi Experimental Program
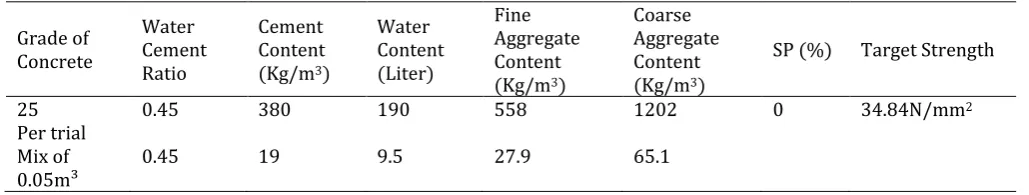
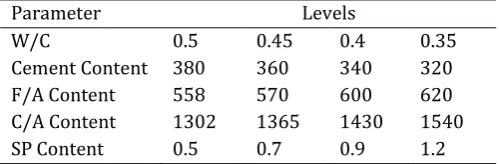
An experimental program was designed to determine the optimum mix proportions of concrete with minimum cement content. For this purpose, the design of experiments based on Taguchi method was formulated considering five parameters; water cement ratio, cement content, fine aggregate content, coarse aggregate content and superplasticizer content at four levels. Trial mix was carried out for control mix before carrying out experimentation using Taguchi OA as shown in Table 2.
Using the results obtained from control mix parameters and levels decided, the chosen parameters were varied around these control mixes on the basis of literature review and past experiences. Levels of water to cement ratio (w/c) and cement content were reduced while level of superplasticizer, coarse and fine aggregate contents were increased.
The experiment which was carried out using 150mm x 150mm x 150mm cubes and 100mm x 100mm x 500mm beams were used in accordance to BS 1881-108 to evaluate the influence of the various mix parameters and thereby to optimize the cement content in concrete.
2.3 Materials
Cement: 42.5 grade Ordinary Portland Cement (OPC) manufactured by Dangote Cement Company conforming to BS 12 was used.
Coarse Aggregate: Crushed granite obtained from local crushing unit with 20mm as maximum size conforming to BS 882 was used.
Fine Aggregate: Okhuahe River Sand consisting of quartzite with grading and properties conforming to BS 882 was used.
Water: Potable water free from contaminants was used as specified by BS 3148
Table 2.1: Mix Design for Control Mixes
Grade of Concrete
Water Cement Ratio
Cement Content (Kg/m3)
Water Content (Liter)
Fine Aggregate Content (Kg/m3)
Coarse Aggregate Content (Kg/m3)
SP (%) Target Strength
25 0.45 380 190 558 1202 0 34.84N/mm2
Per trial Mix of 0.05m³
Hydroplast 200: A High Range Water Reducing Admixture available in 20kg pails and 200liters or 200kg drums conforming to BS 5075 Part 3 was used. This superplasticizer is compatible with all types of Portland cement including Sulfate Resisting cement, increases early and ultimate compressive strength, improves cohesion, reduces risk of segregation, reduces porosity, improves waterproofing and durability.
2.4 Methods
2.4.1 Workability
The workability of the superplasticized concrete was determined using Slump test and Compacting Factor test conforming to BS 1881-102 since it is suitable for the analysis.
2.4.2 Dry Density
This is the dry mass of soil per unit volume. The dry density is usually expressed as either g/cm3 or Kg/m3,
it is a measure of its unit weight and is determined by determining the density of the materials that go into it. The test for dry density was carried out in accordance with BS 1881-114 after some preliminary tests for finesss, specific gravity, absorption and aggregate crushing values were carried out on the natural aggregates in accordance with BBS 882.
2.4.3 Compressive Strength
Grade 25 concrete was cast using cube sizes of 150mm X 150mm X 150mm at varied quantities of composites conforming to BS 8110 and BS 1881-108. For the given parameters and levels, 68 cubes were cast. Demoulding was done after 24 hours thereafter the samples were transferred to curing tank maintained at room temperature. The cubes were tested for compressive strength on removal from the curing tank at 28 days at curing age of 27 days using compression machine and the strength determined from:
c ( )
Where Fc is the compressive strength, P is the maximum load and A, the cross sectional area. The average of the compressive strength was taken as the compressive strength at that age.
2.4.4 Flexural Strength
Concrete sample beams measuring 100mm x 100mm x 500mm were cast from the predetermined mixes using moulds in accordance with BS 1881, Parts 116 and 118 and the samples tested at maturity and their flexural
parameters and respective levels are as shown in Table 3.
Table 3: Parameters and their variation levels
Parameter Levels
W/C 0.5 0.45 0.4 0.35
Cement Content 380 360 340 320
F/A Content 558 570 600 620
C/A Content 1302 1365 1430 1540
SP Content 0.5 0.7 0.9 1.2
3. RESULT AND ANALYSIS OF RESULT
In Figure 3.1, cement content is the most influencing factor on the Dry Density of superplasticized concrete. This is due to the fact that it has the highest rank compared to the other properties. Change in the quantity of cement content caused significant change in the dry density. The second most influencing factor is water-cement ratio. The least contributing factor is coarse aggregate content. This is as shown in Table 5. An optimal condition for minimum dry density is obtained at 0.45 w/c, 360Kg cement content, 448kg F/A, 1302Kg C/A and 0.9% SP which is in the linear equation:
. ( ) Where A is the water cement ratio, B is the cement content, C, the Fine Aggregate content, D, the Coarse aggregate content and E, the Superplasticizer content. The above equation implies that when 360Kg of cement is combined with 448kg of F/A, 1302Kg C/A and 0.9% SP with a water cement ratio of 0.45 for a 1:2:4 mix, a dry density of 2451.4Kg/m3 would be
achieved.
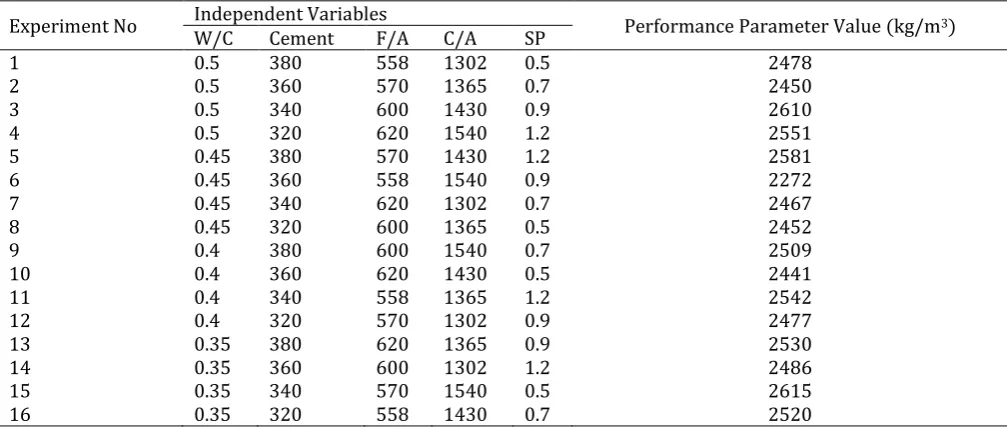
Table 4 shows the experimental result obtained from the combination of the various components of concrete at the specified levels. The water-cement ratio was decreased gradually while the other components were also varied using the L16 orthogonal array experimental
design method.
Table 5 is from the L16 orthogonal array for Dry
Density, all the values got with the combination of water-cement values at 0.5 are summed up and the average is determined. Experiments Numbers 1, 2, 3, and 4 contains a combination of 0.5 w/c, the average is thus represented in the response tables as 2522 and the values plotted on the main effect curve. Same is done for the other values of water cement ratio down till 0.35 and the average got.
The main effect plot is shown in Fig. 1 for each parameter at their various levels, the values of the signal to nose ratio is plotted against the Dry density in kg/m3 where A represents water-cement ratio; B,
cement content; C Fine Aggregate content, D Coarse Aggregate content and E Superplasticizer content.
In Table 7, cement content is the most influencing factor on the 28 Days Compressive Strength of Superplasticized concrete. The second most influencing factor is water-cement ratio. The main effect plot is shown in Figure 2.
Table 4: Standard L16 Orthogonal Array for Dry Density
Experiment No Independent Variables Performance Parameter Value (kg/m3)
W/C Cement F/A C/A SP
1 0.5 380 558 1302 0.5 2478
2 0.5 360 570 1365 0.7 2450
3 0.5 340 600 1430 0.9 2610
4 0.5 320 620 1540 1.2 2551
5 0.45 380 570 1430 1.2 2581
6 0.45 360 558 1540 0.9 2272
7 0.45 340 620 1302 0.7 2467
8 0.45 320 600 1365 0.5 2452
9 0.4 380 600 1540 0.7 2509
10 0.4 360 620 1430 0.5 2441
11 0.4 340 558 1365 1.2 2542
12 0.4 320 570 1302 0.9 2477
13 0.35 380 620 1365 0.9 2530
14 0.35 360 600 1302 1.2 2486
15 0.35 340 570 1540 0.5 2615
16 0.35 320 558 1430 0.7 2520
Table 5 Response Table for S/N Ratio for Dry Density of SP Concrete
Levels Grade 25
A B C D E
1 2522 2525 2453 2477 2496
2 2443 2412 2531 2494 2486
3 2492 2559 2514 2538 2472
4 2538 2500 2497 2487 2540
Delta(∆) 95 147 78 61 68
Rank 2 1 3 5 4
The least contributing factor is coarse aggregate content. This is as shown in Table 6 in which all the performance values where 0.5 water cement ratio were used are computed and the average value determined, same is done for values of 0.45 water cement ratio up till 0.35 water cement ratio and for all other variables. An optimal condition for maximum compressive strength is obtained at 0.35 w/c, 320Kg cement
content, 600Kg F/A, 1302Kg C/A and 0.5 % SP which is in the linear equation:
. ( )
In Table 10, water-cement ratio is the most influencing factor on the Flexural Strength of Superplasticized concrete. The second most influencing factor is SP content. The least contributing factor is coarse aggregate content.
Table 6: Standard L16 Orthogonal Array for 28 Days Compressive Strength
Experiment No Independent Variables Performance Parameter Value (N/mm2)
W/C Cement F/A C/A SP
1 0.5 380 558 1302 0.5 38.3
2 0.5 360 570 1365 0.7 38.5
3 0.5 340 600 1430 0.9 38.4
4 0.5 320 620 1540 1.2 38.5
5 0.45 380 570 1430 1.2 37.5
6 0.45 360 558 1540 0.9 37.45
7 0.45 340 620 1302 0.7 37.60
8 0.45 320 600 1365 0.5 38.50
9 0.4 380 600 1540 0.7 38.90
10 0.4 360 620 1430 0.5 37.40
11 0.4 340 558 1365 1.2 39.80
12 0.4 320 570 1302 0.9 40.10
13 0.35 380 620 1365 0.9 39.60
14 0.35 360 600 1302 1.2 40.50
15 0.35 340 570 1540 0.5 38.70
6 0.35 320 558 1430 0.7 40.20
Table 7: Response Table for S/N Ratio for 28 Days Compressive Strength of SP Concrete
Levels Grade 25
A B C D E
1 38.43 38.58 38.94 39.13 38.23
2 37.76 38.46 38.70 39.10 38.80
3 39.05 36.63 39.08 38.38 38.89
4 39.75 39.1 38.28 38.39 39.08
Delta(∆) 1.99 2.47 0.8 0.75 0.85
Rank 2 1 4 5 3
This is as shown in Table 10. An optimal condition for maximum flexural strength is obtained at 0.35 w/c, 320Kg cement content, 600Kg F/A, 1365Kg C/A and 0.5 and/or 0.5% SP which is in the linear equation:
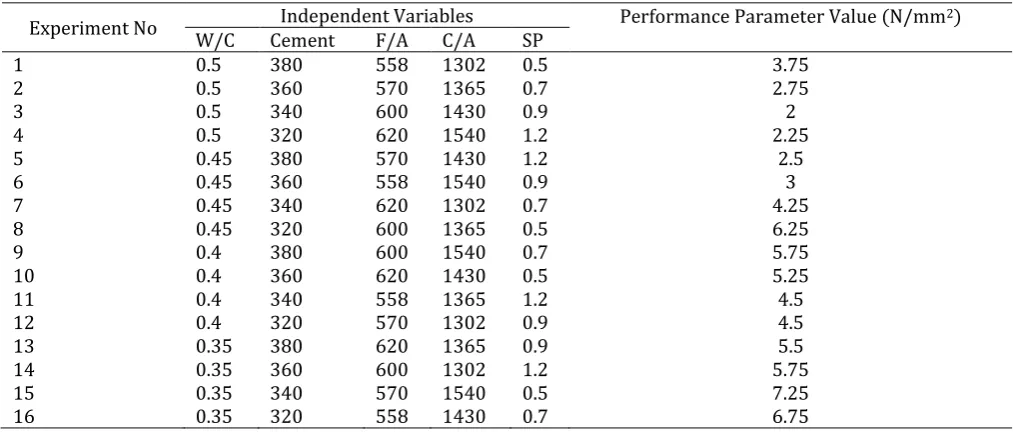
. ( ) Figure 3 shows the plot of flexural strength against the various values of the different parameters; water
cement ratio, cement content, fine aggregate content, coarse aggregate content and superplasticizer content. From the L16 orthogonal array for flexural strength, all
the performance values where 0.5 water cement ratio were used are computed and the average value determined. Same is done for values of 0.45 water cement ratio up till 0.35 water cement ratio.
Table 9: Standard L16 Orthogonal Array for Flexural Strength
Experiment No Independent Variables Performance Parameter Value (N/mm2)
W/C Cement F/A C/A SP
1 0.5 380 558 1302 0.5 3.75
2 0.5 360 570 1365 0.7 2.75
3 0.5 340 600 1430 0.9 2
4 0.5 320 620 1540 1.2 2.25
5 0.45 380 570 1430 1.2 2.5
6 0.45 360 558 1540 0.9 3
7 0.45 340 620 1302 0.7 4.25
8 0.45 320 600 1365 0.5 6.25
9 0.4 380 600 1540 0.7 5.75
10 0.4 360 620 1430 0.5 5.25
11 0.4 340 558 1365 1.2 4.5
12 0.4 320 570 1302 0.9 4.5
13 0.35 380 620 1365 0.9 5.5
14 0.35 360 600 1302 1.2 5.75
15 0.35 340 570 1540 0.5 7.25
16 0.35 320 558 1430 0.7 6.75
Table 10: Response Table for S/N Ratio for Flexural Strength of SP Concrete
Levels Grade 25
A B C D E
1 3.38 4.38 4.50 4.69 5.63
2 4.00 4.31 4.25 4.75 4.88
3 5.00 4.49 4.94 4.13 3.75
4 6.31 5.19 4.44 4.56 3.88
Delta(∆) 2.93 0.88 0.69 0.62 1.88
Rank 1 3 4 5 2
Similarly, the performance parameters of all values for cement content as shown in the response table is plotted for each level as summarized in Table 10. At 0.5 w/c, a value of 3.38 N/mm2 was obtained as seen
in the graph. At 0.45 w/c, a value of 40 N/mm2 was
obtained down to w/c of 0.35 where 6.31 N/mm2 was
obtained.
The same is repeated for the various compartments of the graph for cement content, fine aggregate content, coarse aggregate content and superplasticizer content respectively.
The highest points on the graph represent the optimum value for each parameter. Thus, the optimum for flexural strength is obtained at 0.35 w/c (A4), 320 Kg
cement content (B4), 600 Kg of Fine Aggregate (C3),
1365 Kg of Coarse Aggregate (D2) and 0.5% of
superplasticizer content (E1).
4. CONCLUSION
The study showed that the most influencing factors affecting the compressive and flexural strengths are water-cement ratio, cement content and superplasticizer content while the least influencing factor for compressive strength both at 7 and 28 days as well as for Flexural strength is Coarse Aggregate content.
The most influencing factor is as seen in the Response Table for 28 days Compressive Strength, is cement content because the change in the value of the performance parameters changed significantly when the quantity of cement was altered at 340kg of cement the compressive of 36.6339.1N/mm2 was obtained
while at 320kg of cement, a compressive strength of 39.1N/mm2 was achieved giving a difference of 2.47
(∆) which is the largest difference observed at various changes in the various parameters. The parameter which gives the highest difference between the smallest and largest performance values is termed the most influencing factor while the one which gives the least difference is the least influencing factor as any change in the quantity of the factor does not significantly alter the performance value.
5. REFERENCES
[1] Chand, S. and Shetty, M. S. Concrete Technology Theory and Practice, S. Chand and Company Limited, New Delhi, 2010.
[2] Peter, T., aith, B., Ezgi, Y. and Halil, C. “Optimizing Cementitious Content in Concrete Mixtures for Required Performance”. National Concrete Pavement Technology Centre, Iowa University. Final Report, 2012.
[3] Anosike, . M. “Parameters for Good Site Concrete Production Management Practice in igeria”. PhD Thesis, Department of Building Technology, Covenant University, Ota, Nigeria, 2011.
[4] Nawy, E. G. Concrete Construction Engineering Handbook. CRC Press, Taylor & Francis Group, New York, 2008.
[5] Dumne, . M. “Effect of uperplasticizer on resh and Hardened Properties of Self-Compacting Concrete Containing ly Ash”. American Journal of Engineering Research. Vol. 3, Issue 3, pp 205 – 211, 2014.
[6] Malagavelli, V. and Patune, . R. “Strength and Workability Characteristics of Concrete by Using Different uperplastizers”. International Journal of Materials Engineering. Vol 2, No 1, pp 7 – 11, 2012.
[7] Plank, J., Schreofl, C., Gruber, M., Lesti, M. and eiber, R. “Effectiveness of Polycarboxylate Superplasticizers in Ultra High Strength Concrete: The Importance of PCE Compatibility with Silica ume”. Journal of Advanced Concrete Technology. Vol. 7, No 1, pp 5 – 12, 2009.
[8] Elvis, M. M and Osadebe, . . “ ive Component Concrete Mix Optimization of Aluminium Waste Using heffe’s Theory”. International Journal of Computational Engineering Research. Vol. 4, Issue 4, pp 23-31, 2014.
[9] Orie, O. U. and Osadebe, . . “Optimization of the Compressive Strength of Five-Component Concrete Mix Using cheffe’s Theory – A Case tudy of Mound oil Concrete”. National Journal of Mathematical Physics, Vol 14, pp 375 – 382, 2009.
[10] Olivia, M. and ikaz, H. “Optimization of ly Ash Geopolymer Concrete Mixtures in a Seawater Environment”. The 24th Biennial Conference of the