Vol.8 (2018) No. 4-2
ISSN: 2088-5334
Usability of ReSt Module Using Four-Step Approach Based on Case
Study Example and Infographic for SPSS Novice Users
Azura Ishak
#, Rosseni Din
*, Hazura Mohamed
# #Faculty of Information Science and Technology, National University of Malaysia, Bangi, 43600, Malaysia E-mail: [email protected], [email protected]
* Faculty of Education, National University of Malaysia, Bangi, 43600, Malaysia E-mail: [email protected]
Abstract
— The application of analysis data software packages, such as SPSS, appears challenging for those who lack experience in
quantitative researches particularly amongst novice users. Prior studies have proven that SPSS novice users face some difficulties in analyzing data correctly for their research purposes. The existing modules that serve as references are insufficiently interesting to promote SPSS learning and does not support on students’ cognitive ability. Hence, a module using four-step approach based on learning via case study example and infographic called ‘ReSt’ module was developed as an effort to assist novice users in learning quantitative data analysis methods using the SPSS. With that, the research design employed in this study was the survey method in order to determine the ReSt module usability level perception. A total of 78 novice users who comprised of undergraduate and postgraduate students participated in this research throughout a two-day SPSS basic course in order to evaluate their perception regarding the usability level of the module. A usability questionnaire categorized four primary domains, which are usefulness, ease of use, ease of learning, and satisfaction was applied to evaluate the ReSt module usability level perception. The outcomes revealed that the usability level of the proposed module had been high among the novice users, for the contexts of usefulness, ease of use, ease of learning, and satisfaction. Therefore, the use of the ReSt module for SPSS novice users is indeed relevant and appropriate, thus fulfill the usability amongst novice users to function as a reference in data analysis learning using the SPSS, especially amongst core quantitative researchers.
Keywords — usability; example-based leaning; infographic; SPSS; novice.
I. INTRODUCTION
A statistical package refers to a software program designed for specific purposes of manipulating, analyzing, and presenting data [1]. A common example of such statistical software package is the IBM SPSS Statistics [2], which is widely termed as ‘SPSS’. The ability to use the applications embedded in the statistical packages is an essential quantitative research skill that substantially assist researchers to engage meaningfully in modern statistical practice [3]. Hence, avoiding error in analyzing data is important because it can lead to invalid survey outcomes. Furthermore, inability to produce the right analysis can negatively affect the quality of a research [4] especially among novice user. According to Yin et al., statistical analysis for quantitative study is often perceived to be the most difficult step by a novice researcher [5]. Novices or beginner are individuals with limited or no experience in situational characteristics of their domain [6]. Therefore, the
SPSS reference material is required by novice users to guide them in overcoming errors.
Learning materials that serve as guidelines are important to address their problems related to statistical analysis. Many universities do provide statistical consulting courses or modules to support the development of their graduates ([7],[8]). Module resemble course material (subject, training and others) implemented distinctively to achieve some skill [9]. Nevertheless, most of the existing references related to quantitative analysis and statistical data are frightening to many students, wherein SPSS reference materials should be more easily understood [10]. There are also some SPSS references are way too brief and disservice their function as a guideline [11]. The reason is that, learning material does not fit the target user. According to Yusof et al., most of the learning materials does not support on students’ cognitive ability[12].
users. Usability is just one aspect of many that impact user-experience [13], which it gives info how user using the product to fulfil their needs [14] and it becomes an important indicator to measure the interactivity of an IT system or product [15].
According to International Organization for Standardization (ISO) 9241 [16], usability is defined as the degree to which a particular product is used by particular users to accomplish specific goal with efficiency, effectiveness and satisfaction and a precise standpoint used. It determines how far a product can be used to achieve goals in terms of effectiveness, efficiency, and user satisfaction [17]. The aspect of usability ascertains if a product produced can ensure the success or failure of a product. A great and fully functional product is considered as failure if users have issues or find a product useless [18] and may cause dissatisfaction for users to complete their tasks [19].
Usability can be measured by four domains such as usefulness, ease of use, ease of learning and satisfaction [20]. Usefulness relates with a person believes that using a particular product would enhance his or her job performance [21]. Ease of use is defined as a person believes that using particular product would be free from effort [21], while ease of learning is defined as in order for the user to quickly get on with his or her work [22]. Satisfaction relates to the judgment that a product or service features itself is providing a pleasurable level of fulfillment [23].
An effective module production that applies the appropriate learning approach to the target novice students can give a great impact on the teaching and learning process [24]. Real-world learning opportunities allow students to gain hands-on experience linking knowledge with action for practical competence [25]. In this sense, the example-based learning or worked example is an easy-to-understand method as it hinders students from finding irrelevant information, but helping them to concentrate on studying the available problem-solving steps, which in turn, could support them to build a long-term problem-solving scheme [26]. In fact, this method benefits novice users as this strategy facilitates the acquisition of the scheme and reduces cognitive burden [27]. According to Sun et al. [28], a module that can reduce the cognitive burden of students is indispensable in the teaching and learning process.
Infographics also help to extend attention span, reduce cognitive burden, offer fun artifacts, and stimulate the process of teaching and learning [29]. Al-Mohammadi discovered that the infographics approach was effective in teaching Basic Programming to high school students in Saudi Arabia [30]. The presentation of infographic information that allows intricate information to be processed in a simple manner [31] appears to be one of the most effective strategies to help and to improve learning process. Infographics use simple sentences and images that ease reading and offer an interesting visual summary [32].
Therefore, the ReSt module, which is the abbreviation to ‘Research and Statistics’, was developed in an effort to help and to fulfil the usability amongst novice users to enrich their knowledge regarding quantitative data analysis, especially by using SPSS. The module adopted the four-step approach to integrate the example-based method for the case study theme in order to provide exposure to students in
analyzing data within the real-world research environment. The presentation of the infographic-based module also can stimulate its users to learn in a more interesting manner.
With that, the ReSt module adopted the four-step approach based on case study and infographics to serve as a helpful guide and reference to assist novice users comprehend and learn SPSS. Nonetheless, in order to verify that the module is indeed suitable for the target users, the usability of ReSt module for novice user had been determined in this study. With the usability evaluation, we can understand whether the system or product is effective, efficient, and how satisfied the users are when they use it [33]. Hence, this study explored if the ReSt module assisted the novice users in using SPSS to analyze data via usability test.
II. MATERIAL AND METHOD
A. Description of The ReSt Module
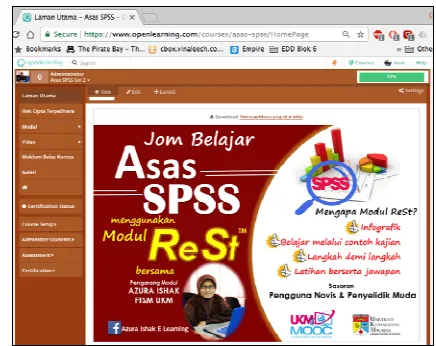
ReSt refers to short form of Research and Statistics due to both of these two concept are important to learn SPSS. This module was developed in the Malay version for SPSS beginners or novice user targets to help them analyze data using SPSS within their research context. ReSt module can be accessed through Massive Open Online Course (MOOC)
for novice user through the url
https://www.openlearning.com/courses/asas-spss as shown in Fig. 1.
Fig. 1 MOOC Interface of ReSt module
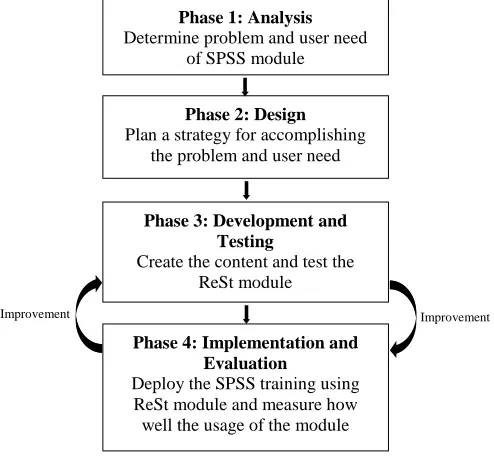
1) Instructional Design Model: ReSt module, which aids
in the learning of SPSS data analysis, had been developed by combining two instructional design models; ADDIE and Waterfall. The two models were simplified with their own strengths as ADDIE reflects a systematic model that can provide a framework guide to develop effective educational products or learning resources that is easy-to-follow [34], while the Waterfall model is very easy to comprehend and use [35]. This combined model is called ADWa model, as illustrated in Fig. 2.
accomplishing the problem and user need based on initial analysis in phase one. Then on phase three, the module is developed and tested by expert and novice user. In the last phase, the implementation through SPSS training using ReSt module is done by deploy the SPSS and the evaluation to measure how well the usage of the module.
Fig. 2 ADWa Instructional Design Model
2) Parts in ReSt Module: The module is composed of
four series, beginning from module one that covers the basic concept of research process, and followed by basic analyses of descriptive and inferential statistics based on three case study instances, each one in modules two until four, as shown in Table 1. The inferential statistics introduced in the module refers to Pearson correlation and independent t-test in module two; ANOVA and simple linear regression in module three; as well as paired t-test and independent chi square in module four.
TABLEI
THE FOUR SERIES OF REST MODULE
Series Content
Module 1: Statistics and Research Research Process Importance of determining the research process prior to data analyses using SPSS
Module 2: Case Study Example 1 Descriptive
Pearson correlation Independent t-test
Module 3: Case Study Example 2 Descriptive
ANOVA
Simple Linear Regression
Module 4: Case Study Example 3 Descriptive
Paired t-test
Independent Chi Square
3) Four-Step Approach in ReSt Module: The four-step
approach comprised of simple achronim ‘Jom Semak OPIS’, ‘Jom Buat KoMTO’, ‘Jom Uji KeK’, and ‘Jom Buat A&L’. The use of acronyms is a strategy used to better facilitate the novice students in remembering the data analysis process using SPSS accurately
.
The four steps are meant to guide students in analyzing data step-by-step based on a viable research process, starting from designing a study until report the findings of the study as shown in Table 2. ‘Jom Semak OPIS’ is about designing a study, ‘Jom Buat KoMTO’ is about preparing data, ‘Jom Uji KeK’ is about test assumption and measurement tools, while ‘Jom Buat A&L’ is about data analyses. This four-step approach is a systematic guide for data analyses using SPSS among novice users so that their research questions gain valid answers. The four-step approach with example learning-based instances gives exposure to students to analyze data in the real-world research environment based on specific case study themes.TABLEII THE FOUR-STEP APPROACH
Steps Description
Step 1: ‘Jom Semak OPIS’ Objective (Objektif) Variables (Pemboleh Ubah) Instruments (Instrumen) Statistics Test (Ujian Statistik) Step 2: ‘Jom Buat
KoMTO’
Data Code (Kod Data) Data Entering (Masuk Data) Data Screening (Tapis Data) Data Organization (Organisasi
Data)
Step 3: ‘Jom Uji KeK’ Data Normality (Kenormalan
Data)
Instrument Reliability (Kebolehpercayaan Instrumen) Step 4: ‘Jom Buat A&L’ Data Analysing (Analisis Data)
Finding Report (Laporan Hasil
Kajian)
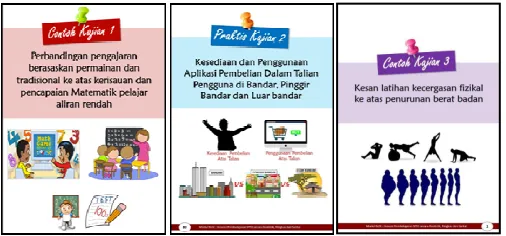
4) Case Study Example: The ReSt module integrated the
case study example as shown in Table 3 and Fig. 3 to give exposure to students about analysing data in a realistic situation according to example-based learning approach. The example-based learning reflects a problem-solving model that consists of three components: problem statement, problem-solving, and final solution for the problem [36]. The example-based learning approach helps students to find relevant information via problem-solving steps to build problem-solving schemes [37] in no time [38].
TABLEIII CASE STUDY EXAMPLE
Case Study Title
Example 1 Comparison between game and
traditional-based teaching on Mathematics anxiety and achievement
Example 2 Stress and job satisfaction among government, private sector, and self-employed
Example 3 The effect of physical fitness on body weight Phase 1: Analysis
Determine problem and user need of SPSS module
Phase 2: Design Plan a strategy for accomplishing
the problem and user need
Phase 3: Development and Testing
Create the content and test the ReSt module
Phase 4: Implementation and Evaluation
Deploy the SPSS training using ReSt module and measure how
well the usage of the module
Fig. 3 Main page of case study example
5) Infographic: The presentation of ReSt module is based
on infographic to effectively stimulate students’ learning, as shown in Fig. 4. Infographics consists of many visual components, such as pictures, drawings, diagrams, symbols, graphics, and texts, which can be used separately or merged for the purpose of conveying information. Innovations brought through infographics are the use of visual components to deliver information and have a unique way of building content [39]. Infographics facilitates learning and may be used for the purpose of teaching fundamental information of a course, to convey new information or to verify the existing information [40].
Fig. 4 Infographic presentation of ReSt module
B. Research Methodology
The survey method was adopted as the research design of this study in order to determine the usability level perception towards ReSt module. In this study, total of 78 novice users had been selected via purposive sampling method and they consisted of undergraduate and postgraduate students. Purposive sampling is a way of getting the best information by selecting respondents who are most likely to have the experience to provide quality information and valuable insights on this research [41]. A sample size as small as five is appropriate for usability testing within a fairly homogeneous group of participants because a higher number of users tends to generate duplicate information [42].
The module usability questionnaire had been based on the USE's instrument proposed by Lund [19]. The actual questionnaire which consisted 30 items categorized four
primary domains, which are usefulness, ease of use, ease of learning, and satisfaction. Permission was sought to use, modify, and translate the items found in USE's questionnaire to suit the ReSt module.
The suitability of this questionnaire was reviewed based on experts’ view, while the consistency and reliability of the questionnaire was then performed on the pilot study. The pilot study was conducted before carrying out the widespread distribution of the questionnaire in order to make final modifications to the instrument and to verify that the questionnaire possesses acceptable reliability and validity.
The Cronbach’s alpha coefficient were calculated for all subsclales. As shown in Table 4, all of the values were above 0.7 which implies that the survey instrument (questionnaire) is a reliable tool with which to consistently measure all the constructs [43]. Moreover, all the measures of the constructs had been used in prior studies, and have thus been validate.
The revised usability questionnaires which consisted of 27 items with five point likert scale starting from the lowest range 1 usually means strongly disagree until the highest 5 means strongly agree. The questionnaires were disseminated to the novice users ini actual study after they attempted using the ReSt module throughout a two-day SPSS basic course in order to evaluate their perception regarding the usability level of the module.
TABLEIV CRONBACH’S ALPHA VALUE
Domain Number
of Item
Cronbach’s Alpha
1. Usefulness 6 0.796
2. Ease of Use 10 0.921
3. Easy of learning 4 0.884
4. Satisfaction 7 0.979
Overall Usability 27 0.959
III.RESULT AND DISCUSSION
The aspect of usability for the ReSt module had been evaluated in terms of usefulness, ease of use, ease of learning, and satisfaction. The outcomes of the ReSt module usability had been based onthe interpretation 5 categories which were rescaled as follows: 1.00 -2.33 (low), 2.34 – 3.66 (moderate), and 3.67 – 5.00 (high) ([44],[45]). The findings showed that all items successfully obtained mean scores exceeding 4.0 (out of 5.0), which reflect high levels, for the contexts of usefulness, ease of use, ease of learning, and satisfaction, as given in Table 5 - 8.
A. Usefulness
TABLEV
REST MODULE USEFULNESS MEAN AND LEVEL BASED ON ITEM
Item Statement N Mean and
Level USEFULNESS
1. This module helps me be more effective.
78 4.69 (High)
2. This module is very useful. 78 4.82 (High)
3. This module makes the
things I want to accomplish easier to get done.
78 4.65 (High)
4. This module saves me time when I use it.
78 4.60 (High)
5. This module meets my needs. 78 4.65 (High)
6. This module can do
everything I would expect it to do.
78 4.49 (High)
B. Ease of Use
The ReSt module also is high in ease of use as shown in Table 6, thus users believes that using the product would be free from effort [21]. The reason is that the ReSt module is easy to use, non-intricate, user-friendly, offers easy steps, easy to customize, comprehensible, dismisses verbal instructions, suitable for all types of users, and rectifies mistakes quickly. SPSS novice.
TABLEVI
REST MODULE EASE OF USE MEAN AND LEVEL BASED ON ITEM
Item Statement N Mean and
Level
EASE OF USE
1. This module is easy to use. 78 4.65 (High)
2. This module is simple to use. 78 4.64 (High)
3. This module is user-friendly. 78 4.62 (High)
4. This module provides some
easy steps to complete the things I wanted to do
78 4.74 (High)
5. This module is flexible. 78 4.60 (High)
6. Using this module is effortless.
78 4.59 (High)
7. I can use this module without written instructions.
78 4.19 (High)
8. All types of users would like this module.
78 4.45 (High)
9. I can recover from mistakes quickly and easily.
78 4.28 (High)
10. I can use this module successfully every time.
78 4.31 (High)
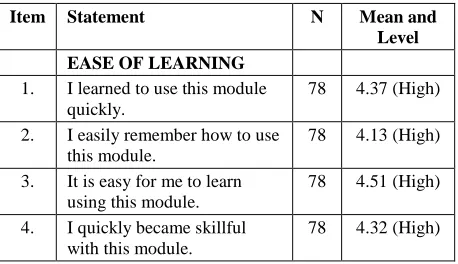
C. Ease of Learning
The ReSt module is high in ease of learning as shown in Table 7, in order for the user to quickly get on their work [22]. The module helps users within the context of ease of
learning, such as users can learn quickly, easily remember how to use the module, easy to study using the module, and quickly become proficient after using this module.
TABLEVII
REST MODULE EASE OF LEARNING MEAN AND LEVEL BASED ON ITEM
Item Statement N Mean and
Level EASE OF LEARNING
1. I learned to use this module quickly.
78 4.37 (High)
2. I easily remember how to use this module.
78 4.13 (High)
3. It is easy for me to learn using this module.
78 4.51 (High)
4. I quickly became skillful with this module.
78 4.32 (High)
D. Satisfaction
The ReSt module meets highly user satisfaction as shown in Table 8, regarding of the product itself is providing a pleasurable level of fulfillment [23]. The users are very satisfied with the module, would not hesitate recommending the module to their friends, enjoy using the module, fulfill their demands, think that it is an amazing module, want to own this module, and use this module with ultimate ease.
TABLEVIII
REST MODULE SATISFACTION MEAN AND LEVEL BASED ON ITEM
Item Statement N Mean and
Level SATISFACTION
1. I am very satisfied using this module.
78 4.69 (High)
2. I will recommend this module to my friends.
78 4.78 (High)
3. I enjoy using this module. 78 4.77 (High)
4. This module works as I want. 78 4.64 (High)
5. This module is amazing. 78 4.62 (High)
6. I feel I need to have this module.
78 4.77 (High)
7. This module is pleasant to use.
78 4.73 (High)
This shows that the overall usability of the ReSt module is high among the novice users. As such, it can be concluded that the use of ReSt module in SPSS course is highly beneficial for novice users as the module design weighed in the novice level cognitive ability. The ReSt module adopted the four-step approach based on case study examples and infographic presentation to draw the students’ attention and to provide them an authentic learning experience in quantitative data analysis approach via SPSS.
IV.CONCLUSION
comprehensive research constellation with simple and attractive presentation format. The module was designed according to novice-level cognitive ability so as to ease data analyses using SPSS.
The implementation of four-step approach is also supported by the disclosure of case study instances synonymous with real-world research environment. According to Brundiers et al. [25], real-world learning opportunities allow students to gain hands-on experience to link knowledge with action for practical competence.
According to Wittwer and Renkl [26], the main advantage of example-based learning is to hinder students from irrelevant information-seeking processes and to help them to concentrate on studying the problem-solving steps provided, thereby supporting them to build a problem-solving scheme in long-term memory.
The use of infographics allows users to summarize the teaching process and to enhance students’ learning process [46]. The incorporation of example-based case studies and infographic modules serve as a guide to perform data analysis learning by using software package for novice students. This ascertains high usability of the ReSt module, especially with integration of case studies and infographic for novice users. Therefore, the use of the ReSt module for SPSS novice users is indeed relevant and appropriate, thus fulfill the usability amongst novice users to function as a reference in data analysis learning using the SPSS. As supported by studies done by Azizul & Din [47], Bataineh, Mashakbh & Din [48] and Din et al. [49], quality content containing good visuals contributes significantly towards good outcome to achieve meaningful learning.
ACKNOWLEDGMENT
The financial support of Center of Research and Instrumentation (CRIM) and Faculty of Information Science and Technology, National University of Malaysia is acknowledged. We also thank the anonymous reviewers for their useful comments.
REFERENCES
[1] B. Chance, D. Ben-Zvi, J. B. Garfield, and E. Medina, “The role of technology in improving student learning of statistics,” Technology Innovations in Statistics Education, vol. 1, no. 1, 2007.
[2] IBM Corp., IBM SPSS Statistics for Windows, Version 22.0. Armonk, NY: IBM Corp., 2013.
[3] Gould, R., “Statistics and the modern student,” International Statistical Review, vol. 78, no. 2, pp. 297–315, 2010.
[4] Mohd. Mahzan Awang, Abdul Razaq Ahmad & Faridah Mydin Kutty, Tahap Kemahiran Pelajar Pascasiswazah Dalam Penyelidikan Pendidikan dan Sains Sosial, Inovasi Dalam Pengajaran dan Pembelajaran: Kajian Kes IPT di Malaysia, Bangi, 2016.
[5] L. K. Yin, T. C. Lieng, and W. K. Cheong, “Research Notes How To Analyse Your Research Data ? Illustrations With Hands-On Exercises Using SPSS,” Online, vol. 1, no. 2, pp. 77–81, 2006. [6] K. G. Ross, J. K. Phillips, G. Klein, & J. Cohn, Creating expertise: A
framework to guide technology-based training. (Final Technical Report for Contract #M67854-04-C-8035 for the Marine Corps Systems Command/Program Manager for Training Systems), Fairborn, OH: Klein Associates, 2005.
[7] D. R. Jeske, S. M. Lesch, and Deng, H., “The merging of statistics education, consulting and research: A case study,” Journal of Statistics Education, vol. 15, no. 3, pp. 1-19, 2007.
[8] R. Taplin, “Enhancing statistical education by using role-plays of consultations,” Journal of the Royal Statistical Society. Series A (Statistics in Society), vol. 170, no. 2, pp. 267– 300, 2007.
[9] Muhammad Asri Madmor, Tee Tze Kiong, Mohamed Nor Azhari Azman, Ridzwan Che Rus, Zaliza Hanapi, Yee Mei Heong, and Mimi Mohaffyza Mohamad, “Mind Map module and the educational achievement of Malaysian basic vocational students : An impact study,” Geogr. OnlineTM Malaysian J. Soc., vol. 12, no. 3, pp. 139– 144, 2016.
[10] P. Connolly, “Quantitative data analysis using SPSS,” An International for Health and Social Science, pp. 1–283, 2011. [11] D. List, Know Your Audience: A Practical Guide to Media Research,
3rd ed. Original Books, 2007. D. Green, and J. Pearson, “Development of a web site usability instrument based on ISO 9241-11,” Journal Of Computer Information Systems, vol. 47, no. 1, pp. 66-72, 2006.
[12] Y. Yusof, M. F. Lee, and C. S. Lai, “Integrasi konsep dan teori beban kognitif dalam pendidikan kejuruteraan di Malaysia : Satu kajian literatur,” Geogr. Online Malaysian J. Soc. Sp., vol. 3, no. 3, pp. 46– 57, 2016.
[13] H. B. Santoso, I. Nurrohmah, F. Suci, and W. H. Goodridge, “Evaluating and Redesigning the Self-Monitoring Tool,” Int. J. Adv. Sci. Eng. Inf. Technol., vol. 77, no. 1, pp. 228–234, 2017.
[14] Z. Abdullah, J. Mohamed Kassim, and Q. A. A. Ahmad Fazil, “Pengujian Kebolehgunaan Perpustakaan Digital,” J. Teknol. Mklm. Multimed., vol. 9, pp. 71–82, 2011.
[15] R. S. Pressman, Software Engineering A Practitioner’s Approach. McGraw-Hill, 2001.
[16] ISO (1998) ISO 9241: Guidance on Usability Standards. [On-line]. Available: http://www.iso.org/iso/iso_catalogue/catalogue_ics /catalogue_detail_ics.htm?csnumber=16883&ICS1=13&ICS2=180& IC
[17] D. Green, and J. Pearson, “Development of a web site usability instrument based on ISO 9241-11,” Journal Of Computer Information Systems, vol. 47, no. 1, pp. 66-72, 2006.
[18] P. Kortum, and A. Bangor, “Usability Ratings for Everyday Products Measured With the System Usability Scale,” International Journal of Human-Computer Interaction, vol. 19, no. 2, pp. 67 -76, 2013. [19] M. Azul, M. Salleh, A. Salman, M. Nor, S. Ali, and H. Hashim, “the
Importance of Usability Features in Enhancing Online Communication Satisfaction,” J. Komun. Malaysian J. Commun. Jilid, vol. 32, no. 321, pp. 519–531, 2016.
[20] A.M. Lund, “Measuring usability with the USE questionnaire,” Usability Interface, vol. 8, no. 2, pp.3-6, 2001. [21] F. D. Davis, “Perceived Usefulness , Perceived Ease of Use , and
User Acceptance of lnformation Technology,” MIS Q., vol. 13, no. 3, pp. 319–340, 1989.
[22] J.Nielsen, Usability Engineering, London: Academic Press Limited, 1993.
[23] R. Oliver, Satisfaction: A Behavioral Perspective on the Consumer, New York: Routledge, 2010.
[24] R. Vebrianto and K. Osman Abstrak, “Keberkesanan Penggunaan Pelbagai Media Pengajaran dalam Meningkatkan Kemahiran Proses Sains dalam Kalangan Pelajar ,” J. Pendidik. Malaysia, vol. 37, no. 1, pp. 1–11, 2012.
[25] K. Brundiers, A. Wiek, and C. L. Redman, “Real-world learning opportunities in sustainability: from classroom into the real world,” Int. J. Sustain. High. Educ., vol. 11, no. 4, pp. 308–324, 2010. [26] J. Wittwer, and A. Renkl, “How effective are instructional
explanations in example-based learning? A meta-analytic review,” Educational Psychology Review, vol. 22, no. 4, pp. 393– 409, 2010. [27] JV. Anastasiade, “Instructional Strategies for Developing
Problem-Solving Skills The Worked Example Effect Using Ill-Structured Visual Pattern Recognition Problems,” PhD Dissertation, Capella University, 2009.
[28] S. L. Sun, Zaidatun Tasir, & Jamalludin Harun, “Penghasilan modul pembelajaran berasaskan teori beban kognitif untuk subjek teknologi maklumat dan komunikasi”, 1st International Malaysian Educational Technology Convention, pp. 1204–1213, 2006.
[29] R. C. Clark, and C. Lyons, Graphics for learning: Proven guidelines for planning, designing and evaluating visuals in training materials, San Francisco, CA: Pfeiffer, 2010.
[30] N. Al-Mohammadi, “Effectiveness of using infographics as an approach for teaching programming fundamentals on developing analytical thinking skills for high school students in the city of Makkah in Saudi Arabia,” Global Journal of Educational Studies, vol. 3, no.1, pp. 22-42, 2017.
[32] M. Davis, and D. Quinn, “Visualizing text: The new literacy of infographics,” Reading Today, vol. 31, no. 3, pp. 16-27, 2013. [33] H. B. Santoso, A. K. Nisa, and R. Fitriansyah, “Usability evaluation
of the Hospital Management Information System: Case study of an emergency installation application of a regional public hospital,” Int. J. Adv. Sci. Eng. Inf. Technol., vol. 7, no. 6, pp. 2294–2301, 2017. [34] R. M. Branch, Instructional Design-The ADDIE Approach, New
York: Springer, 2009.
[35] D. Datyal, “Proposed Model to Overcome the Problems in Waterfall Model,” vol. 2, no.2, pp. 29–32, 2015.
[36] A. Renkl, & R. K. Atkinson, “Structuring the transition from example study to problem solving in cognitive skill acquisition: A cognitive load respective,” Educational Psychologist, vol. 38, no. 1, pp. 15–22, 2003
[37] R. C. Clark, and C. Lyons, Graphics for learning: Proven guidelines for planning, designing and evaluating visuals in training materials, San Francisco, CA: Pfeiffer, 2010.
[38] S. Kalyuga, P. Ayres, P. Chandler, & J. Sweller, “The expertise reversal effect,” Educational Psychologist, Vo. 38, no. 1, pp. 23–31, 2003.
[39] M. Dick, “Interactive infographics and news values”, Digital Journalism, vol. 2, no. 4, pp. 490-506, 2014.
[40] A. Prof, & Y. Serkan, Infographics for Educational Purposes: Their Structure, Properties and Reader Approaches, vol. 15, no.3, 2016. [41] M. Denscombe, The Good Research Guide, Open University Press:
McGraw-Hill, 2010.
[42] C.M. Barnum, Usability testing and research, New York: Longman, 2002.
[43] J. F. Hair, W.C. Black, B. J. Babin, and R. E. Anderson, Multivariate data analysis, 7th ed. New Jersey, USA: Prentice Hall Inc., 2010. [44] A. Jamil, “Pemupukan budaya penyelidikan di kalangan guru sekolah:
satu penilaian,” Tesis Ijazah Kedoktoran, Universiti Kebangsaan Malaysia, 2002.
[45] A.B. Zainudin, I.K. Meor, Z. M. Z. Megat Aman, &, A.I. Mohd, “Kemahiran ICT guru pelatih Universiti Teknologi Malaysia,” Prosiding Seminar Kebangsaan JPPG, Johor Bahru: Penerbit UTM, 2007.
[46] M. Shafipoor, R. Sarayloo, and A. Shafipoor, “Infographic (information graphic); a tool for increasing the efficiency of teaching and learning processes,” International Academic Journal of Innovative Research, vol. 3, no. 4, pp. 39-45, 2016.
[47] S.M.J. Azizul & R. Din, “Teaching and Learning Mathematics on Geometry using Geogebra Software via MOOC,” Journal of Personalized Learning, vol. 2, no. 2, pp. 40-51, 2018.
[48] R.A. Bataineh, A.A. Mashakbh & R .Din. “Hybrid Personalized Arabic Language Learning,” Journal of Personalized Learning, vol. 2, no. 1, pp. 58-72, 2018.