Design, Implementation and Evaluation of Fuzzy
Logic and PID Controllers for Fuel Cell Systems
Abdulbari Ali Mohamed Frei, Hüseyin Demirel, and Bilgehan Erkal
Department of Electrical and Electronics, Karabük, Turkey Email: {freiabd, berkal99}@gmail.com, [email protected]Abstract—In this paper, fuel cell control is investigated in addition to the use of fuzzy logic to control fuel cells. For fuzzy rules, the maximum power point tracking algorithm is used. Additionally, PID control is used and tested in this paper. As simulation results show, the performance of fuzzy logic is better than PID control. In general, for fuel cell systems, humidification is required for the air or the hydrogen, or both the air and hydrogen at the fuel cell inlets. Moreover, water content is very important for the protonic conductivity in the proton exchange membranes. If membrane dehydration or drying occurs, electrical performance decreases due to significant ohmic losses.
Index Terms—fuel cell, fuzzy logic, PID controller
I. INTRODUCTION
Energy has been predicted as one of the main problems that humanity must face in the future. Nowadays, primary energy sources around the world consist of fossil fuels, namely petroleum, coal and natural gas. However, there are a number of problems with the continued use of fossil fuels. First, they are limited in amount and one day will be depleted. Secondly, they cause serious environmental problems such as global warming, climate change, acid rain, air pollution, ozone layer depletion, and so on. For these reasons, alternative energy sources are needed. These, in combination with fuel cells, make hydrogen energy systems a good alternative [1]. Hydrogen is a perfect energy carrier with its many unique properties. Together with hydrogen, fuel cells have been attracting much attention as they directly and efficiently convert the chemical energy of reactants into electrical energy. A fuel cell is an electrochemical device that converts the energy of chemical reactions directly into electrical energy by combining hydrogen with oxygen. In these chemical reactions, the only byproducts are heat and water. Fuel cells have many advantages over conventional systems that produce electricity, including and especially its higher efficiency than conventional systems.
Of the many types of fuel cells, Proton Exchange Membrane (PEM) fuel cells are spectacular due to their compactness, light weight, high power and low cost [1]. They have been noticed as the most promising power generating device candidates in portable electronic, automotive and distributed power generation applications
Manuscript received February 17, 2016; revised May 27, 2016.
determine which [12]. In [13], the authors proposed a method for Wind Generator (WG) Maximum Power Point Tracking (MPPT) system, DC/DC converter and MPPT functions for control unit. The load impedance is matched with the impedance of the source under a given wind speed wind energy conversion system which can provide maximum strength. Because of the load and dynamically changing wind speed, Maximum Power Point Tracking (MPPT) becomes more complex. The advantages of the wind speed MPPT method, there is no need to measure WGA optimal power characteristic, and it can operates at variable speeds WGA. Thus, there is a system of high reliability, low complexity and less mechanical stress on the WG. In this paper, a hybrid algorithm is used for Maximum Power Point Tracking. In the author’s method, the electrical variation and the duty cycle of the inverter output voltage are adjusted in accordance with various embodiments [13].
II. METHODOLOGY
A. The PID Controller
This controller replaces the amplifier in the forward path of our closed-loop control system. One example of PID controller is shown in Fig. 1.
Figure 1. PID controller
“The Plant” merely refers to the equipment whose output is being controlled. In this figure, r is the reference input. We tell the system that we want the output y to settle at a value which will make the transducer output equal to y, where e is the error, u is the controller output or controller action and y is the plant output. We began our studies of such systems by using only an amplifier instead of the PID controller. The PID controller (also called a Three-Term Controller) actually incorporates what is effectively an amplifier. The output u of the PID controller is:
de
u P e I edt D
dt
(1)where P, I and D are the Proportional, Integral and Derivative gains respectively. If I and D are both zero, the controller is just an amplifier with a gain P.
B. Modeling the System with Equations
A discrete PI controller is used as the fuel cell controller based on the following equation:
( ) p( ) i( )
y k y k y k (2)
where:
( ) ( )
( ) ( 1) ( )
1 ( ) 1
p p
i i i s
i
y k K e k
y k y k K T e k
y k
(3)
y(k) - Controller output
e(k) - Error (difference between desired output and actual output)
Ts - Sample time Kp - Proportional gain Ki - Integral gain
The Backward Euler method (a numerical integration approximation) is used to solve the integrator equation from above. This is why the integrator equation goes from yi(k-1) to yi(k).
The output of the integrator equation must fall between -1 and 1. This range is required as an anti-windup measure, or to prevent windup in the system. Windup refers to the condition when the controller is ineffective at reducing the system error, and so the integral state (yi(k)) becomes very large. Table I shows the parameter of PID and their values that used in this paper.
TABLE I. THE PARAMETER USED IN THIS PROJECT IS AS BELOW
Parameter Ki Kd Kp
Description Coefficient Integrator Coefficient Derivative Proportional Coefficient
Value 100 0.1 30
C. Fuzzy Logic
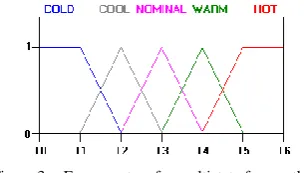
Fuzzy logic is a theory that has been developed which colloquially refers to the modeling of uncertainty and vagueness of descriptions. It is a generalization of the divalent Boolean logic. For example, so-called fuzziness of information is “very” captured in mathematical models as “a bit,” “pretty” or “strong”. Fuzzy logic is based on fuzzy sets and so-called membership functions that represent objects in fuzzy sets and matches logic operations on these quantities and their inferences. Moreover, for technical applications, methods for fuzzification and defuzzification must be considered, that is, methods for the conversion of information and relationships in fuzzy logic and back again, such as a control value for a heater as a result. In Fig. 2, the fuzzy system is illustrated for a weather state.
Figure 2. Fuzzy logic for weather state
This figure shows only three states. The other state is shown in Fig. 3.
Figure 3. Fuzzy system for multistate for weather
Figure 4. SIMULINK model with PID controller
Figure 5. DC-to-DC convertor
A DC-to-DC converter is an electronic circuit which converts a source of Direct Current (DC) from one voltage level to another. It is a type of electric power converter. Power levels range from very low (small batteries) to very high (high-voltage power transmission). The DC-to-DC converter that used is shown in Fig. 5.
Figure 6. Simulation result for fuel flow rate and O2, H2 and fuel management and stack efficiency
After simulation, the result is obtained as shown in Fig. 6. In this figure, the X-coordinate is Time (S) and the
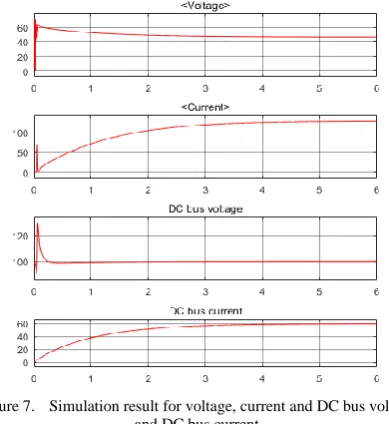
Y-coordinate is the amplitude value for the fuel flow rate, Oxidant and Hydrogen, Stack consumption and stack efficiency. The output of the stack is shown in Fig. 7. In this figure, the voltage, current, DC bus voltage and DC bus current is shown.
Figure 7. Simulation result for voltage, current and DC bus voltage and DC bus current
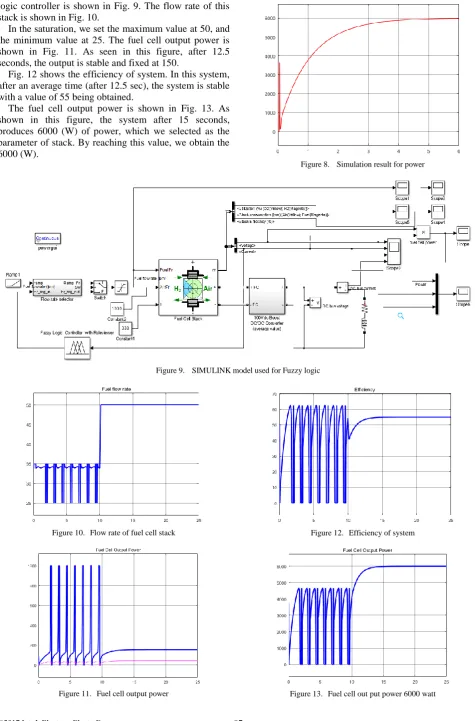
logic controller is shown in Fig. 9. The flow rate of this stack is shown in Fig. 10.
In the saturation, we set the maximum value at 50, and the minimum value at 25. The fuel cell output power is shown in Fig. 11. As seen in this figure, after 12.5 seconds, the output is stable and fixed at 150.
Fig. 12 shows the efficiency of system. In this system, after an average time (after 12.5 sec), the system is stable with a value of 55 being obtained.
The fuel cell output power is shown in Fig. 13. As shown in this figure, the system after 15 seconds, produces 6000 (W) of power, which we selected as the parameter of stack. By reaching this value, we obtain the 6000 (W).
Figure 8. Simulation result for power
Figure 9. SIMULINK model used for Fuzzy logic
Figure 10. Flow rate of fuel cell stack
Figure 11. Fuel cell output power
Figure 12. Efficiency of system
As shown in this figure, after 13 seconds, the final value for power is 6000 watts. The voltage curve, current, DC bus voltage and DC bus current is shown in Fig. 14. As shown in this figure, the voltage after the middle of the simulation time is stable, this value is 55 volt. For the cuurent, this value is 0. Moreover, for the DC bus voltage, the value is 100 volt and for the DC bus current we produce approximately 60A.
Figure 14. Voltage, current, DC bus voltage and DC bus current simulation result
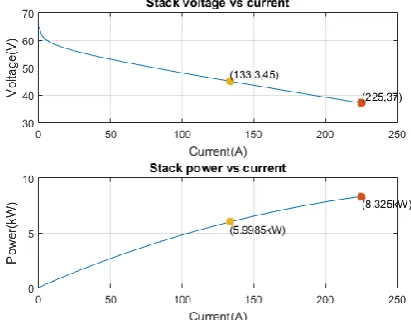
The stack voltage vs current is shown in Fig. 15. As shown in this figure, this curve represents the value of voltage vs current. This simulation is inside the stack. For every current from 0A to 250A, the voltage is shown as below.
Figure 15. Stack voltage vs current and stack power vs current
Fig. 15 shows the stack power vs current. As seen in this figure the current start at 0A and increases 250A. The maximum power is 8.325KW.
The fuel cell nominal parameter is shown in Table II and Table III.
As shown in Table II, fuel cell resistance is 0.07833 ohms and the Nernst voltage of one cell is 1.1288 volts. For nominal utilization, there are two types of element, and these two types are the hydrogen and the oxidant. The Hydrogen takes approximately 99.56 percent of the material of the fuel cell, and the oxidant takes about 59.3 percent of this fuel cell. For nominal consumption, there are two elements, namely fuel and air. The exchange
current is 0.29197 Ampere and the exchange coefficient (alpha) is 0.60645 [14].
TABLE II. FUEL CELL NOMINAL PARAMETERS
Stack power Nominal (w) 5998.5 Maximal (w) 8325 Fuel Cell Resistance (ohms) 0.07833 Nerst voltage of one cell [En]
(V) 1.1288
Nominal Utilization Hydrogen (H2) 99.56 % Oxidant (O2) 59.3%
Nominal Consumption Fuel (Slpm) 60.38 Air (slpm) 143.7 Exchange current (A) 0.29197 Exchange Coefficient [alpha] 0.60645
TABLE III. FUEL CELL SIGNAL VARIATION PARAMETERS
Fuel composition (%) 99.95 Oxidant Composition (%) 21
Fuel flow rate (lpm) Nominal 50.06 Maximum 84.5
Air Flow Rate (lpm)
Nominal 300
Maximum 506.4 System temperature (K) 338 Fuel Supply Pressure (bar) 1.5 Air supply pressure (bar) 1
III. CONCLUSION
In recent years, research and development activities in fuel cells have accelerated. In spite of the significant improvements in the technology of proton exchange membranes, their performance, stability and reliability are not sufficient to replace internal combustion engines. Furthermore, the cost of fuel cell systems is still too high for them to become acceptable commercial products. The most important problems to be overcome are the improvement of their performance and the reduction of their cost. In PEM fuel cells, hydrogen and air humidification may be required in order to avoid fuel cell membrane dehydration. At high current flows, ohmic heating causes problems of drying in the polymer membrane and this slows ionic transport through the membrane. Due to water generation on the air side in some fuel cell stacks, humidification is not required. Generally in fuel cell systems, humidification is required for either the air or the hydrogen, or both the air and hydrogen at the fuel cell inlets. Water content is very important for the protonic conductivity in the proton exchange membranes. If membrane dehydration or drying occurs, electrical performance drops due to significant ohmic losses.
ACKNOWLEDGMENT
The authors wish to thank the editors. This work was supported by Karabük University.
REFERENCES
[1] M. B. Rodríguez, M. G. A. R. Paleta, J. A. R. Marquez, A. B. T. Pachuca, and J. R. G. D. L. Vega, “Effect of a rigid gas diffusion media applied as distributor of reagents in a PEMFC in operation,”
[2] M. Ceraolo, C. Miulli, and A. Pozio, “Modelling static and dynamic behaviour of proton exchange membrane fuel cells on the basis of electro-chemical description,” J. Power Sources, vol. 113, no. 1, pp. 131-144, 2003.
[3] E. M. Youssef, K. E. Al-Nadi, and M. H. Khalil, “Lumped model for Proton Exchange Membrane Fuel Cell (PEMFC),” Int. J. Electrochem. Sci., vo. 5, no. 1, pp. 267-277, 2010.
[4] T. A. Zawodzinski, et al., “Water uptake by and transport through nation 117 membranes,” J. Electrochem. Soc., vol. 140, no. 4, pp. 1041-1047, 1993.
[5] M. Ehsani, Y. Gao, and A. Emadi, Modern Electric, Hybrid Electric and Fuel Cell Vehicles, Fundamentals, Theory and Design, Second ed., CRC Press, 2010.
[6] EG&G Technical Services, Inc., “Fuel cell handbook,” US Department of Energy, Office of Fossil Fuel Energy, National Energy Technology Laboratory, West Virginia, USA, 2004. [7] W. Krewitt and S. Schmid, “Fuel cell technologies and hydrogen
production/distribution options,” CascadeMints, 2005.
[8] G. Hulbert, “Fuel cell air intake system,” Final report, Michigan Engineering, 2009.
[9] J. Jiao and X. Cui, “Adaptive control of MPPT for fuel cell power system,” Adaptive Control of MPPT for Fuel Cell Power System, vol. 8, no. 4, pp. 1-10, Feb. 2013.
[10] Z. D. Zhong, H. B Huo, X. J. Zhu, G. Y Cao, and Y. Ren, “Adaptive maximum power point tracking control of fuel cell power plants,” Journal of Power Sources, vol. 176, pp. 259-269, 2008.
[11] S. Carreon-Bautista, C. Erbay, A. Han, and E. Sanchez-Sinencio, “An inductorless DC-DC converter for an Energy aware power management unit aimed at microbial fuel cell arrays,” IEEE Journal of Emerging and Selected Topics in Power Electronics, vol. 3, no. 4, pp. 1109-1121, 2015.
[12] N. Karami, L. E. Khoury, G. Khoury, and N. Moubayed, “Comparative study between P&O and incremental conductance for fuel cell MPPT,” in Proc. International Conference on Renewable Energies for Developing Countries,Beirut, Lebanon, 2014, pp. 17-22.
[13] C. Rambabu, M. S. Kumar, and N. S. Harish, “Design of MPPT based hybrid wind and fuel-cell,” International Journal of Computer Science & Communication Networks, vol. 1, no. 3, pp. 297-304, 2013.
[14] A. S. Samosi, T. Sutikno, and A. H. M. Yatim, “Dynamic evolution control for fuel cell DC-DC converter,” Telkomnika, vol. 9, no. 1, pp. 183-190, 2011.
Abdulbari Ali Mohamed Frei was born in January 22nd, 1983 in Messelata, Libya. He got his secondary certificate from Tariq ben Ziyad School in 2000, and he graduated from the Higher Institute for Comprehensive Occupations in Messelata, Libya in Electrical Engineering Section/Electrical Instrument for (Spring 2006). He had worked in the Higher Institute for Comprehensive Occupations in Messelata, Libya at Electrical and Electronic Department. Now he is studying a master degree in Electrical and Electronic Department in Karabük University Turkey, His current research is about Fuel cell energy control with intelligent system.
Hüseyin Demirel was born in 1975. He is from Ankara. He graduated Balgat Vocational High School in 1993 and he graduated from Gazi University Electronic and Computer Education Department in 1997. After that he got a master degree in 1999 and a PhD degree in 2010 from Gazi University. He works in Karabük University Electrical and Electronic Engineering Department.
Bilgehan Erkal was born in 1975 in Ankara.