Effects of Yogic Practices with and without Diet Modification on
Selected Physical and Physiological Variables among Pregnant Women
Selvi. C
#1, Dr.V.Duraisami
*2 1Ph. D. Scholar, Department of Yoga, Tamil Nadu Physical Education and Sports University, Chennai 2
Assistant Professor, Department of Yoga, Tamil Nadu Physical Education and Sports University, Chennai
Abstract—The aim of this study is to examine the effects of yogic practices on Body Mass Index (BMI) and Fasting Blood Glucose (FBG) level among pregnant women in their second trimester. To achieve the purpose sixty (60) primiparous women were randomly selected from various maternal health centers in and around Chennai city. Their age varied between 23 Years to 28 Years. Subjects were randomly assigned into three groups. Experimental group I (20-subjects) Experimental group II (20) and Control group (20). Experimental group I underwent six days of yogic practices for one hour in the morning between 6.30 am to 7.30 am along with diet consultation. Experimental group II also underwent similar practices without any modification in their regular routine diet. Whereas control group did not undergo any training program except their regular maternal health check up. All the three groups were tested for Body Mass Index using standardized formula (Height in meter square /Weight in Kilogram) and Fasting Blood Glucose level using standardized laboratory test. The data pertaining to the variables collected from all the three groups before and after the training period were statistically analyzed using Analysis of Covariance (ANACOVA) to determine the significant difference and tested at 0.05 level of confidence. The study reveals that Experimental groups show a significant difference in BMI and FBG than the control group. Experimental groups, I show the significantly better difference in BMI and FBG than Experimental group II due to yogic intervention along with diet modification. Hence the hypothesis was accepted at 0.05 level of confidence.
Keywords—Pregnancy; Yogic Practices; Body Mass Index; Fasting Blood Glucose.
1. Introduction
Women with a normal body mass index before pregnancy, who gain excessive weight or very little weight than the recommended weight during pregnancy, have an high level of impact on the metabolic rate of their off springs which in turn affects the appetite control and energy expenditure of the fetus, in later stages of life, leads to childhood obesity and other complications [1]. Women with excessive weight gain during pregnancy have 80 percent chance to have an obese child, women with very little weight gain have 63 percent chance to have an obese
child [1]. Greater episodes of congenital abnormalities, pre-term babies, pre-eclampsia are strongly associated with obesity during pregnancy [2]. Maternal obesity with greater deposition of adipose tissue within the growing fetus, increase the risk of allergies, also have an impact on fetal brain development and behavioral pattern, leads to autism and ADHD [2]. The accumulation of environmental factors in egg and sperm of parents contribute a lot to the formation of genetic material to the child. Many lifestyle factors including poor and unhealthy diet, obesity, smoking, drinking and also the age of the parents have an influence on transmitting the signals to the embryo, which in turn increase the risk of metabolic disorders such as diabetes, obesity, cardiovascular diseases, Anxiety, Immune dysfunction etc. [4]. Women with moderate obesity during pregnancy, have an impact on birth weight and risk of metabolic disorders to their grandchildren leaving the risk of their own children [5]. Genetic factors of parents, available nutritional status, social and cultural environment of pregnant women have an influence on birth weight of their babies [6]. “The wealth of the society is been
measured by the health of the children, it has to be taken care during pregnancy. India should invest more in its most important resources. Human capital formed at the very
beginning of the life” (“Coffey”- Princeton University) [7]. In order to prevent complications during pregnancy, we need to focus on nutritional status and physical activity, which is beneficial for pregnant mother and growing fetus [3]. The health status of women during pregnancy is directly proportional to the health of Newborn babies. Having healthy food during pregnancy and regular exercise for an hour a day for five to six days a week will reduce the risk and complications during pregnancy, which in turn improve the success rate of healthy babies. Many women die during pregnancy or following childbirth due to various reasons, most important among them are severe bleeding, infections, high blood pressure, anemia etc. which can be addressed earlier and treated with careful monitoring if known before. Interventions should be found on directing the parent's health in advance, during pre-conception assisting them to lead a healthy life will not only improve their lifestyle, but also the health of their children[8]. Almost 75% of maternal death could have been prevented with proper Ante-natal care (“Princeton University” -Maternal health in India 2015) [9]. The access to Ante-natal care during pregnancy should be made easy and
approachable to poorer communities, rural areas, who are in need at present. People from the poor economic background, who stays away from skilled health care system, do not have proper knowledge about Ante-natal care, inadequate services play a major role in increasing the mortality rate during pregnancy every year [10]. Exercising for thirty to sixty minutes a day for six days a week is thought to be beneficial for pregnant mom and growing baby. This helps to increase the blood supply to mother and fetus, reduces the level of stress, improve the mood and energy level. Improve the quality of sleep.
Mother’s nutritional status during pregnancy plays a vital
role on various aspects of the fetus, which includes brain development, improvement in cognitive and thinking ability of fetus. The intelligence level of the fetus and social adjustment in the later part of life is also very much depends on the nutritional and psychological status of the mother during pregnancy. Hence it is very much important to focus on balanced diet during pregnancy in order to improve the labor and delivery Apart from above-mentioned benefits.
2. Objectives of the Study
· This study will help to find out the effects of yogic practices with and without diet modification on Body Mass Index among pregnant women
· This study will help to find out the effects of yogic practices with and without diet modification on Fasting Blood Glucose among pregnant women
3. Statement of the Problem
Maternal mortality rate is increasing day by day at an alarming rate. Death during pregnancy has been raised up
to 830 per day. We need to find out some solution to overcome this situation mostly in the developing countries [11]. Women from low socioeconomic status and from rural areas need extra care during their emergency period. Proper care should be given at the time of conception, during the entire course of pregnancy and also after their deliveries in order to protect the mother and Newborn babies [12].
4. Hypothesis
· It is hypothesized that there would be a significant difference in Body Mass Index of pregnant women due to yogic practices with and without diet modification than the control group.
· It is hypothesized that there would be a significant difference in Fasting Blood Glucose of pregnant women due to yogic practices with and without diet modification than the control group.
5. Methodology
The purpose of the present study is to analyze the outcome of yogic practices with and without diet modification on Body Mass Index and Blood Glucose level among pregnant women. To achieve the purpose of the study, sixty pregnant women who are pregnant for the first time from various maternity clinic in and around Chennai city were randomly selected. The age group of the subjects ranged from 21 to 28 years. The investigator selected the independent variables namely yogic practices with and without diet modification for the analysis. The dependent variables selected for this study was physiological variable namely Blood Glucose level and physical variable as Body Mass Index.
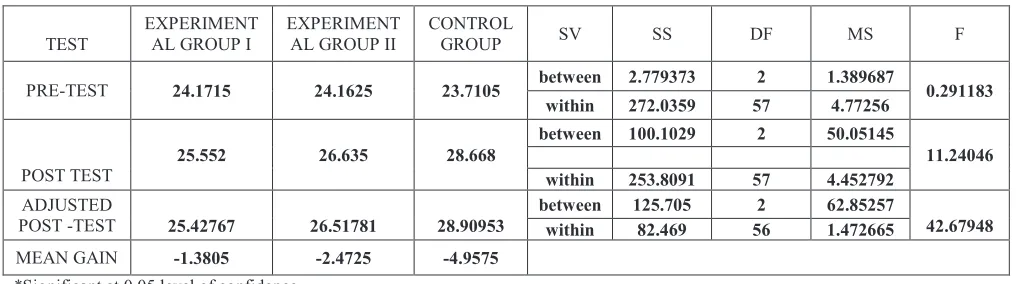
Table 1: Analysis of covariance for the pre, post and adjusted post-test on Body Mass Index of experimental groups and control group (M2/KG )
*Significant at 0.05 level of confidence.
The pre-test and post-test random group design were used as an experimental design, in which sixty pregnant women were divided into three groups of twenty subjects
in each group. Group I yogic practices with diet modification, Group II yogic practices without diet modification and Group III acted as a control group. The
TEST
EXPERIMENT AL GROUP I
EXPERIMENT AL GROUP II
CONTROL
GROUP SV SS DF MS F
PRE-TEST 24.1715 24.1625 23.7105 between 2.779373 2 1.389687 0.291183
within 272.0359 57 4.77256
POST TEST
25.552 26.635 28.668
between 100.1029 2 50.05145
11.24046 within 253.8091 57 4.452792
ADJUSTED
POST -TEST 25.42767 26.51781 28.90953
between 125.705 2 62.85257
42.67948 within 82.469 56 1.472665
MEAN GAIN -1.3805 -2.4725 -4.9575
subjects were tested on the selected criterion variables before and after the training program. The data collected from the three groups before and after the training program on the selected criterion variables were statistically analyzed with analysis of covariance (ANCOVA), whenever the ‘F’ –ratio for adjusted posttest means were found to be significant, Schaffer's test was followed by a post hoc test to determine which of the paired mean differences were significant. In all the cases 0.05 level of significance was fixed at level of confidence to test the hypothesis (Clarke 1972)
The Table I show that the pre-test mean values on Body Mass Index of experimental group I, experimental group II and control groups were 24.17, 24.16 & 23.71 respectively.
The obtained ‘F’ ratio 0.291 for the pre-test score was lesser than the table value 3.22 for 2 and 57 degrees of freedom at 0.05 level of confidence on Body Mass Index.
There is no significant difference between the experimental and control groups on Body mass index. The post-test mean values on Body mass index of experimental group I, experimental group II and control groups were 25.52, 25.63 & 28.66 respectively. The obtained ‘F’ ratio 11.24 for
post-test scores was greater than the table value 3.22 for the degree of freedom 2 and 57 required significance at 0.05 level of confidence on Body mass index. The adjusted post-test means on Body mass index of experimental group I, experimental group II and control groups were 25.42,
26.51 & 28.90 respectively. The obtained ‘F’ ratio of 42.67
for adjusted post-test means was greater than the table value of 3.23 for the degree of freedom 2 and 56 required for significance at 0.05 level of confidence on Body mass
index. Since the obtained ‘F’ ratio was significant, in order to find out the paired mean difference, the Scheffe’s test
was employed.
Table 2:Scheffe’s post Hoc test on Body Mass Index of experimental groups and control group (M2/KG )
EXPERIMENT AL GROUP I
EXPERIMENT AL GROUP II
CONTROL
GROUP MD CI
25.43 26.52 - -1.09 0.98
25.43 - 28.91 -3.48 0.98
- 26.52 28.91 -2.39 0.98
The TableII shows that the Scheffe’s post –Hoc method of testing the significance of the difference between the paired means the following analysis of covariance for the experimental group I, experimental group II and control group was done. The mean differences between the experimental group I, experimental group II is 1.09 which is significant at 0.05 level of the confidence interval. The mean differences between the experimental group I and control group is 3.48 which is significant at 0.05 level of the confidence interval.
The comparison between experimental group II and control group is 2.39 the mean difference is significant at 0.05 level of the confidence interval. This indicates that the Body mass index was significantly improved in both the experimental groups than the control group. There is a significant difference between experimental group I and experimental group II, but when comparing the mean difference the experimental group I is more effective in reducing Body mass index compared to experimental group II.
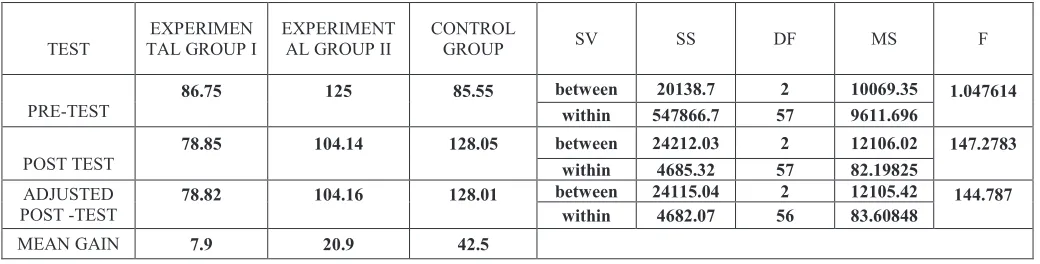
Table 3: Analysis of covariance for the pre, post and adjusted post-test on Fasting blood glucose level of experimental groups and control group
The Table III shows that the pre-test mean values on Fasting blood glucose level of experimental group I,
experimental group II and control groups were 86.75, 125
& 85.55 respectively. The obtained ‘F’ ratio 1.047 for the
TEST
EXPERIMEN TAL GROUP I
EXPERIMENT AL GROUP II
CONTROL
GROUP SV SS DF MS F
PRE-TEST
86.75 125 85.55 between 20138.7 2 10069.35 1.047614
within 547866.7 57 9611.696
POST TEST
78.85 104.14 128.05 between 24212.03 2 12106.02 147.2783 within 4685.32 57 82.19825
ADJUSTED POST -TEST
78.82 104.16 128.01 between 24115.04 2 12105.42 144.787
within 4682.07 56 83.60848
MEAN GAIN 7.9 20.9 42.5
pre-test score was lesser than the table value 3.22 for 2 and 57 degrees of freedom at 0.05 level of confidence on Fasting blood glucose level. There is no significant difference between the experimental and control groups on Fasting blood glucose level. The post-test mean values on Fasting blood glucose level of experimental group I, experimental group II and control groups were 78.85,
104.14 & 128.05 respectively. The obtained ‘F’ ratio
147.27 for post-test scores was greater than the table value 3.22 for the degree of freedom 2 and 57 required significance at 0.05 level of confidence on Fasting blood
glucose level. The adjusted post-test means on Fasting blood glucose level of experimental group I, experimental group II and control groups were 78.82, 104.16 & 128.01
respectively. The obtained ‘F’ ratio of 144.787 for adjusted
post-test means was greater than the table value of 3.23 for the degree of freedom 2 and 56 required for significance at 0.05 level of confidence on Fasting blood glucose level.
Since the obtained ‘F’ ratio was significant, the Scheffe’s
test was used to compare the differences between the means of all the three groups.
Table 4: Scheffe’s post Hoc test on Fasting blood glucose level of experimental groups and control group
EXPERIMENT AL GROUP I
EXPERIMENTAL GROUP II
CONTROL
GROUP MD CI
78.82 104.16 - 25.34 7.35
78.82 - 128.02 49.20 7.35
- 104.16 128.02 23.85 7.35
The mean differences between the experimental group I, experimental group II is 25.34 which is significant at 0.05 level of the confidence interval. The mean differences between the experimental group I and control group is 49.20 which is significant at 0.05 level of the confidence interval. The comparison between experimental group II and control group is 23.85 the mean difference is significant at 0.05 level of the confidence interval. This indicates that the Fasting blood glucose level was significantly reduced in both the experimental groups than the control group. There is a significant difference between experimental group I and experimental group II, but when comparing the mean difference the experimental group I is more effective in reducing Fasting blood glucose level compared to experimental group II.
6. Conclusion
The results of the study indicated that the experimental groups I and II namely yogic practices with and without diet modification had significantly influenced by the selected variables such as Body mass index and Fasting Blood glucose level, as both experimental groups had undergone systematic training over twelve weeks duration. At the same time when the two experimental groups were compared, yogic practices with diet modification group showed significant improvement in Body mass index and Fasting blood glucose level than the yogic practices without diet modification group. The control group did not show significant improvement in the selected variables as they did not undergo yogic training or diet consultation similar to that of experimental groups. So, the training impact of twelve-week yogic practices with diet modification was much greater than that of yogic practices without diet modification among pregnant women. The
same method of training may recommend for a first and third trimester of pregnancy to improve the physical and physiological variables. This study will help to enhance the overall health and well-being of mother and fetus. Future studies should concentrate on genetics, environmental, social and cultural factors of parents before conception, in order to avoid the negative influence on their grandchildren.
References
[1] Sneha B. Sridhar, Jeanne Darbinian, Samantha F. Ehrlich, Margot A. Markman, Erica P. Gunderson, Assiamira Ferrara and Monique
M. Hedderson, “Maternal gestational weight gain and offspring risk
for childhood overweight or obesity”, American Journal of
Obstetrics and Gynecology, Vol. 211, No.3, Sep. 2014, pp. 259.e1–
259.e8.
[2] Keith M Godfrey, Rebecca M Reynolds, Susan L Prescott, Moffat Nyirenda, Vincent W V Jaddoe, Johan G Eriksson and Birgit F P Broekman, “Influence of maternal obesity on the long-term health
of Offspring”, The Lancet Diabetes and Endocrinology, Vol. 5,
No.1, Jan. 2017, pp. 53–64.
[3] Maternal Mortality, World Health Organization. World Health Organization, updated on Nov. 2016, Visited on 29 May 2017, http://www.who.int/mediacentre/factsheets/fs348/en/
[4] M. Lane, R. L. Robker and S. A. Robertson, “Parenting from before conception”, Science, Vol. 345, No. 6198, Aug.2014, pp.756 –760. [5] The University of Edinburgh. "Obese moms may pass health risks
on to grandchildren." ScienceDaily, 5th June 2013, Visited on 30 May 2017. www.sciencedaily.com/releases/2013/06/ 130605104430.htm.
[6] Rachel M. Freathy et al. Genome-wide associations for birth weight and correlations with adult disease. Nature International Weekly Journal of Science, Vol.538, No.7624, Oct. 2016, pp.248–252. [7] Diane Coffey, “Prepregnancybody mass and weight gain during
pregnancy in India and sub-Saharan Africa”, Proceedings of the
National Academy of Sciences, March 2015, pp.1-6.
[8] University of Southampton, “Preventing child obesity in the next generation must start before conception”, Science Daily, 13th Oct.
2016, visited on 30 May 2017, https://www.sciencedaily.com/ releases/2016/10/161013095740.htm
[9] The rise in obese pregnant women takes its toll on a mother, child and both, World Health Statics 2014, World Health Organization. [10] Princeton University, “Maternal health in India much worse than
previously thought”, Woodrow Wilson school of public and
International Affairs, 2nd Mar. 2015, visited on 30 May 2017,
http://wws.princeton.edu/news-and-events/news/item/maternal-health-india-much-worse-previously-thought.
[11] http://Unicef.in/whatwedo/1Maternal-Health,visited –30May 2017. [12] http://www.Sciencedaily.com/releases/2015/03/150302182341.htm,
visited on 31 May 2017.