ISSN 1392-2785 ENGINEERING ECONOMICS. 2006. No 4 (49)
ECONOMICSOFENGINEERINGDECISIONS
Correlation of Electricity Prices in European Wholesale Power Markets
Viktorija Bobinait
ė
, Aldona Juozapavi
č
ien
ė
, Vytautas Snieška
Kauno technologijos universitetas Laisvės al. 55, LT-44309, Kaunas
The time series of daily mean electricity prices which have been formed in European Power Exchanges are ana-lyzed in this article. The objective of this work is to charac-terize the degree of correlation between prices in whole-sale power markets, which are defined as environment where electricity generators and distributors deal.
In a competitive environment these prices can be de-termined by supply and demand functions and are influ-enced by various factors such as fuel prices, temperature, wind speed, precipitations, CO2 and economic growth. As electricity prices have specific and unique characteristics, such as seasonality and highly volatile wholesale prices, they are motivated to use an appropriate time series model to study the relationship between prices in different Euro-pean marketplaces. Considering this, additive regression model was used in order to estimate the relationship be-tween prices in European wholesale markets.
Correlation and regression analysis proved that bulk prices of electricity in Europe are heavily related but there are first initial steps of such correlation, although market design is similar among countries and there is an increase in spot market volume, where liquidity and foreign trade take place. Price analysis showed that wholesale prices in Finland, Sweden and Norway are lower than in other European power markets. It is not surprising, because the large proportion of energy is generated in hydro plants. On the other hand wholesale prices are very volatile in Germany, France and as it was seen prices started to rise since the beginning of 2005.
Keywords: power exchanges, wholesale electricity
pri-ces, correlation, regression model.
Introduction
The restructuring and deregulation of electricity mar-kets in Europe change electricity spot prices. Scientific literature (Higgs, Worthington, 2006) suggests that these prices started to be highly volatile and they are character-ized by strong mean reversion that means prices fluctuate around long term equilibrium. According to Joskow (2003), Higgs and Worthington (2006), the demand elastic-ity for electricelastic-ity is very low and supply becomes inelastic as demand for power is high. As a result, electricity prices jump and over a short period of time return to its previous level. Blanco and Soronow (2001) agree that power prices have such character, but add, since these prices do not keep new level for a long time and quickly come back to earlier level, it means they spike.
Spot prices are also analyzed in Botterud, Bhattacharyya, Illic (2002), Boisseleau and Hewicker (2004) works. The
latter try to relate the market design and prices formed on those marketplaces. Since market design is important in the analysis of power prices because it reflects price formation mechanism and for this reason influences behavior of market players, therefore in the next section of this article market structure is defined according to such criteria:
• Energy trade may be analysed in regard to
market-place, discussing trade on power exchange and OTC market.
• Analysing market structure of electricity, trade
abundance, variety and suitability of products of-fered in this market should be analysed.
• Analysing relations among energy wholesale prices, it
is recommended to discuss variety of created addi-tional markets on a certain marketplace which are cre-ated to meet individual needs of market participants. Subject of paper: wholesale energy prices in Europe countries.
The goal of this paper: to assess relationships of wholesale electricity prices change in European countries, after analysis of trade on power exchange and OTC mar-kets is finished.
To reach the goal of this paper the following targets are set:
1. To traverse a trade on power exchange and OTC
market.
2. To separate the main problems of wholesale
elec-tricity energy market.
3. Mathematically estimate relations among electricity
energy prices which were formed at European power exchanges.
Methods applied: analysis of literature and systemati-zation, analysis of statistical data, econometric–regressive analysis.
Consistency of assessment methods for European countries’ wholesale electricity price relation
To determine some of national electricity energy prices generality in 2005, correlation analysis of electric-ity spot prices of twelve European Union countries and Norway is performed. This allows to come to the conclu-sion about interdependence relation of these prices. To perform correlation analysis, correlation coefficient has been calculated using formula (1):
y x y x
S S
y x xy r
* *
,
−
Where r – correlation coefficient,
x – independent variable,
y – dependent variable,
Sx – independent variable standard deviation,
Sy – dependent variable standard deviation.
If interconnections closeness (correlation) coefficient is higher than |-0.50|, then change of electricity prices in certain countries is closely related (Boisseleau, Hewicker, 2004).
Performing correlation analysis, connection elasticity is determined using determination coefficient. The sig-nificance of determination coefficient is inspected using Fisher’s criterion by formula (2):
1 ; m ; 05 , 0 2
2
* ) 1 (
) 1 ( *
− − > −
− −
m n
F m R
m n
R (2)
Where R2 – determination coefficient,
n – number of tries,
m – number of independent variables.
To perform analysis electricity energy prices of April – December in 2005 on spot electricity market have been used. These prices were settled on the following Euro-pean power markets: Amsterdam power exchange APX (Netherlands), European power exchange EEX (Ger-many), Scandinavian countries’ power exchange NORD POOL, French power exchange POWERNEXT, Italian power exchange GME, Austrian power exchange EXAA, Spanish power exchange OMEL and Polish power ex-change GIELDA Energii.
Change of average daily electricity energy prices in 13 European regions is described by time series. Each value of time series is influenced by many factors. Pursu-ing to perform additive regressive models which would determine what impact on electricity energy prices of one country have the changes of electricity prices in another country, seasonal and accidental errors are assessed to each time series value (Boguslauskas, 2004). To deter-mine reliability of regressive models, approximation error
is calculated using formula (3) (Bartosevičienė, 2001):
100% * y
y y n 1 ion approximat µ
i ti i
∑
−= ; (3)
Where n – number of tries,
y – value of real dependent variable,
yti – value of dependent variable, evaluated
using created regressive model.
Variation coefficient, which is expressed by propor-tion of average quadratic deviapropor-tion and average, has been used in order to determine the rate of fluctuation of elec-tricity prices.
Trade on power exchange and OTC market In 1993 the first standardized energy power exchange in Northern European countries was founded. As a central partner it was a guarantee of voluntary market players’ participation on power exchange and their anonymity, and for this reason it was possible to avoid subjective discrimination of market participants.
Trading on power exchange spot market, prices as an
important parameter on electricity market, are formed transparently and in most cases are set in a single auction for each hour of a coming day, regarding today’s buyer’s and seller’s given price-quantity bid (ECON Analysis AB, 2004; Nord Pool Spot AS, 2006). If electricity en-ergy sellers and buyers prefer price certainty, and not prices, which will be formed on spot market in future, in this case market subjects more often will deal on forward market than on spot market. Moreover mechanism of price formation on power exchange gives an opportunity to investors, after assessing electricity energy price change tendency and its development perspectives, to make rational decisions about investment to additional capacity of electricity production.
Seeking to meet market participants’ requirements for electricity, spot market and financial products’ market deal on power exchange. Trade I markets of power ex-changes is sophisticated, requiring special preparation, knowledge and experience.
Comparing with trade on over the counter market, where agreed prices are not publicly announced to all market participants, trade on power exchange has also some disadvantages. As transactions made on power ex-change are standardized and power exex-change deals like intermediary, costs for transactions themselves may be higher than on other markets, e. g. higher than costs on OTC market.
Electricity energy price analysis for Scandinavian countries, done by scientists revealed that trade by elec-tricity energy on bilateral market may be changed to trade on power exchange. Thus, fluctuations of electricity price on power exchange spot market correlate with price fluc-tuations on OTC market. Analysis done by Boisseleau and Hewicker (2004) on wholesale prices in 2002 on electricity interdependence relation showed that Europe in 2002 had close correlation relations between electricity prices formed on power exchange and trading on OTC market. Expanded infrastructure of electricity network and possibility to get arbitration profit stipulate price homogeneity for electricity energy traded on different markets of the same country. By European Commission (2006) statement, change of prices of electricity energy sold in 2005 on German’s power exchange EEX and on OTC market was closely related, and coefficient of corre-lation is close to 1.
Identification of trade problems on power exchange
liquid wholesale electricity energy market.
Small trade volume is another problem faced by power exchange. On French power exchange POWERNEXT 44% of all electricity consumed have been bought at spot mar-ket from September 2004 until March 2005. One of a pos-sible reason for such a low volume was that 30% of all electricity market in this country is not open to competi-tion. There were consumed 143.2 TWh of electricity in this market segment during 2004.
The most liquid electricity spot market is Spain’s power exchange OMEL. On this market 2 233 TWh of electricity energy were sold in 2005. The main reason for a high liquidity is this that participation on power ex-change is mandatory, when at the same time in other countries producers and suppliers of electricity have the right to choose to sign bilateral contracts, and the differ-ence between energy supply and demand may be sold on power exchange.
Relatively high liquidity is on North European power exchange NORD POOL and German power exchange EEX. The degree of market openness to competition and
availability of information guarantee high liquidity on power exchange. These factors give positive impact on the growth of market participants’ number. In 2004 on the biggest European power exchange NORD POOL 364 participants or 87 more than in 2001 were operating. In 2004 on German power exchange EEX 123 participants were operating, while in 2003 number of participants was 112 (Capgemini, 2005). Actually not in all countries such a high number of participants is possible because their request is determined by dimension of market and capac-ity of producers.
Wholesale electricity market in Poland, Slovenia and the Czech Republic is not liquid. Trade volumes on spot market from September 2004 until March 2005 consisted in 1.5, 0.8, and 0.5% of all electricity consumed respectively.
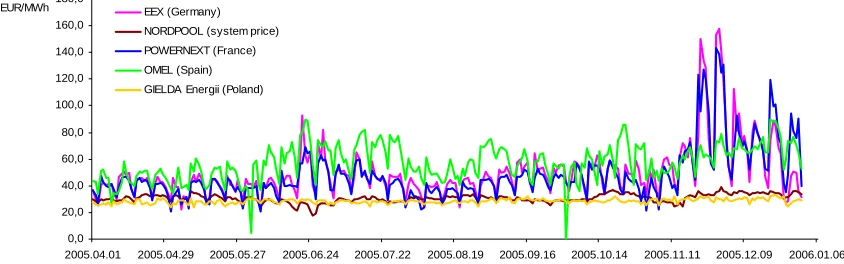
On the other hand liquidity on power exchange is low and sale volume is small, because the demand of electric-ity changes from hour to hour and for this reason price for electricity fluctuates as well. Tendencies of electricity energy price changes at wholesale market are represented in Figure 1.
0,0 20,0 40,0 60,0 80,0 100,0 120,0 140,0 160,0 180,0
2005.04.01 2005.04.29 2005.05.27 2005.06.24 2005.07.22 2005.08.19 2005.09.16 2005.10.14 2005.11.11 2005.12.09 2006.01.06 EUR/MWh EEX (Germany)
NORDPOOL (system price)
POWERNEXT (France) OMEL (Spain)
GIELDA Energii (Poland)
Figure 1. Tendencies of average daily electricity prices change at European power exchange in 2005 second – fourth quarter
Source: OMEL, Nord Pool, PolPx
Analysis of electricity energy prices change tenden-cies on European power exchange shows that in 2005 prices for electricity in Scandinavian countries changed independently from electricity prices in other European countries, but lower prices in these countries represented that power producers from Northern countries are com-petitive on European electricity market. Of course, elec-tricity market in Northern countries in comparison with markets in other countries was not attractive to market players looking for arbitrage profit because prices in Northern European countries had small fluctuations.
Italian power exchange GME started the operation in 2005 and price for electricity energy each day was twice higher than price on the other power exchanges. If in 2005 average annual electricity energy price at GME fluctuated about 58 EUR/MWh, then prices for electricity at wholesale power market was about 30 EUR/MWh in Scandinavia and Poland.
Calculated French electricity price variation coeffi-cient for 2005, which describes electricity energy price fluctuation within one day and deviation of this price from average price for analysed time period, reached 41.6%, i.e. price variation was very high because it
ex-ceeded allowed 30% limit. Variation coefficients, which describe price variation of electricity on power exchanges in Northern Europe (NORD POOL), Poland (GIELDA Energii), Germany (EEX) and Spain (OMEL), are repre-sented in Figure 2.
10,2 6,0
40,8 41,6
23,8
0 5 10 15 20 25 30 35 40 45
%
NORD POOL GIELDA Energii
EEX POWERNEXT OMEL
Figure 2. Price variation coefficients for 2005 in European power exchanges
ex-change is not attractive, and instead of this long term elec-tricity buying–selling contracts are signed. Being aware of the fact that today’s business environment is dynamic, stipulating not only unexpected loses but giving more addi-tional possibilities for business objects, avoidance of risk is not the best choice. Pursuing to use additional business possibilities a viewpoint “avoid risk” should be changed to “manage risk”. Looking to manage risk of electricity price fluctuation, in some countries (e.g. Northern European power exchange NORD POOL, German energy exchange EEX) on power markets financial products, such as op-tions, forwards, future contracts, contracts for difference, are offered. In the future, if indetermination in markets grows, the importance of these contracts should grow. If in 1996 Northern European power exchange trade on finan-cial products consisted of 43 TWh, in 2004 trade volume at financial NORD POOL market consisted of 590 TWh but 429 TWh less than in 2002.
Of course, national electricity energy market penetra-tion by foreign companies is a very important factor for
the creation of internal European electricity energy mar-ket. But at this time foreign suppliers have less than 20% of market share (European Community Commission, 2004), and trade of electricity energy among countries is only 8% of all electricity produced.
After the problems faced at wholesale electricity en-ergy market are discussed, correlation analysis of whole-sale electricity prices, formed along European countries, is performed in this paper.
Analysis of electricity energy price interde-pendence relation along European countries
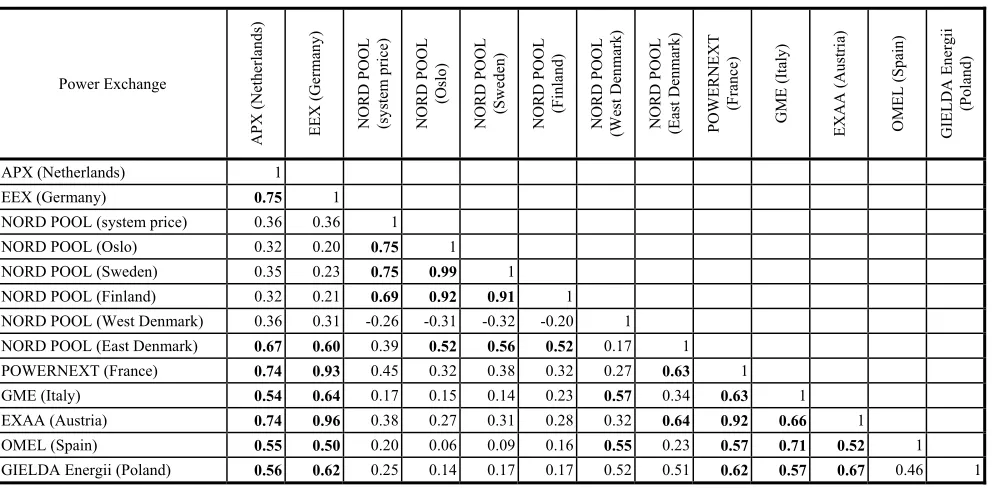
If the assumption is made, that price fluctuation for electricity is stimulus for market participants to start to trade on foreign electricity market, and existing transmis-sion networks, which connect national electricity energy markets, are basis for trade, the interrelations of prices are to be analyzed. Correlation results are represented in Table 1.
Table 1
Electricity energy price correlation coefficients on European countries’ electrical energy wholesale market
Power Exchange
APX (Nether
lands
)
EEX
(Ge
rm
an
y)
NORD P
OOL
(s
ystem
pr
ice)
NORD P
OOL
(Oslo
)
NORD P
OOL
(S
weden)
NORD P
OOL
(Finland)
NORD P
OOL
(West Den
m
ark)
NORD P
OOL
(E
ast Denm
ar
k)
POWERNE
X
T
(Fran
ce
)
GME
(It
aly
)
EXAA
(Au
stri
a)
OME
L
(
S
pain)
GIE
L
DA Energii (Poland)
APX (Netherlands) 1
EEX (Germany) 0.75 1
NORD POOL (system price) 0.36 0.36 1 NORD POOL (Oslo) 0.32 0.20 0.75 1 NORD POOL (Sweden) 0.35 0.23 0.75 0.99 1 NORD POOL (Finland) 0.32 0.21 0.69 0.92 0.91 1 NORD POOL (West Denmark) 0.36 0.31 -0.26 -0.31 -0.32 -0.20 1
NORD POOL (East Denmark) 0.67 0.60 0.39 0.52 0.56 0.52 0.17 1 POWERNEXT (France) 0.74 0.93 0.45 0.32 0.38 0.32 0.27 0.63 1
GME (Italy) 0.54 0.64 0.17 0.15 0.14 0.23 0.57 0.34 0.63 1
EXAA (Austria) 0.74 0.96 0.38 0.27 0.31 0.28 0.32 0.64 0.92 0.66 1 OMEL (Spain) 0.55 0.50 0.20 0.06 0.09 0.16 0.55 0.23 0.57 0.71 0.52 1 GIELDA Energii (Poland) 0.56 0.62 0.25 0.14 0.17 0.17 0.52 0.51 0.62 0.57 0.67 0.46 1
Table 1 represents correlation coefficient of electric-ity energy prices between different European countries in 2005. In most cases it is lower than |0.5| or exceeds |0.5| by small value, so it is possible to maintain that electric-ity energy prices in different European countries changes differently, and in some cases prices in one country change totally independently from price changes in other European country.
It could be observed, that from price value, two big electricity energy regional markets in Europe are being formed. They are Northern European countries’ electric-ity energy market and Western European countries’ elec-tricity energy market. Western European market includes Germany, Netherlands, France, and Austria. Market par-ticipants from Sweden, Norway, Finland, and Denmark most likely trade in Northern Europe countries’ electric-ity energy market.
Western Denmark might be assigned to the countries which have no impact on electricity energy price changes in other European regions. Price correlation coefficients, showing low Western Denmark electricity energy price impact on other European regions prices, ranges from |-0.32| to |0.57|.
It should be mentioned that for Western Denmark wholesale electricity energy market exclusive attribute is noted. Electricity energy prices change in opposite to Northern European countries electricity prices. Further-more, a price for electricity energy in Western Denmark fluctuates similarly to Italian or Spain electricity energy prices.
participating in Northern European power exchange close interdependence relation between changes is characteris-tic to prices. This statement could be based on determined correlation coefficients which are close to 1.
In the most similar way prices of electricity energy market changed in Sweden and Norway (correlation coef-ficient was |0.99|). It could be stated that 97.6% of tricity price change in Sweden may be explained by elec-tricity price change in Norway, and 2.4% of elecelec-tricity price change in Sweden is caused by other factors.
Moreover, close coherence between electricity en-ergy price change in Sweden and Finland existed in 2005. Correlation coefficient is |0.91|. This high electricity price interdependence coherence may be explained by import and export volume: in 2005 Sweden was net elec-tricity energy exporter (exports exceeded imports by 7.5 TWh), when Finland was the biggest net electricity en-ergy importer in Scandinavian countries, where imports of electricity energy exceeded exports by 17 TWh.
It could be mentioned, that electricity energy price correlation coefficient between Oslo and Finland is very high (|0,92|), and this shows that close interdependence relation exists among electricity energy prices in Oslo, its regions and Finland, and price change may be defined by linear dependence. This price dependence is caused by trade: producers of electricity energy in one country may reach electricity energy consumer in other country, be-cause Northern European countries’ national electricity markets contain well developed electricity transmission network infrastructure, so the rise of electricity energy price in one market cause the rise of electricity price in another market. In addition, Norway and Finland keep different positions on the market: Finland is importer of electricity energy and Norway is exporter, which in 2005 sold in foreign markets 12 TWh more electricity than bought from the markets of other countries.
Although Sweden, Denmark, Norway, and Finland create similar electricity market price level as compared to Northern European countries, this market is rather isolated from other European countries electricity energy markets. Correlation coefficients reflecting Northern European countries and other European countries’ inter-dependence of electricity prices are not significant and range from |0.06| to |0.57|.
One of the reasons why prices interdependence rela-tion between Scandinavian and European countries is so low is this that some national markets are geographically remote, so electricity energy transportation costs grow up, and international trade volume may become low. For example, electricity energy price correlation between Spain and Scandinavian countries was low, because in 2005 Spain bought only 3.7% of all electricity energy consumed from foreign producers. Spain’s requests for electricity may be fulfilled by geographically closer elec-tricity markets. Spain’s market players could purchase electricity energy from French producers, who in 2005 produced 78.5% of all electricity energy in nuclear power-stations (Inetrnational Energy Agency, 2005). But the analysis of correlation shows that very weak interde-pendence relation between electricity energy prices in Spain and France exists. Relation between Spanish elec-tricity energy market and other elecelec-tricity energy markets
is minimal (correlation coefficients fluctuate about |0.55|). A little bit stronger relation is between electricity price in Spain and Italy (correlation coefficient reaches |0.71|). Calculated determination coefficient shows that only 51% of electricity price change in Spain may be caused by electricity price change in Italy and other fac-tors may influence even 49% of price change in Spain.
Although Polish prices of wholesale electricity en-ergy market in comparison with Western Europe coun-tries corresponding prices in average are lower, and in its value is close to Northern countries’ wholesale prices, calculated correlation coefficients show that electricity price change in Poland is better reflected by change of prices in Western Europe. Correlation coefficients show-ing relation of electricity prices in this country with prices in other countries are small and range from |0.56| to |0.67|. By the growth of Polish and other European countries’ electricity energy market integration prices in Poland should grow, because there will be demand of cheap electricity from this country.
The second big electricity market in Europe that is being formed and in which prices on national electricity energy markets are closely related is Holland-French-German-Austrian regional power market. Strong Austrian electricity energy price dependence upon changes of Ger-man and French electricity prices reflecting correlation coefficients reach |0.96| and |0.92| respectively. It seems likely that in the future electricity energy prices in Aus-tria will be determined by changes of spot prices in other European countries, because since 2001 Austria has be-come a net electricity importer and electricity energy import volume is further increasing. Net electricity im-port rose from 0.1 TWh in 2001 to 2.7 TWh in 2005. Referring to International Energy Agency (2003, 2005) delivered statistical data, calculated proportion of Aus-trian imported-consumed electricity amount, it may be stated that Austrian’s dependence upon foreign electricity will increase, because the value of imported and con-sumed electricity energy proportion has been historically growing: in 2000 Austria imported 24.25% of all electric-ity consumed, and in 2005 proportion of imported and consumed electricity quantity grew to 30.70%.
Adjustment of additive regression models to evaluate interdependence relation of price change in Europe
Though performed correlation analysis showed that relation between changes of electricity energy prices in Europe existed, calculated determination coefficient proved that strength of interdependence relations between electricity energy prices is quite low, because price change in one country has a very low impact on electric-ity energy price change in other country.
Results of regressive analysis are shown in Table 2.
Table 2
Results of electricity energy prices interdependence evalua-tion in European countries using additive regressive model
Regression model1 Determina-tion
coeffi-cient %
Approxi-mation error % y1=11.17+0.33x2+0.25x3+0.30x4 58.0 19.0
y2=-0.47+0.04x1+0.71x3+0.26x4 93.6 4.3
y3=3.63+0.03x1+0.72x2+0.18x4 92.8 4.3
y4=-1.69+0.08x1+0.55x2+0.36x3 87.2 7.1
y5=0.98+0.89x6+0.07x7+0.01x8-0.01x9 97.9 0.9
y6=1.53+0.94x5+0.03x7-0.03x8+0.02x9 98.0 0.9
y7=-11.48+0.42x6+0.89x5+0.09x8 85.4 2.2
y8=63.69+0.48x5-2.06x6+0.56x7+0.23x9 31.7 6.5
y9=-64.25-4.17x5+6.27x6-0.04x7+0.83x8 47.8 9.2
With reference to created regressive models it might be stated that if electricity energy price in Germany, Aus-tria and France rose by 1 EUR/MWh, electricity energy price in Netherlands would increase by 12.05 EUR/MWh: because of electricity energy price change in Germany, electricity energy price in Netherlands would increase by 0.33 EUR/MWh; rise of electricity energy price in Aus-tria and France would cause price increase in Netherlands by 0.25 EUR/MWh and by 0.30 EUR/MWh respectively; other factors would increase electricity energy price in Netherlands by 11.17 EUR/MWh. So, a conclusion could be made that the strongest impact on electricity energy price in Netherlands has electricity energy price fluctua-tions in Germany.
The created regressive model of electricity energy price of three variables’s for a price formed in France is similar to German model. Electricity energy price in France may be represented by changes of electricity en-ergy prices in Netherlands, Germany and Austria very well. Electricity energy price fluctuations in these coun-tries may define 87.2% of electricity energy price change in France and 12.8% of all price change is defined by others in this model not evaluated factors. These factors determine the fall of electricity price in France by 1.69 EUR/MWh. Even rise of 0.55 EUR/MWh on electricity energy price in France may be caused by price rise of 1 EUR/MWh in Germany, and price rise of 0.08 EUR/MWh is determined by prise increase in Nether-lands. Because electricity energy price in Germany strongly fluctuates (variation coefficient – 40.8% (Figure 1)) and the comparative weight of wholesale electricity energy price of this country in French electricity energy price model is high, the conclusion could be made that electricity price on power exchange POWERNEXT
1 y
1, x1 – electricity price in APX (Netherlands) EUR/MWh, y2, x2- electricity price in EEX (Germany)EUR/MWh, y3,x3- electricity price in EXAA (Austria) EUR/MWh; y4, x4- electricity price in POWERNEXT (France) EUR/MWh, y5, x5- electricity price for Oslo (NORD POOL) EUR/MWh, y6, x6- electricity price for Sweden EUR/MWh,
y7, x7- electricity price for Finland EUR/MWh, y8, x8- electricity price for West Denmark EUR/MWh, y9, x9- electricity price for East Denmark EUR/MWh.
strongly fluctuates as well. This statement may be based on calculated electricity energy price variation coefficient for France which in 2005 reached 41.6%.
Analysing interdependence relations of electricity energy wholesale prices in Scandinavian countries it may be stated that the most exact power price change evalua-tion could be done for Sweden. Even 98% of electricity energy price change in Sweden may be based on electric-ity energy price change in other Scandinavian countries. If spot price in Oslo, Finland and Denmark rose by 1 EUR/MWh then electricity price in Sweden would rise by 0.96 EUR/MWh. Other factors would raise electricity price in Sweden for 1.53 EUR/MWh. Common impact on power price in Sweden would be 2.49 EUR/MWh.
Regressive models which describes impact of spot prices on Sweden and Denmark shows that electricity energy prices in these regions in a big part are influenced by in this model underestimated factors. For example, in this model underestimated factors decreases energy price for 11.48 EUR/MWh in Finland and even for 64.25 EUR/MWh in East Denmark. In the Western Denmark in the model underestimated factors increases electricity energy price by 63.69 EUR/MWh, but created models are accurate (calculated approximation errors do not exceed 20% allowed accuracy level of the model), so models may be used describing in valuable expression interde-pendence price relations.
Close interdependence relation for electricity energy prices are characteristic, therefore conclusion can be drawn that electricity energy supply and demand fluctua-tions in a certain country and changes in macro economic environment of this country may have certain impact and repeat in electricity energy prices of other country.
Conclusions
With reference to performed analysis on electricity energy trade structure and electricity energy prices that were formed on European countries wholesale power markets in 2005 following conclusions might be drawn:
1. At the moment a big part of trade is performed at
forward market, but electricity trade volume, liquid-ity and a number of players on power exchange spot market are rising by the growth of number of prod-ucts offered at this marketplace variety.
2. Calculated variation coefficients for electricity
en-ergy prices that were formed at European power ex-changes showed that in 2005 the biggest electricity energy price fluctuation was on German (variation coefficient was 40.8%), and French (variation coef-ficient was 41.6%) power exchanges.
3. By electricity energy price fluctuation market
play-ers face prices fluctuation risk. Seeking to manage this risk, market players participate on financial products market which is created for market play-ers’ hedging purposes. In 2005 in Scandinavian countries 30% of all trade was performed on finan-cial products market, although electricity energy prices fluctuation coefficient was only 10.2%.
4. Performed correlation analysis of electricity energy
elec-tricity energy prices exists in these countries:
4.1. The changes of wholesale electricity energy
prices in Sweden are reflected in the best way by change of electricity energy price in Nor-way. Correlation coefficient reached |0.99|.
4.2. According to correlation analysis, Western
Denmark electricity energy prices are related by opposite dependence to other Scandinavian countries electricity energy prices: if price grow in Western Denmark, it is presumable that electricity energy prices in other Scandi-navian countries will fell down at that time. Electricity price change in Western Denmark was better characterised by changes of spot prices in Western Europe.
5. In Western Europe’s wholesale electricity energy
market (in Holland, France, Germany and Austria) change of electricity energy prices is closely re-lated. Correlation coefficients that show the inter-dependence relation of spot prices in these countries ranges from 0.74 to 0.96.
6. Calculated determination coefficients for Western
countries show that 92.2% of electricity energy change in German EEX power exchange is influ-enced by price change in Austria’s power exchange EXAA.
7. Created regressive model for Austrian EXAA spot
price shows that 92.8% of electricity price change may be influenced by price which is formed in Hol-land, Germany and France. Following the created model, if price on EEX rise by 1 EUR/MWh elec-tricity energy price on EXAA will rise by 0.72 EUR/MWh.
References
1. Bajapaj, P. Electricity Trading in Competitive Power Market: an Overview and Key Issues / P. Bajpaj, S. N. Singh // International Conference on Power Systems. Kathmandu, 2004.
2. Bartosevičienė, V. Ekonominė statistika: Mokomoji knyga. Kaunas: Technologija, 2001.
3. Boguslauskas, V. Ekonometrikos pagrindai. Kaunas: Technologija, 2004.
4. Boisseleau, F. European Electricity Market Design And Its Impact On Market Integration / F. Boisseleau, Ch. Hewicker. 2004, Septem-ber. Prieiga per internetą: <http://www.dauphine.fr/cgemp/Equipe/ CV /CVBoisseleauPUBLI.htm.>
5. Botterud, A. Futures and Spot Prices – an Analysis of the Scandina-vian Electricity Market / A. Botterud, A. K. Bhattacharyya, M. Ilic // Proceedings 34 th Annual North American Power Symposium (NAPS’02). 2002, October. Prieiga per internetą: <http:// web.mit.edu/ilic/www/papers_pdf /futuresandspotprices.pdf>
6. Capgemini. European Energy Markets Observatory. 7 th. ed. 2005, October. Prieiga per internetą: http://www.de.capgemini.com/presse/ pressemitteilungen/archiv_2005/eemo/
7. Cocker, T. Regulatory Aspects of Electricity Trading in Europe / T. Cocker, J. J. ALBA RIOS, Ch. Arnoult. Brussels, 2003.
8. ECON ANALYSIS AB. Emission Trading and Power Prices. 2004, May. Prieiga per internetą: <http://ceps01.link.be/files/Rapport2004-020ENG.pdf>
9. Hermansson, J. Hedging Strategies and Price Spikes in the Electricity Market / J. Hermansson, J. Westberg. Goteborg University, School of Economics and Commercial Law, 2001.
10. Higgs, H. Modelling Spot Prices in Australan Wholesale Electricity Market / Higgs H., Worthington A. 2006.
11. International Energy Agency. Oil, Gas, Coal And Electricity Quartely Statistics. OECD, 2005, p. 538-546.
12. International Energy Agency. Oil, Gas, Coal And Electricity Quartely Statistics. OECD, 2003, p. 528-536.
13. Ispanijos energijos birža. Prieiga per internetą: <http://www.omel.es/ frames/en/index_eng.jsp>
14. Joskow, P. L. Electricity sector restructuring and competition: lessons learned. 2003, August.
15. Layton, B. Market Design Report. International Practice Rewiew Paper. 2005, August. Prieiga per internetą: <http:// www.electricitycommission.govt.nz/opdev/wholesale/marketdesign> 16. Lemming, J. Risk Management in Liberalized Electricity Markets.
Ph. D. Thesis No. 123. Technical University of Denmark, Departa-mento of Mathematical Modelling, 2003.
17. Lenkijos energijos birža. Prieiga per internetą: <http://www.polpx.pl/ main.php?index=223&show=38&lang=en&okres=dzien&s_data=03 %2F05%2F2006>
18. Liberali elektros energijos rinka. Pagrindiniai principai. 2003, balan-dis. Prieiga per internetą: <http://www.ekostrategija.lt/ index.php? content=pages&lng=lt&page_id=31&news_id=62>
19. Lietuvos laisvosios rinkos institutas. Energetikos politika: priemonės, galimybės ir kryptys. Vilnius, 2005, lapkritis. Prieiga per internetą: <http://www.lrinka.lt/index.php/82>
20. Lietuvos Respublikos ūkio ministerija. Tiekimo saugumas Lietuvos elektros energijos rinkoje. Vilnius, 2005.
21. Lundberg, G. Emerging European Electricity Markes / G. Lundberg, J. Antczak, Appesbacher. Brussels, 1999.
22. Nord Pool Spot AS. Trade at the Nordic Spot Market. 2006, March. Prieiga per internetą: <http://www.nordpool.com/nordpool/spot/ in-dex.html>
23. OXERA. Electricity Liberalisation Indicatos In Europe. 2001, Octo-ber. Prieiga per internetą:
<http://www.eu.int/comm/energy/electricity/publications/doc/oxera_s ummary.pdf>
24. Preliminary Report – Electricity. 2006, February. Prieiga per inter-netą: <http://www.elecpor.pt/page.aspx?idCat=13&idMasterCat =11&idLang=1>
25. Roy, P. V. Opening of the European Market for Electricity / P. V. Roy, G. Belmans, G. Peppermans. Belgium, 2000, June. Prieiga per internetą: <www.econ.kuleuven.ac.be/public/ndaaf52/>
26. Slovėnijos energijos birža. Prieiga per internetą: <www.borzen.si> 27. Šiaurės Europos energijos birža. Prieiga per internetą:
<www.nordpool.com>
Viktorija Bobinaitė, Aldona Juozapavičienė, Vytautas Snieška
Elektros energijos kainų Europos didmeninėje elektros energijos rinkoje tarpusavio ryšio analizė
Santrauka
Elektros rinkų restruktūrizavimas ir dereguliavimas Europoje są -lygoja elektros energijos kainų kaitą. Atlikta mokslinės literatūros analizė atskleidė, kad elektros energijos kainoms būdingas ne tik sezoniškumas, bet jos svyruoja paromis, valandomis. Joskow (2003), Higgs ir Worthington (2006) teigimu, elektros energijos paklausos elastingumas yra žemas, o esant didelei elektros paklausai pasiūla tampa neelastinga. Todėl, elektros energijos kainos staiga pakyla ir netrukus grįžta į savo įprastą lygį.
Elektros energijos kainos, susiformavusios Europos didmeninėse elektros energijos rinkose, jų kaita ir tarpusavio ryšiai nagrinėjami ir Boisseleau and Hewicker (2004) darbuose. Šie autoriai analizuoja didmenines elektros energijos kainas, susiformavusias skirtingose Europos prekybos vietose, t. y. nagrinėja kainas biržinėje ir užbiržinėje rinkose.
Prekiaujant biržoje, kainos neatidėliotinoje rinkoje formuojamos skaidriai ir dažniausiai nustatomos vienpusiame aukcione kiekvienai ateinančios paros valandai, atsižvelgiant į šios dienos pirkėjo ir par-davėjo pateiktus kainos-kiekio pasiūlymus. Palyginti su prekyba užbiržinėje OTC rinkoje, kur sutartos kainos nėra viešai skelbiamos visiems rinkos dalyviams, prekyba biržoje taip pat turi tam tikrų
gali būti aukštesni nei kitose rinkose, pavyzdžiui, aukštesni nei kaštai dvišalių kontraktų rinkoje.
Boisseleau ir Hewicker (2004) atlikta 2002 m. didmeninių elek-tros energijos kainų kitimo tarpusavio priklausomybės analizė
parodė, kad Europoje 2002 m. egzistavo glaudus koreliacinis ryšys tarp elektros energijos kainų, susiformavusių biržoje ir prekiaujant pagal dvišales sutartis nebiržinėje (OTC) rinkoje.
Hermanson, Westberg (2001) atlikta elektros energijos Skandi-navijos šalyse analizė parodė, kad prekyba elektros energija pagal dvišales elektros energijos pirkimo ir pardavimo sutartis gali būti pakeičiama prekyba energijos biržoje. Vadinasi, elektros energijos kainos svyravimai neatidėliotinoje elektros energijos rinkoje biržoje glaudžiai koreliuoja su elektros energijos kainos svyravimais OTC rinkoje. Elektros energijos kainų vienodumą prekiaujant skirtingose tos pačios šalies rinkose sąlygoja išplėtota elektros tinklų infrastruk-tūra bei arbitražinio pelno gavimo galimybės. Europos Komisijos (2006) teigimu, 2005 m. elektros energijos, parduodamos Vokietijos energijos biržoje EEX ir šios šalies užbiržinėje rinkoje, kainų kitimas yra glaudžiai susijęs, o koreliacijos koeficientas artimas 1.
Kaip ir visais prekybos elektros energija organizavimo atvejais, prekiaujant energijos biržoje susiduriama su tam tikrais sunkumais. Kai kurių šalių biržos neatidėliotina rinka nėra likvidi, prekybos apimtys yra mažos. Prancūzijos energijos biržoje POWERNEXT 44 % visos suvartotos elektros energijos buvo įsigyta neatidėliotinoje elektros energijos rinkoje. Viena galimų tokios žemos prekybos biržoje priežasčių ta, kad 30 % visos elektros energijos rinkos šioje šalyje dar nėra atverta konkurencijai. 2004 m. šiame rinkos segmente buvo suvartota 143,2 TWh elektros energijos.
Likvidžiausia elektros energijos rinka yra Ispanijos energijos biržoje OMEL. Šioje rinkoje 2005 m. buvo suprekiauta 223,3 TWh elektros energijos. Pagrindinė tokio aukšto likvidumo priežastis – dalyvavimas biržoje yra privalomas.
Ganėtinai aukštas likvidumas yra Šiaurės Europos energijos biržoje NORD POOL ir Vokietijos energijos biržoje EEX. Aukštą
likvidumą užtikrina rinkos atvėrimo konkurencijai laipsnis bei infor-macijos prieinamumas. Šie veiksniai teigiamai veikia rinkos dalyvių
skaičiaus augimą. 2004 m. didžiausioje Europos energijos biržoje NORD POOL veikė net 364 dalyviai, arba 87 daugiau nei 2001 m. Vokietijos EEX energijos biržoje 2004 m. veikė 123 dalyviai, o 2003 m. buvo 112 dalyvių (Capgemini, 2005).
Kita vertus, likvidumas elektros energijos biržoje yra žemas, o pardavimų apimtys mažos, nes, kintant elektros energijos paklausai valandomis, elektros energijos kaina taip pat svyruoja. Elektros ener-gijos kainų didmeninėje rinkoje kitimo tendencijos pateiktos 1 pav.
Elektros energijos kainų Europos energijos biržose kaitos tendencijų analizė rodo, kad 2005 m. elektros energijos kainos Skandinavijos šalyse kito nepriklausomai nuo elektros energijos kainų kitose Europos šalyse, tačiau mažesnės elektros energijos kainos šiose šalyse rodė, jog Šiaurės šalių elektros energijos gaminto-jai Europos elektros energijos rinkoje būtų konkurencingi. Žinoma, Šiaurės Europos šalių elektros energijos rinka, palyginti su kitų šalių
rinkomis, nebuvo patraukli arbitražinio pelno ieškojusiems rinkos dalyviams, nes kainos Šiaurės Europos biržoje mažai svyravo.
Apskaičiuotas 2005 m. Prancūzijos elektros energijos kainos vari-acijos koeficientas, kuris apibūdina elektros energijos kainų svyravimą
per parą ir šių kainų nukrypimą nuo nagrinėjamo laikotarpio vidutinio elektros energijos kainos lygio, siekė 41,6 %, t. y. kainų variacija yra labai didelė, nes viršija leistiną 30 % ribą. Elektros energijos kainos svyravimą apibūdinantis variacijos koeficientas Šiaurės Europos (NORD POOL), Lenkijos (GIELDA Energii), Vokietijos (EEX) ir Ispanijos (OMEL) energijos biržose pateiktas 2 pav.
Laikantis prielaidos, kad elektros energijos kainos svyravimas yra stimulas rinkos dalyviams pradėti prekiauti užsienio šalių elektros energijos rinkose, o perdavimo tinklų, jungiančių nacionalines elek-tros energijos rinkas, egzistavimas sudaro pagrindą prekiauti elektros energija, darbe buvo analizuojami kainų, susiformavusių nacion-alinėse elektros energijos rinkose, tarpusavio koreliaciniai ryšiai. 13 Europos regionų elektros energijos vidutinių paros kainų kaitą nusako laiko eilutės. Kiekvienai laiko eilutės reikšmei daro įtaką daugybė
veiksnių. Siekiant sudaryti adityvinius regresijos modelius, kurie nustatytų, kokią įtaką vienos šalies elektros energijos kainoms turi elektros energijos kainos pokyčiai kitoje šalyje, darbe įvertinama trendo, sezoniškumo ir atsitiktinės paklaidos dėmenųįtaka kiekvienai laiko eilutės reikšmei.
1 lentelėje pateikti elektros energijos kainų koreliacijos koefi-cientai tarp skirtingų Europos šalių 2005 m. daugeliu atvejų buvo mažesni už |0,5| arba viršijo |0,5| labai nežymiai, todėl galima teigti, kad elektros energijos kainos skirtingose Europos šalyse kito nevie-nodai, o kai kuriais atvejais kainos vienoje šalyje kito visiškai neprik-lausomai nuo kainų kitimo kitoje Europos šalyje.
Galima pastebėti, kad kainų dydžio atžvilgiu, Europoje formuo-jasi dvi didelės elektros energijos regioninės rinkos – tai Šiaurės Europos šalių elektros energijos rinka ir Vakarų Europos elektros energijos rinka. Vakarų Europos elektros energijos rinka jungia Vokietiją, Olandiją, Prancūziją, Austriją. Šiaurės Europos šalių elek-tros energijos rinkoje prekiaujama tarp Švedijos, Norvegijos, Suomi-jos ir DaniSuomi-jos. Atlikta elektros energiSuomi-jos kainų Skandinavijos šalių
didmeninėse rinkose koreliacinė analizė parodė, kad esama elektros energijos kainų kaitos šiose šalyse tarpusavio ryšio. Geriausiai did-meninės elektros energijos kainos kaitą Švedijoje nusako elektros energijos kaita Norvegijoje. Koreliacijos koeficientas siekė |0,99|. Vakarų Danijos elektros energijos kainos susietos atvirkštine priklau-somybe su kitų Skandinavijos šalių elektros energijos kainomis: didėjant kainoms Vakarų Danijoje, elektros energijos kainos kitose Skandinavijos šalyse mažėjo. Vakarų Danijos elektros energijos kainos kaitą geriau nusakė elektros energijos kainų kaita Vakarų
Europoje. Vakarų Europos didmeninėje elektros energijos rinkoje glaudžiai susijusi elektros energijos kainų kaita Olandijoje, Prancū zi-joje, Vokietijoje ir Austrijoje. Koreliacijos koeficientai, rodantys šių
šalių kainų tarpusavio ryšį, svyruoja nuo 0,74 iki 0,96. Apskaičiuoti determinacijos koeficientai Vakarų Europos šalims rodo, kad 92,2 % elektros energijos kaitos Vokietijos EEX biržoje veikia elektros energijos kaita Austrijos energijos biržoje EXAA. Sudarytas regresi-jos modelis Austriregresi-jos EXAA elektros energiregresi-jos kainai rodo, kad 92,8 % elektros energijos kaitai gali daryti įtaką kainos, susiformavusios Olandijoje, Vokietijoje ir Prancūzijoje. Pagal sudarytą modelį, kainai EEX pakilus 1 EUR/MWh, elektros energijos kaina EXAA pakiltų
0,72 EUR/MWh.
Raktažodžiai: energijos birža, didmeninė elektros kaina, koreliacija, adity-vinis regresijos modelis.
The article has been reviewed.