ISSN 0015–5659 www.fm.viamedica.pl
Address for correspondence: T. Ertekin, PhD, Ass. Prof., Department of Anatomy, University of Erciyes, School of Medicine, Kayseri, 38039, Turkey, tel: +90 505 6482854, fax: +90 352 437 52 85, e-mail: tolga.ertekin@yahoo.com.tr
Age-related changes of nasal cavity and conchae
volumes and volume fractions in children:
a stereological study
T. Ertekin
1, M. Değermenci
1, M. Nisari
1, E. Unur
1, A. Coşkun
21Department of Anatomy, University of Erciyes, Kayseri, Turkey 2Department of Radiology, University of Erciyes, Kayseri, Turkey
[Received: 28 May 2015; Accepted: 11 June 2015]
Background: The anatomy of the human nasal cavity (NC) is complex and its structures are closely related to the functions of the NC. Studies which assessing the mean volumes of NC and conchae are very infrequent. The purpose of current study is to investigate development of NC and conchae according to age and sex by using stereological method.
Materials and methods: This retrospective volumetric study was carried out on 342 individuals (166 females and 176 males) between 0 and 18 years old with no pathological conditions or medical procedures that affected the skeletal morphology of the NC. Volumetric estimations were determined on computed tomography (CT) images using point-counting approach of stereological methods. Results: NC, inferior nasal conchae (INC) and middle nasal conchae (MNC) volume measurements that obtained using point-counting method were increased with age in both sexes until 15 years old. Regardless of gender; no significant difference was determined between the left and right values for NC, conchae volumes and choanae measurements. Generally, significant differences were determined in NC and INC volumes according to gender after they reached maximum growth period. According to age the volume ratios of INC to NC and MNC to NC were ranged from 18% to 32% and 9% to15%, respectively.
Conclusions: The current study demonstrated that the point-counting method is effective in determining volume estimation of NC and is well suited for CT studies. Our results could provide volumetric indexes for the NC and conchae, which could help the physician for both patient selections for surgery, and for the assessment of any surgical technique used to treatment of nasal obstruction. (Folia Morphol 2016; 75, 1: 38–47)
Key words: nasal cavity, stereology, volume, computed tomography
INTRODUCTION
Nasal cavity (NC) is the first part of the respiratory system. This cavity opens anteriorly through the nos-tril and communicates posteriorly with nasopharynx through the choanae. NC is divided by nasal septum into right and left sides. The lateral walls on each
to these features it affects the voice by functioning as a resonating chamber. Conchae have a dynamic structure. This enables them to adjust the flow rate and volume of the air inhaled. Conchae increase the surface area that the air comes into contact with to achieve this function [23].
Nasal airway plays an important role in the normal craniofacial development [44, 45]. Animal studies revealed that nasal obstruction could cause maloc-clusion and craniofacial deformities and when na-sal obstruction was removed, the malocclusion and craniofacial structural plane angles could be partially reversed [41, 45]. Nasal obstruction also cause sleep apnoea and hypopnoea [37] and snoring and nasal obstruction were the most common symptoms in a survey of children and adolescents with obstructive sleep apnoea–hypopnoea syndrome [16].
NC and its structures are of crucial importance for endoscopic sinus surgery, transverse maxillary deficiency, septal deformities and mucosal disease as -sociated with conchae hypertrophy [20, 26]. Conchae hypertrophy is one of the causes of nasal air passage obstruction and is usually observed in allergic rhinitis, vasomotor rhinitis and septal deviation (compensato-ry hypertrophy) [4, 28]. Clinicians have investigated size and structure of middle nasal conchae (MNC) and inferior nasal conchae (INC) [14, 23]. A variety of sur-gical techniques have been reported for the treatment of nasal obstruction. Potential complications of the treatment techniques applied are still on the agenda [20, 34]. Acoustic rhinometry, rhinomanometry and computed tomography (CT) may be used for assess-ing the morphometry of NC and a comparison of pre- and postoperative results in patients with nasal obstruction [4, 21, 22]. Terheyden et al. [39] took CT as gold standard in measuring NC parameters, and many studies [5, 38] applied CT in indicating nasal cross-sectional area, volume, and anatomy structures.
Changes of NC and its structures morphometry should be define before planning the treatment pro -cess. An understanding of age and sex related chang-es of NC structure would certainly assist the clinicians in deciding which surgical technique to utilise. Previ-ous studies have investigated size and morphometry of NC and its structures for the evaluation and the treatment of patients with nasal obstruction [14, 47]. The value of our study lies in the fact that only 1 study in the literature have investigated the volume of the NC, MNC and INC with CT images using
stereologi-investigated the volume changes of NC and volume fraction of the nasal conchae according to age and sex by using stereological method.
MATERIALS AND METHODS
This study was performed retrospectively on cor-onal scan images taken from 342 Turkish individuals (166 females and 176 males) aged between 0 and 18 years who had been admitted to Erciyes University Medical Faculty. Subjects for the present study were selected from a larger pool of individuals and were included in the analysis based on the absence of pathological conditions or medical procedures that affected the skeletal morphology of the NC. The CT images were examined to exclude the maxillofacial deformities, turbinate hypertrophy, severe nasal sep-tum deviation, adenoidal or tonsillar hypertrophy, and other related diseases like inflammation or tumour which could impact nasal airway morphology and anatomy. The present study was approved by the ethical committee of Erciyes University, Turkey.
CT procedure
We analysed the intact cranial CT images of all the subjects. The CT images were prepared using the following protocol. The coronal CT scans of cranial images were obtained using a CT scanner (Multislice 16 detector GE) applying the following parameters: 120 kV, 130 mAs, field of view: 24–25 cm, section time: 2.7 s, slice thickness: 0.6 mm. CT images were taken from coronal plan from Picture Archive and Communication System (PACS).
Cavalieri principle applied to CT sections and stereological analysis
superimposed, randomly covering the entire image frame (Fig. 1). The points hitting the ROI-sectioned surface area were counted for each section and the volumes of NC, MNC and INC were estimated using the modified (Eq. 1) for volume estimations of radiol ogical images shown below [11, 32, 33].
(Eq. 1)
Where ‘t’ is the section thickness of consecutive sec-tions, ‘SU’ is the scale unit of the printed film, ‘d’ is the distance between the points of the grid, ‘SL’ is the measured length of the scale printed on the film. ‘∑P’ is the total number of points hitting the sectioned cut surface areas of region of interest [13, 32, 33].
In addition to the volume measurements; the length and width of the posterior choanae were de-termined bilaterally on coronal CT images (Fig. 2).
Volume fraction estimation
Volume is a simple and very widely used param-eter in biomedical science [24]. It is used to express the proportion of a phase or component within the whole structure. The volume fraction of an X phase within a Y reference volume is simply expressed as follows (Eq. 2):
(Eq. 2)
Where the ‘Vv (X, Y)’ indicates volume fraction of X phase within the Y reference volume. Volume fraction rates change between 0 and 1 and is often expressed as a percentage [19].
The volume fraction of a phase can be estimated by means of the Cavalieri principle on radiological im-ages using point-counting approach [25]. The volume fraction formula with the point-counting grid can be written as following Eq. 3.
(Eq. 3)
Where ‘SPx’ indicates the number of points hitting the X phase and ‘SPy’ the number of points hitting the reference space Y.
We estimated the volume fraction of the MNC and INC within the NC by means of volume fraction approach, i.e. the INC volume within the NC volume using the following formula (Eq. 4).
= (Eq. 4)
Where, ‘SPinferior nasal conchae’ is the total number of points hitting the components of INC and ‘SPnasal cavity’ is the total number of points hitting sectioned surface of NC including all parts.
The volume fraction of the INC volume within the NC was estimated as:
Figure 1. Estimation of nasal cavity and its structures on coronal computed tomography images by superimposing randomly the point-counting grid.
V = t × SU × d
[
SL]
2×S
PVv (X, Y) = Volume of X phase in Y reference space Volume of Y reference space
Vv (X, Y) = SSPxPy
Vv (inferior nasal conchae, nasal cavity) =
SP inferior nasal conchae
SP nasal cavity
Vv (inferior nasal conchae, nasal cavity)=
= SP inferior nasal conchae =
SP nasal cavity
0.17 cm3
0.90 cm3= 0.18 = 18% Figure 2. Estimation of choanae on coronal computed tomography images; SS — sphenoidal sinus.
The coefficient of error for point-counting
in previous study [17]. A lower CE value than 5% is an acceptable range according to the literature. It is important to note that the CE has no real biological meaning. Rather, it is most useful for evaluating the precision of stereological estimates. It is also impor-tant to note that an appropriate grid size and the number of slices required for volume estimation of an object are crucial at the beginning [32].
Statistical analysis
The comparing of the volume results between the genders were analysed using the independent t test and the comparing of the volume results between right and left NC and its structures were analysed using pair samples t test. The estimation of the effects of aging on the size of the NC and its structures was applied using Pearson correlation test. Results have been expressed as the number of observations and mean ± standard deviation (SD). A p value less than 0.05 was considered as statistically significant. All statistical analyses were performed with the Statisti-cal Package for the Social Sciences software (Version 16.0; SPSS, Chicago, IL, USA).
RESULTS
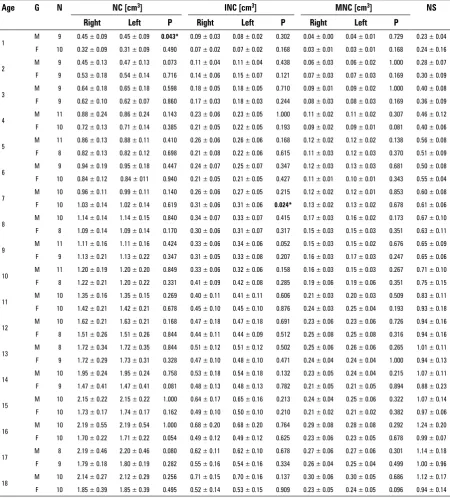
The NC, MNC and INC and nasal septum volumes were shown in Table 1. When the bilateral values were compared, statistically significant differences were determined only in 1 and 7 years age groups in males and females for NC and INC, respectively (p < 0.05). Regardless of gender; no significant difference was determined between the left and right values for all of the parameters. Age-related changes in NC and its structures were in general similar and positive correla-tion was found between age and them. They reached adult dimensions at 15–18 years of age during the teenage years (Table 1, Fig. 3).
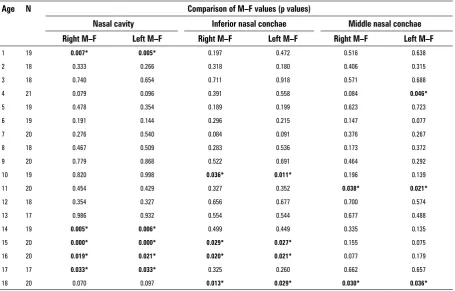
In addition, there were significant differences in the NC volume according to gender in five age groups (1, 14, 15, 16 and 17 years of age), for INC in four age groups (10, 15, 16 and 18 years of age) and for MNC in three age groups (4, 11 and 18 years of age) (Table 2). Generally significant differences were determined in NC and INC volumes according to gender after they reached maximum growth period and males had great-er values than females for all the parametgreat-ers. The mean of CEs for the estimation of NC, INC, MNC and nasal septum were 2%, 2.5%, 3% and 4%, respectively.
Our results show that the male choanal dimensions
left width: 5.5–15.7 mm; right height: 7.1–26.9 mm; left height: 6.2–26.9 mm and for females; right width: 5.2–14.7 mm; left width: 4.8–15.1 mm; right height: 6.1–25 mm; left height: 5.8–24.9 mm. Statistical analysis showed no statistically significant differences between left- and right-sided measurements. When the gender comparison was made, we didn’t find any significant difference, but male values were larger than females.
When the correlations between the NC, INC, MNC volume measurements and choanae values were sta-tistically analysed, a positive correlation was deter-mined between the results. Correlation values (r) for NC/choanae height (CH), INC/CH and MNC/CH were determined as 0.822, 0.763 and 0.755 for right, 0.828, 0.772 and 0.761 for left, respectively. In ad-dition, r values for NC/choanae width (CW), INC/CW and MNC/CW were found 0.747, 0.721 and 0.647 for right, 0.743, 0.724 and 0.687 for left, respectively (p < 0.001).
By the Cavalieri principle (point-counting) using coronal CT images, the volume ratios of INC to NC and MNC to NC were given (Fig. 4). According to age, the volume ratios of INC to NC and MNC to NC ranged from 18 to 32 and from 9 to 15, respectively. The development of MNC and INC exhibited faster growth than NC up to 3 years of age. After this age their developments were parallel.
DISCUSSION
Measuring structure, function, and volume of the NC is necessary for both patient selections for surgery, and the assessment of any surgical technique used to reduce the size of the conchae. At present, there is no consensus on the best method with which to objectively assess nasal obstruction in surgery. Rhin-omanometry gives a physiological measurement of nasal airflow as it measures the degree of obstruc -tion during normal breathing by measuring nasal
airflow and pressure [9]. Acoustic rhinometry gives an anatomical measure of the cross sectional area or volume of the NC during a breath hold and therefore it does not directly measure the ability of the patient to breathe through the nose. Its measurements are based on an algorithm, and the anatomy generated from acoustic measurements is still in dispute [10, 27]. Objective testing with both methods was considered but not used, commonly due to their questionable
Table 1. The mean volumes of bilateral nasal cavity calculated by using stereological method in both gender; *p < 0.05
Age G N NC [cm3] INC [cm3] MNC [cm3] NS
Right Left P Right Left P Right Left P
1 M 9 0.45 ± 0.09 0.45 ± 0.09 0.043* 0.09 ± 0.03 0.08 ± 0.02 0.302 0.04 ± 0.00 0.04 ± 0.01 0.729 0.23 ± 0.04 F 10 0.32 ± 0.09 0.31 ± 0.09 0.490 0.07 ± 0.02 0.07 ± 0.02 0.168 0.03 ± 0.01 0.03 ± 0.01 0.168 0.24 ± 0.16
2 M 9 0.45 ± 0.13 0.47 ± 0.13 0.073 0.11 ± 0.04 0.11 ± 0.04 0.438 0.06 ± 0.03 0.06 ± 0.02 1.000 0.28 ± 0.07 F 9 0.53 ± 0.18 0.54 ± 0.14 0.716 0.14 ± 0.06 0.15 ± 0.07 0.121 0.07 ± 0.03 0.07 ± 0.03 0.169 0.30 ± 0.09
3 M 9 0.64 ± 0.18 0.65 ± 0.18 0.598 0.18 ± 0.05 0.18 ± 0.05 0.710 0.09 ± 0.01 0.09 ± 0.02 1.000 0.40 ± 0.08 F 9 0.62 ± 0.10 0.62 ± 0.07 0.860 0.17 ± 0.03 0.18 ± 0.03 0.244 0.08 ± 0.03 0.08 ± 0.03 0.169 0.36 ± 0.09
4 M 11 0.88 ± 0.24 0.86 ± 0.24 0.143 0.23 ± 0.06 0.23 ± 0.05 1.000 0.11 ± 0.02 0.11 ± 0.02 0.307 0.46 ± 0.12 F 10 0.72 ± 0.13 0.71 ± 0.14 0.385 0.21 ± 0.05 0.22 ± 0.05 0.193 0.09 ± 0.02 0.09 ± 0.01 0.081 0.40 ± 0.06
5 M 11 0.86 ± 0.13 0.88 ± 0.11 0.410 0.26 ± 0.06 0.26 ± 0.06 0.168 0.12 ± 0.02 0.12 ± 0.02 0.138 0.56 ± 0.08 F 8 0.82 ± 0.13 0.82 ± 0.12 0.698 0.21 ± 0.08 0.22 ± 0.06 0.615 0.11 ± 0.03 0.12 ± 0.03 0.370 0.51 ± 0.09
6 M 9 0.94 ± 0.19 0.95 ± 0.18 0.447 0.24 ± 0.07 0.25 ± 0.07 0.347 0.12 ± 0.03 0.13 ± 0.03 0.681 0.50 ± 0.08 F 10 0.84 ± 0.12 0.84 ± 011 0.940 0.21 ± 0.05 0.21 ± 0.05 0.427 0.11 ± 0.01 0.10 ± 0.01 0.343 0.55 ± 0.04
7 M 10 0.96 ± 0.11 0.99 ± 0.11 0.140 0.26 ± 0.06 0.27 ± 0.05 0.215 0.12 ± 0.02 0.12 ± 0.01 0.853 0.60 ± 0.08 F 10 1.03 ± 0.14 1.02 ± 0.14 0.619 0.31 ± 0.06 0.31 ± 0.06 0.024* 0.13 ± 0.02 0.13 ± 0.02 0.678 0.61 ± 0.06 8 M 10 1.14 ± 0.14 1.14 ± 0.15 0.840 0.34 ± 0.07 0.33 ± 0.07 0.415 0.17 ± 0.03 0.16 ± 0.02 0.173 0.67 ± 0.10 F 8 1.09 ± 0.14 1.09 ± 0.14 0.170 0.30 ± 0.06 0.31 ± 0.07 0.317 0.15 ± 0.03 0.15 ± 0.03 0.351 0.63 ± 0.11
9 M 11 1.11 ± 0.16 1.11 ± 0.16 0.424 0.33 ± 0.06 0.34 ± 0.06 0.052 0.15 ± 0.03 0.15 ± 0.02 0.676 0.65 ± 0.09 F 9 1.13 ± 0.21 1.13 ± 0.22 0.347 0.31 ± 0.05 0.33 ± 0.08 0.207 0.16 ± 0.03 0.17 ± 0.03 0.247 0.65 ± 0.06
10 M 11 1.20 ± 0.19 1.20 ± 0.20 0.849 0.33 ± 0.06 0.32 ± 0.06 0.158 0.16 ± 0.03 0.15 ± 0.03 0.267 0.71 ± 0.10 F 8 1.22 ± 0.21 1.20 ± 0.22 0.331 0.41 ± 0.09 0.42 ± 0.08 0.285 0.19 ± 0.06 0.19 ± 0.06 0.351 0.75 ± 0.15
11 M 10 1.35 ± 0.16 1.35 ± 0.15 0.269 0.40 ± 0.11 0.41 ± 0.11 0.606 0.21 ± 0.03 0.20 ± 0.03 0.509 0.83 ± 0.11 F 10 1.42 ± 0.21 1.42 ± 0.21 0.678 0.45 ± 0.10 0.45 ± 0.10 0.876 0.24 ± 0.03 0.25 ± 0.04 0.193 0.93 ± 0.18
12 M 10 1.62 ± 0.21 1.63 ± 0.21 0.168 0.47 ± 0.18 0.47 ± 0.18 0.691 0.23 ± 0.06 0.23 ± 0.06 0.726 0.94 ± 0.16 F 8 1.51 ± 0.26 1.51 ± 0.26 0.844 0.44 ± 0.11 0.44 ± 0.09 0.512 0.25 ± 0.08 0.25 ± 0.08 0.316 0.94 ± 0.16
13 M 8 1.72 ± 0.34 1.72 ± 0.35 0.844 0.51 ± 0.12 0.51 ± 0.12 0.502 0.25 ± 0.06 0.26 ± 0.06 0.265 1.01 ± 0.11 F 9 1.72 ± 0.29 1.73 ± 0.31 0.328 0.47 ± 0.10 0.48 ± 0.10 0.471 0.24 ± 0.04 0.24 ± 0.04 1.000 0.94 ± 0.13
14 M 10 1.95 ± 0.24 1.95 ± 0.24 0.758 0.53 ± 0.18 0.54 ± 0.18 0.132 0.23 ± 0.05 0.24 ± 0.04 0.215 1.07 ± 0.11 F 9 1.47 ± 0.41 1.47 ± 0.41 0.081 0.48 ± 0.13 0.48 ± 0.13 0.782 0.21 ± 0.05 0.21 ± 0.05 0.894 0.88 ± 0.23
15 M 10 2.15 ± 0.22 2.15 ± 0.22 1.000 0.64 ± 0.17 0.65 ± 0.16 0.213 0.24 ± 0.04 0.25 ± 0.06 0.322 1.07 ± 0.14 F 10 1.73 ± 0.17 1.74 ± 0.17 0.162 0.49 ± 0.10 0.50 ± 0.10 0.210 0.21 ± 0.02 0.21 ± 0.02 0.382 0.97 ± 0.06
16 M 10 2.19 ± 0.55 2.19 ± 0.54 1.000 0.68 ± 0.20 0.68 ± 0.20 0.764 0.29 ± 0.08 0.28 ± 0.08 0.292 1.24 ± 0.20 F 10 1.70 ± 0.22 1.71 ± 0.22 0.054 0.49 ± 0.12 0.49 ± 0.12 0.625 0.23 ± 0.06 0.23 ± 0.05 0.678 0.99 ± 0.07
17 M 8 2.19 ± 0.46 2.20 ± 0.46 0.080 0.62 ± 0.11 0.62 ± 0.10 0.678 0.27 ± 0.06 0.27 ± 0.06 0.301 1.14 ± 0.18 F 9 1.79 ± 0.18 1.80 ± 0.19 0.282 0.55 ± 0.16 0.54 ± 0.16 0.334 0.26 ± 0.04 0.25 ± 0.04 0.499 1.00 ± 0.96
Figure 3. The volume values of the nasal cavity (NC), inferior nasal conchae (INC) and middle nasal conchae (MNC) according to age.
reliability and reproducibility. Kim et al. [22] com-pared nasal obstruction symptoms before and after decongestion with several parameters of objective tests. They determined that acoustic rhinometry and rhinomanometry results were inconsistent with pa-tients’ subjective assessment of nasal obstruction. They concluded that rhinomanometry and acoustic rhinometry may be of no diagnostic value in esti-mating the severity of nasal obstruction symptoms [22]. In addition, acoustic rhinometry is insufficient
for estimating the volume of the posterior part of the NC [21]. The volume of biologic structures can be estimated by combining the sectional radiolog-ic imaging techniques with the Cavalieri principle of stereological volume estimation as described in the previous studies [25, 32]. Stereological methods provide quantitative data on 3-dimensional struc-tures using 2-dimensional images. The Cavalier the-orem of systematic sampling in combination with point-counting is considered an unbiased, simple, inexpensive and efficient method and is ideally suit -able for estimating volumes on magnetic resonance (MR) and CT images [3, 7]. Volumetric analysis by CT and MR data using Cavalieri method are commonly used and its high rate of reproducibility and reliability has been verified in various studies [1, 2, 15]. Evalu -ation of the accuracy of acoustic rhinometry is more difficult because of the lack of a gold standard. Some researchers demonstrated that stereological results are very close to gold standard results in their studies [1, 3]. In addition, stereology method provides a CE of the measurement of the volume of the structure of interest. So it may be used to identify the optimal parameters of sampling needed to achieve a given precision such as we need the number of MR images
Table 2. The comparison of male–female (M–F) volume results (p values) for both sides in each groups; *p < 0.05
Age N Comparison of M–F values (p values)
Nasal cavity Inferior nasal conchae Middle nasal conchae
Right M–F Left M–F Right M–F Left M–F Right M–F Left M–F
1 19 0.007* 0.005* 0.197 0.472 0.516 0.638
2 18 0.333 0.266 0.318 0.180 0.406 0.315
3 18 0.740 0.654 0.711 0.918 0.571 0.688
4 21 0.079 0.096 0.391 0.558 0.084 0.046*
5 19 0.478 0.354 0.189 0.199 0.623 0.723
6 19 0.191 0.144 0.296 0.215 0.147 0.077
7 20 0.276 0.540 0.084 0.091 0.376 0.267
8 18 0.467 0.509 0.283 0.536 0.173 0.372
9 20 0.779 0.868 0.522 0.691 0.464 0.292
10 19 0.820 0.998 0.036* 0.011* 0.196 0.139
11 20 0.454 0.429 0.327 0.352 0.038* 0.021*
12 18 0.354 0.327 0.656 0.677 0.700 0.574
13 17 0.986 0.932 0.554 0.544 0.677 0.488
14 19 0.005* 0.006* 0.499 0.449 0.335 0.135 15 20 0.000* 0.000* 0.029* 0.027* 0.155 0.075 16 20 0.019* 0.021* 0.020* 0.021* 0.077 0.179 17 17 0.033* 0.033* 0.325 0.260 0.662 0.657
sections and the density of the point grid. Thus, the stereological method provides an opportunity for the investigator to make appropriate changes to their sampling or estimating procedures. If researchers obtain high CE, there are problems with accuracy of their results. So they may change parameters of sampling (the spacing of points in the grid or the
number of slices available in any MR imaging study) to provide a reasonable CE value [17, 32].
In literature, Thorstensen et al. [40] investigated nasal airway patency in asthmatics compared to non-asthmatic controls. Nasal cavity volume (NCV) was measured using acoustic rhinometry. The rhinometer was programmed for NCV0–3 and NCV3–5.2, defined
Table 3. The mean values of width and height of choanae in both gender; *p < 0.05
Age Gender N Choanae [mm]
Height Width
Right Left P Right Left P
1 Male 9 9.73 ± 1.97 9.85 ± 2.36 0.639 7.45 ± 0.95 7.46 ± 0.60 0.961
Female 10 8.64 ± 1.85 8.61 ± 1.86 0.782 7.29 ± 1.37 7.31 ± 1.49 0.901
2 Male 9 10.94 ± 1.89 10.98 ± 1.85 0.685 8.06 ± 1.27 7.97 ± 1.10 0.470
Female 9 11.77 ± 1.62 12.01 ± 1.17 0.317 8.08 ± 0.79 8.00 ± 0.95 0.474
3 Male 9 12.41 ± 2.18 12.23 ± 1.80 0.489 8.72 ± 1.27 8.64 ± 0.85 0.773
Female 9 13.16 ± 2.43 9.80 ± 0.96 0.235 9.87 ± 0.96 9.90 ± 0.84 0.874
4 Male 11 15.42 ± 2.46 15.29 ± 2.66 0.077 10.04 ± 0.95 10.19 ± 1.01 0.062
Female 10 14.31 ± 2.44 14.40 ± 2.50 0.639 10.42 ± 1.98 10.57 ± 1.93 0.334
5 Male 11 14.99 ± 2.47 14.91 ± 2.22 0.531 9.71 ± 0.88 9.85 ± 0.82 0.387
Female 8 15.08 ± 1.97 15.20 ± 2.33 0.660 9.48 ± 1.07 9.90 ± 1.17 0.130
6 Male 9 15.75 ± 2.15 16.01 ± 2.18 0.090 10.45 ± 1.67 10.36 ± 1.73 0.338
Female 10 15.54 ± 1.81 15.46 ± 1.58 0.687 9.72 ± 0.86 9.81 ± 0.86 0.225
7 Male 10 16.65 ± 1.39 16.53 ± 1.65 0.472 10.97 ± 0.85 10.81 ± 0.77 0.305
Female 10 16.03 ± 1.49 16.19 ± 1.51 0.355 10.54 ± 0.69 10.65 ± 0.75 0.117
8 Male 10 17.52 ± 1.53 17.61 ± 1.41 0.481 11.41 ± 0.78 11.54 ± 0.67 0.253
Female 8 15.43 ± 1.96 15.36 ± 2.08 0.460 10.67 ± 1.61 10.58 ± 1.55 0.155
9 Male 11 16.75 ± 1.64 16.89 ± 1.57 0.307 10.73 ± 1.29 10.85 ± 1.29 0.377
Female 9 16.20 ± 2.61 16.35 ± 2.59 0.188 10.11 ± 1.43 10.06 ± 1.27 0.772
10 Male 11 18.32 ± 2.08 18.30 ± 2.11 0.783 11.11 ± 1.26 11.10 ± 1.32 0.931
Female 8 16.71 ± 2.90 16.62 ± 2.81 0.429 11.05 ± 1.10 10.97 ± 1.05 0.402
11 Male 10 18.85 ± 2.28 18.73 ± 2.30 0.089 11.75 ± 1.43 11.54 ± 1.38 0.051
Female 10 17.90 ± 1.26 17.80 ± 1.37 0.343 11.01 ± 1.52 11.05 ± 1.41 0.705
12 Male 10 18.12 ± 1.87 18.05 ± 1.82 0.363 11.97 ± 1.35 11.85 ± 1.21 0.126
Female 8 19.12 ± 1.81 19.02 ± 1.75 0.121 11.56 ± 1.00 11.40 ± 0.87 0.061
13 Male 8 19.72 ± 1.63 19.70 ± 1.65 0.756 12.02 ± 1.12 11.92 ± 1.15 0.068
Female 9 18.04 ± 2.99 17.93 ± 2.98 0.206 11.28 ± 1.59 11.14 ± 1.70 0.096
14 Male 10 22.40 ± 1.96 22.34 ± 1.88 0.297 12.76 ± 1.30 12.60 ± 1.28 0.119
Female 9 19.86 ± 4.24 19.91 ± 4.26 0.569 11.12 ± 1.80 11.12 ± 1.71 1.000
15 Male 10 22.88 ± 2.53 22.80 ± 2.50 0.300 12.43 ± 1.80 12.46 ± 1.71 0.790
Female 10 20.70 ± 2.64 20.62 ± 2.65 0.111 12.40 ± 1.28 12.39 ± 1.26 0.343
16 Male 10 23.98 ± 2.47 24.08 ± 2.56 0.128 12.68 ± 1.16 12.66 ± 1.11 0.591
Female 10 19.13 ± 1.42 19.11 ± 1.45 0.775 12.19 ± 1.57 12.08 ± 1.58 0.054
17 Male 8 22.73 ± 2.96 22.62 ± 2.84 0.208 12.81 ± 0.92 12.73 ± 0.98 0.244
Female 9 18.21 ± 2.77 18.27 ± 2.52 0.682 12.36 ± 1.33 12.27 ± 1.35 0.111
18 Male 10 21.78 ± 2.33 21.72 ± 2.33 0.357 12.64 ± 1.29 12.50 ± 1.35 0.116
as NCV at 0–3 cm and 3–5.2 cm, respectively from the nasal orifice. NCV0–5.2 is the sum of NCV0–3 and NCV3–5.2. They calculated the NCV0–5,2; it was 5.50 ± ± 1.20 cm3. Schriever et al. [35] assessed relationship between intranasal volume and the size of the nares in healthy volunteers aged 19–77 years on MR images by software. They determined that average total intrana-sal volume was 16,449.81 mm3. They didn’t find any significant difference between the participating men (17,268.71 ± 4278.60 mm3) and women (15,654.31 ± 4206.07 mm3) in terms of total intranasal volume. Similarly, in our study NC volume did not differ sig-nificantly between male and female up to 14 years of age. We thought that numerical differences among our study and others may be derived from the sub-jects’ race, gender, age and methods that were used in researches [35, 40]. Only 1 study has investigated the volume of the NC, MNC and INC with CT images using stereological method in healthy people. They deter-mined that the mean volumes of NC, MNC and INC were 5.95 ± 0.10 cm3, 0.56 ± 0.22 cm3, and 1.45 ± ± 0.68 cm3; 7.01 ± 0.18 cm3, 0.67 ± 0.31 cm3 and 1.59 ± 0.98 cm3 in females and males, respectively. There were statistically significant differences in the volume of NC and MNC between males and females, but no significant difference was determined for INC [12]. However, no study has investigated the volume changes of NC and volume fraction of the nasal con-chae according to age and sex by using stereological method. In this study, we calculated the volumes of the nasal cavities and each of the conchae with both
to the data obtained, regardless of gender; there was no significant difference in size between the right and left parts of the NC and the conchae, but when evaluated by gender, a significant difference was de -termined only in two groups. Similarly to Emirzeoglu et al. [12], we reported that a male–female significant difference existed for the NC when the age is over 15 years old and we found that the males’ NC vol-umes were systematically greater than the females. Age-related changes in NC and its structures were in general similar. They reached adult dimensions at 15–18 years of age.
Despite the development of modern imaging techniques, a few studies have been carried out to establish the normal size of the children posterior choanae according to age. Violaris et al. [43] investi-gated normal anatomical sizes of the adult (18 and 73 years) posterior choanae. They determined right width: 0.9–2.1 (mean 1.5) cm; left width: 0.9–2.2 (mean 1.5) cm; right height: 2.5–4.0 (mean 2.6) cm; and left height: 1.5–4.0 (mean 2.5) cm. Chi-square analysis showed no statistically significant differences between left- and right-sided measurements [48]. In other study, the size of the posterior choanae was assessed in 72 children. The size of the posterior choanae ranged from 3 mm to 9.3 mm (3–5.5 mm when less than 1 year old, and 6.1–9.3 mm when older than 1 year). The two sides were of equal size in 51 children (p < 0.001), in 16 children the right side was larger than the left (p < 0.001), and in 5 children the left was larger than the right side [42]. Our results are consistent with the previous studies [42, 43]. The different numerical results that reported for the size of posterior choanae by previ-ous studies and present study may originate from the subjects’ race, gender, age and methods that were used in researches.
CONCLUSIONS
In conclusion, we demonstrated increasing vol-umes of NC and its structures in children related to age. Up to 14 and 15 years of age, males’ and females’ nasal airway dimensions were similar; in subsequent years the differences in NC and INC volumes were evident between genders. In addition, the volume ratios of INC to NC and MNC to NC ranged from 18% to 32% and from 9 to 15 according to age, respec-tively. We thought that these volume ratios could help the physician for both patient selections for Figure 4. The volume fraction of the inferior nasal conchae (INC)
used for treatment of nasal obstruction. However, current study revealed that point-counting method is effective in determining volume estimation of NC and its structures and is well suited for CT studies. The point-counting is reliable, simple, inexpensive, and efficient method for estimating volumes in CT images. For each structure, we found that counting 150–210 points on 15 or 20 systematically sampled CT sections with 0.6 mm section thickness and a point spacing of 0.3 cm enables volume estimation of NC and its structures with a CE below 5%. We think that the proposed method can produce accurate volume estimations, providing an objective tool for quanti-tative assessment of some disease related to NC and its structures and the data obtained in this study can help clinicians in the evaluation and planning of treatment of pathological cases.
ACkNOwLEDgEMENTS
We wish to thank Prof. Dr Kenan Aycan and Prof. Dr Harun Ulger for skilful technical assistance.
REFERENCES
1. Acer N, Bayar B, Basaloglu H, Oner E, Bayar K, Sankur S (2008) Unbiased estimation of the calcaneus volume using the Cavalieri principle on computed tomography images. Ann Anat, 190: 452–460.
2. Acer N, Sahin B, Ergür H, Basaloglu H, Ceri NG (2009) Stereological estimation of the orbital volume: a criterion standard study. J Craniofac Surg, 20: 921–925.
3. Acer N, Sofikerim M, Ertekin T, Unur E, Çay M, Öztürk F (2011) Assessment of in vivo calculation with ultrasono-graphy compared to physical sections in vitro: a stereolo-gical study of prostate volumes. Anat Sci Int, 86: 78–85. 4. Bahadir O, Kosucu P (2012) Quantitative measurement of
radiofrequency volumetric tissue reduction by multide-tector CT in patients with inferior turbinate hypertrophy. Auris Nasus Larynx, 39: 588–592.
5. Cankurtaran M, Celik H, Coskun M, Hizal E, Cakmak O (2007) Acoustic rhinometry in healthy humans: accuracy of area estimates and ability to quantify certain anatomic structures in the nasal cavity. Ann Otol Rhinol Laryngol, 116: 906–916. 6. Cruz-Orive LM (2006) A general variance predictor for
Cavalieri slices. J Microsc, 222: 158–165.
7. Cruz-Orive LM (1983) Distribution-free estimation of sphere size distributions from slabs showing overprojec-tion and truncaoverprojec-tion, with a review of previous methods. J Microsc, 131: 265–290.
8. Damm M, Vent J, Schmidt M, Theissen P, Eckel HE, Lotsch J, Hummel T (2002) Intranasal volume and olfactory fun-ction. Chem Senses, 27: 831–839.
9. Eccles R, Jawad MS, Jawad SS, Angello JT, Druce HM (2005) Efficacy and safety of single and multiple doses of pseudoephedrine in the treatment of nasal congestion associated with common cold. Am J Rhinol, 19: 25–31. 10. Eduardo Nigro C, Faria Aguar Nigro J, Mion O, Ferreira
Mel-lo J Jr, Louis Voegels R, Roithmann R (2009) A systematic review to assess the anatomical correlates of the notches in acoustic rhinometry. Clin Otolaryngol, 34: 431–437.
11. Eggesbo HB (2006) Radiological imaging of inflammatory lesions in the nasal cavity and paranasal sinuses. Eur Radiol, 16: 1451–1458.
12. Emirzeoglu M, Sahin B, Celebi M, Uzun A, Bilgic S, Tontus HO (2012) Estimation of nasal cavity and conchae volumes by stereological method. Folia Morphol, 71: 105–108. 13. Emirzeoğlu M, Sahin B, Bilgic S, Celebi M, Uzun A (2007)
Volumetric evaluation of the paranasal sinuses in normal subjects using computer tomography images: A stereolo-gical study. Auris Nasus Larynx, 34: 191–195.
14. Ercan C, Imre A, Pinar E, Erdoğan N, Umut Sakarya E, Oncel S (2014) Comparison of submucosal resection and radiofrequency turbinate volume reduction for inferior turbinate hypertrophy: evaluation by magnetic resonan-ce imaging. Indian J Otolaryngol Head Neck Surg, 66: 281–286.
15. Ertekin T, Acer N, Turgut AT, Aycan K, Ozçelik O, Turgut M (2011) Comparison of three methods for the estimation of the pituitary gland volume using magnetic resonance imaging: a stereological study. Pituitary, 14: 31–38. 16. Gregorio PB, Athanazio RA, Bitencourt AG, Neves FB,
Terse R, Hora F (2008) Symptoms of obstructive sleep apnea-hypopnea syndrome in children. Bras Pneumol, 34: 356–361.
17. Gundersen HJ, Jensen EB, Kieu K, Nielsen J (1999) The effi -ciency of systematic sampling in stereology-reconsidered. J Microsc, 193: 199–211.
18. Hol MK, Huizing EH (2000) Treatment of inferior turbinate pathology: a review and critical evaluation of the different techniques. Rhinology, 38: 157–166.
19. Howard CV, Reed MG (2005) Unbiased stereology: three dimensional measurement in microscopy. 2nd Ed. Liver-pool Bios, Oxford, pp. 55–68.
20. Jackson LE, Kock RJ (1999) Controversies in the manage-ment of inferior turbinate hypertrophy: a comprehensive review. Plast Reconstr Surg, 103: 300–312.
21. Kalmovich LM, Elad D, Zaretsky U, Adunsky A, Chetrit A, Sadetzki S, Segal S, Wolf M (2005) Endonasal geometry changes in elderly people: acoustic rhinometry measure-ments. J Gerontol, 60: 396–398.
22. Kim CS, Moon BK, Jung DH, Min YG (1998) Correlation between nasal obstruction symptoms and objective para-meters of acoustic rhinometry and rhinomanometry. Auris Nasus Larynx, 25: 45–48.
23. Lee HY, Kim Ch-H, Kim JY, Kim JK, Song MH, Yang HJ, Kim KS, Chung IH, Lee JG, Yoon JH (2005) Surgical anatomy of the middle turbinate. Clin Anat, 196: 493–496.
24. Mattfeldt T, Gottfried HW, Wolter H, Schmidt V, Kestler HA, Mayer J (2003) Classification of prostatic carcinoma with artificial neural networks using comparative genomic hybridization and quantitative stereological data. Pathol Res Pract, 199: 773–784.
25. Mazonakis M, Karampekios S, Damilakis J, Voloudaki A, Gourtsoyiannis N (2004) Stereological estimation of total intracranialvolume on CT images. Eur Radiol, 14: 1285–1290.
26. Miller AJ, Amadee RG (1997) Functional anatomy of the paranasal sinuses. J La State Med Soc, 149: 85–90. 27. Millqvist E, Bende M (1998) Reference values for acoustic
rhinometry in subjects without nasal symptoms. Am J Rhinol, 12: 341–343.
28. Nease CJ, Krempl GA (2004) Radiofrequency treatment of turbinate hypertrophy: a randomized, blinded placebo--controlled clinical study. Otolaryngol Head Neck Surg, 130: 291–299.
30. Raza MT, Wang DY (2012) Is nasal cavity geometry asso-ciated with body mass index, height and weight? Indian J Otolaryngol Head Neck Surg, 64: 266–269.
31. Roberts N, Cruz-Orive LM, Reid NM, Brodie DA, Bourne M, Edwards RH (1993) Unbiased estimation of human body composition by the Cavalieri method using magnetic resonance imaging. J Microsc, 171: 239–253.
32. Sahin B, Ergur H (2006) Assessment of the optimum section thickness for the estimation of liver volume using magnetic resonance images: a stereological gold standard study. Eur J Radiol, 57: 96–101.
33. Sahlstrand-Johnson P, Jannert M, Strombeck A, Abul--Kasim K (2011) Computed tomography measurements of different dimensions of maxillary and frontal sinuses. BMC Med Imaging, 5: 11–18.
34. Sapci T, Sahin B, Karavus A, Akbulut UG (2003) Comparison of the effects of radiofrequency tissue ablation,Co2 laser ablation and partial turbinectomy applications on nasal mucociliary functions. Laryngoscope, 113: 514–519. 35. Schriever VA, Hummel T, Lundström JN, Freiherr J (2013)
Size of nostril opening as a measure of intranasal volume. Physiol Behav, 3–5: 110–111.
36. Souza RP, Junior JPB, Tornin OS, Junior AJOP, Barros CV, Trindade FA, Lehn CN (2006) Sinonasal complex: Radio-logical anatomy. Radiol Bras, 39: 367–372.
37. Suratt PM, Turner BL, Wilhoit SC (1986) Effect of intranasal obstruction on breathing during sleep. Chest, 90: 324–329. 38. Tarhan E, Coskun M, Cakmak O, Celik H, Cankurtaran M
(2005) Acoustic rhinometry in humans: accuracy of nasal passage area estimates, and ability to quantify paranasal sinus volume and ostium size. J Appl Physiol, 99: 616–623. 39. Terheyden H, Maune S, Mertens J, Hilberg O (2000)
Acoustic rhinometry: validation by three-dimensionally
reconstructed computer tomographic scans. J Appl Phy-siol, 89: 1013–1021.
40. Thorstensen WM, Sue-Chu M, Bugten V, Steinsvag SK (2013) Nasal flow, volumes, and minimal cross sectional areas in asthmatics. Respir Med, 107: 1515–1520. 41. Vargervik K, Miller A, Chierici G, Harvold E, Tomer B (1984)
Morphologic response to changes in neuromuscular patterns experimentally induced by altered modes of respiration. Am J Orthod, 85: 115–124.
42. Violaris NS, Pahor AL, Chavda S (1994) Objective as-sessment of posterior choanae and subglottis. Rhinology, 32: 148–150.
43. Violaris NS, Patel K, Chavda S, Pahor AL (1994) Does nasal septal deviation influence adult posterior choanal size. Rhinology, 32: 84–86.
44. Woodside D, Linder-Aronson S, Lundstrom A, McWilliam J (1991) Mandibular and maxillary growth after changed mode of breathing. Am J Orthod Dentofacial Orthop, 100: 1–18. 45. Yamada T, Tanne K, Miyamoto K, Yamauchi K (1997)
In-fluences of nasal respiratory obstruction on craniofacial growth in young Macaca fuscata monkey. Am J Orthod Dentofacial Orthop, 111: 38–43.
46. Yokley TR (2009) Ecogeographic variation in human nasal passages. Am J Phys Anthropol, 138: 11–22.
47. Yu MS, Kim JY, Kim BH, Kang SH, Lim DJ (2015) Feasibility of septal body volume reduction for patients with nasal obstruction. Laryngoscope, 125: 1523–1528.
48. Yu S, Liu Y, Sun X, Li S (2008) Influence of nasal structure on the distribution of airflow in nasal cavity. Rhinology, 46: 137–143.