accurate representation of an Exploration Zone at the Eastern Valles Marineris out-flow region within equatorial Mars. There are numerous problems associated with mapping planetary surfaces. Data and imagery for Exploration Zones at a spatial and spectral resolution sufficient for human landing site evaluation and traverse planning have not been acquired yet. Additionally, as technology evolves, it is very difficult to extrapolate which mapping technologies will be used in the near and far future. In order to create this map, assumptions about the future of mapping had to be made, publicly released data for the area of interest had to be sourced, and data analysis had to be performed. One of the key elements of a successful mission is how to communicate the geospatial aspects of the mission planning process to the general public. The results show that using existing data and traditional static car-tographic methods, even extra-terrestrial geographic discoveries can be made and disseminated to the public in an attractive and easily understood format.
Keywords: Mars, Valles Marineris, cartography, areography, planetary mapping, naming conventions
1. Introduction to Mapping Project
Preparations for a Human Exploration of Mars has been underway since the 1960’s through national and multinational programs, most notably those of the United States, United Kingdom, European Union, and the former Soviet Union (NASA, 2016). More recently many of the associated costs of exploration have been driven down (Chaikin, 2012) and many private, corporate, and non-profit organiza-tions have picked up the torch of Martian exploration. Remote exploration of Mars has also recently entered the public sphere in the form of imagery from NASA and ESA, Google Earth’s Mars, and citizen efforts afforded by the collaborative nature of the internet.
from around the world to participate in planning the first human mission to Mars by choosing one of NASA’s 47 proposed landing sites (Exploration Zones) to map in detail. The style and design of each map entry is the cartographer’s prerogative (ICA CPC, 2016).
All 47 potential exploration zones were carefully considered. Although they all met the basic criteria set forth by NASA, some areas were more inspiring than oth-ers. Ultimately, the Eastern Valles Marineris outflow area was chosen because of its many similarities to geographic features in the Columbia Basin in Eastern Wash-ington State. Coulees, escarpments, and flood plains in Valles Marineris are eerily reminiscent of those in the Columbia Basin and these similarities may assist the identification and extraction of useful resources. The extreme topography and rela-tively narrow mouth of this part of the valley create many geologic and geographic areas of interest within travelable distance of the landing site resulting in a poten-tially higher return on investment in terms of habitability and research relative to other parts of the planet.
2. Map Considerations
Projecting the mapping needs of human explorers on Mars is not an easy task, however the author believes certain assumptions can be made. As of the writing of this paper, interactive digital maps on mobile devices and the web make up a grow-ing share of map usage relative to traditional static maps. Paper maps, by contrast, are falling further out of favor due to the cost of creating, updating, and printing, as well as their unwieldiness in the field and the difficulty of use in harsh environments where they may become degraded or lost. Interactive digital maps of some variety are almost certainly going to be the mapping technology of choice in future Martian exploration, both on Earth and for astronauts carrying out field work on the Martian surface. Several mapping technologies were considered for the development of the Eastern Valles Marineris Exploration Zone map. They are:
• Augmented Reality (AR)
• Mixed Reality / Virtual Reality (VR)
• Web Geographic Information System (GIS)
vehicles that aid in navigation (Newcomb, 2015). Other apps such as Neon App allow users to locate places and other users by peering through the display of the device, The hardware and software ecosystems for this technology are already in place with a multiplicity of commercial and experimental products and services available. It would require only simple modification to extend them to extra-terres-trial purposes.
A combination of augmented reality and virtual reality known as “mixed reality” is another potential option and will also likely be used in future exploration. Since virtual reality doesn’t actually require an explorer to be on site, it will likely be used as a remote sensing technology, allowing explorers to familiarize themselves with the environment they will soon set foot prior to arrival or to perform research re-motely. The JPL project OnSite uses the Microsoft Hololens to project humans and equipment onto a Martian landscape, which can be viewed by multiple individuals simultaneously for collaborative observations and research almost as if they were on the planet itself. (Jet Propulsion Laboratory, 2015).
A web GIS system was also considered due to its high utility to online users. Multiple users from multiple fields would be able to peruse the exploration zone and be able to toggle on or off those layers which are deemed important for their respective projects or interests. Although this seemed to be the most useful form of mapping for Martian mapping purposes, it was decided against because the author desired to create a digital map that could be printed into a cartographically pleasing paper map, a function that is not easily done with a web GIS. Although printing is possible with a web GIS, quality control would no longer within the purview of the author, something the author was unwilling to relinquish to non-cartographer users.
3. Map Construction
The drafting of this map was an iterative process which involved the creation of six drafts. Each draft was carefully reviewed by volunteers who were knowledgea-ble in GIS, cartography, and graphic design. Non-GIS professionals were also con-sulted on ease of understanding and the ability to interpret the message that the map was attempting to convey. Copies were printed and given to these reviewers to mark on and report back to the author for modification or correction. Issues that were addressed by these individuals included symbology, color schemes, background color ramp, labeling, contour intervals, font choice, and layout. During each itera-tive cycle the map improved in both content and visual appeal until a final version emerged for submission.
3.1 Base Datasets Used
This mapping exercise started with four publicly available base datasets from the USGS Planetary GIS Data Server (PIGDA).
– Digital elevation model (DEM), acquired by the Mars Orbiter Laser Altimeter
(MOLA) (Neumann et al, 2003) which accompanied the Mars Global Sur-veyor from 1999 to 2001 and has a horizontal accuracy of approximately 100 meters and a vertical accuracy of approximately 3 meters (Lemoine et al, 2001)
– Mars global hillshade, a derivative product of the MOLA DEM.
Down-loadable from PIGDA or created fresh using ESRI’s ArcGIS.
– Robbins Crater Database. A databased compiled by Stuart Robbins to capture
craters larger than 1.0km. It currently contains over 640,000 crater points (Robbins, 2013)
– USGS IAU nomenclature shapefile. A GIS file that contains over 1800 named
places on Mars that were extracted from the USGS Gazetteer of Planetary Nomenclature (USGS GIS metadata, 2016).
Both the digital elevation model (DEM) and the derived hillshade raster were obtained and used as the cartographic base layers and as datasets used in subsequent analysis and the development of secondary GIS data products such as contours and points of interest. Since these are global datasets and already georeferenced, they represent the most accurate topography of Mars available (USGS, 2014) and were useful in identifying the Eastern Valles Marineris region as the author’s exploration zone of interest.
field within the attribute table to create circular polygons of the correct diameter. These polygons were then saved as a separate feature class. Later it was decided that the circular polygons should more closely match the actual rim of the crater more closely for cartographic purposes and so each crater within the map’s data frame was manually adjusted.
3.2 Imagery
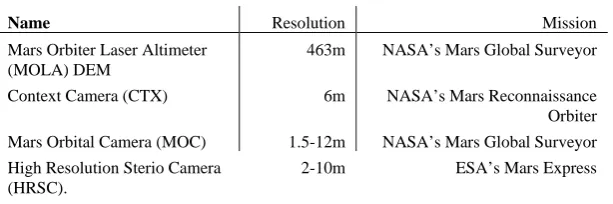
Google Earth’s Mars system was an invaluable resource comprised of imagery from the HiRISE, CTX, MOC, HRSC, and CRISM camera systems which origi-nated from NASA and the ESA. The resolution of the imagery easily allowed the identification of features not otherwise discernable from the MOLA DEM. For this mapping exercise imagery from HRSC, MOC, and CTX were examined, but not of CRISM or HiRISE due to lack of imagery within the exploration zone. Below is a table comparing the MOLA DEM quality with the aforementioned imagery collec-tions.
Table 1. Available imagery to compare to MOLA DEM
Name Resolution Mission
Mars Orbiter Laser Altimeter (MOLA) DEM
463m NASA’s Mars Global Surveyor
Context Camera (CTX) 6m NASA’s Mars Reconnaissance Orbiter Mars Orbital Camera (MOC) 1.5-12m NASA’s Mars Global Surveyor High Resolution Sterio Camera
(HRSC).
3.2.1 Tools for Geologic Investigations
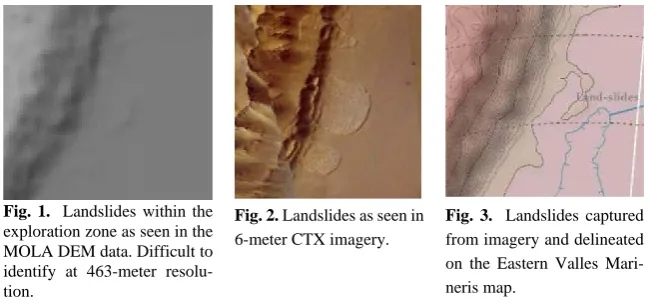
In the north portion of the exploration zone along the west rim there are several landslides which are labeled on the map, but which are difficult to identify without first examining a satellite imagery of the same area.
Fig. 1. Landslides within the exploration zone as seen in the MOLA DEM data. Difficult to identify at 463-meter resolu-tion.
Fig. 2. Landslides as seen in 6-meter CTX imagery.
Fig. 3. Landslides captured from imagery and delineated on the Eastern Valles Mari-neris map.
The same is true for a great number of small craters which are not picked up in detail from the MOLA DEM. The most surprising find from examining the Martian imagery was what appears to be a paleo lake bed in the southwest quadrant of the exploration zone (Google Earth’s Mars, 2016). It was discovered using CTX im-agery from Google Earth’s Mars. Using the same program, it was measured to be approximately 60 square miles in area and has a well delineated shoreline (Google Earth’s Mars, 2016).
Fig. 4. Lake Elise as seen in the MOLA DEM data. Diffi-cult to identify at 463-meter resolution
Fig. 5. Lake Elise as seen in 6-meter CTX imagery.
Lake Elise* was captured from the imagery using Google Earth/Mars to deline-ate its perimeter as a polyline and then exporting it as a KML file. This KML file was then converted into a shapefile using ArcMap’s KML to Layer tool.
3.3 Derivative Analysis & Datasets
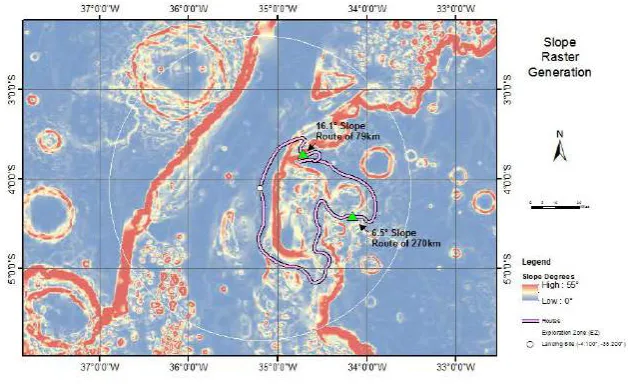
A slope raster was created using ArcGIS Surface Analyst toolset. It was used to identify potential low-slope areas. Two were identified as having potential, one had
a slope of 16.1° and with the other had a slope of 6.5° from which to access the
Valles Marineris rim. The more gradual identified rim route is approximately 270km long while the alternate, steeper, option is only 79km each way.
Fig. 7. Map showing a slope raster generated from the MOLA DEM using ESRI’s ArcGIS Spatial Analyst toolset. Although this graphic isn’t included on the Eastern Valles Marineris Exploration Zone map, it was used to identify the most graduate passes out of the valley to the top of the rim.
local10-meter contour layer was created to increase the resolution of the depression contour and to help tease out the location of the valley's drainage channel north of the depression. Because this depression represents a basin, the identification of a central channel within the depression was not possible. This depression contour is at approximately –3,990m. Incidentally, the depression contour makes up the west-ern boundary of Lake Elise showing that the lake exists within a low lying area with no apparent drainage. This low lying area appears to be a rift basin, a hallmark fea-ture of some rift valleys on Earth.
Fig. 8. Map showing depression area as it extends from the Valles Marineris northward into the outflow channel and Exploration Zone.
3.4 Coordinate Grid
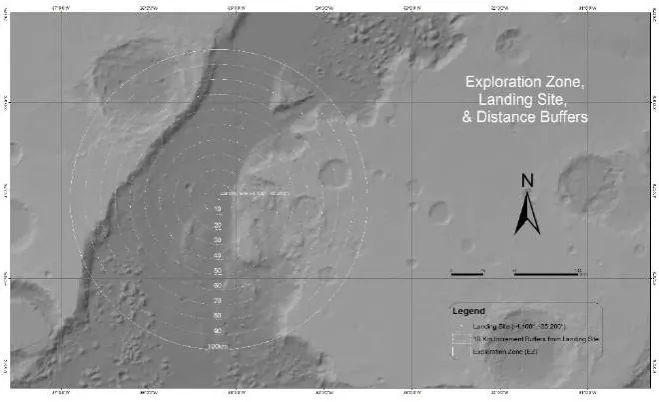
The coordinate system used on the map was a planetocentric coordinate system called Mars 2000. Using this coordinate system, a latitude and longitude grid was placed over and around the maps data frame to provide a geographical frame of reference.
element and in most cases necessary for understanding map scale, they are fairly non-intuitive without concerted effort and a linear measuring device. The concentric rings are essentially a modified “scale bar.”.
Fig. 9. Map showing 10km buffer rings radiating from the land site, which is the center of the Exploration Zone.
3.5 Nomenclature
3.5.1 Naming Convention
The names chosen for new places were in keeping with the tradition of commem-orating people, Earthly places, and human culture (Hargitai, 2011). Lake Elise, Al-derman Bluff, Enge Escarpment, Humboldt Plateau, Hawks Hill, and Ray’s Crater are all named after people who were either famous explorers such as Alexander von Humboldt, or were personally notable to the author. Features such as Clallam Chasma, Pillar Point, and Dungeness Point were named after prominent places in Clallam County of Washington State. West and East craters refer to their relative location to each other, Thalweg crater is a feature found in close proximity to the main valley channel, hence its name. Twin craters are a pair of impact sites nearly on top of each other on the west scree slopes of Exploration Zone, and 70 Kilometer crater represents an impact site nearly exactly 70 kilometers from the Exploration Zone landing site. These prominent features are summarized in the table below.
Feature Name/Label Coordinates
Paleo lake Lake Elise 4°36'10.39"S, 36°20'3.23"W Prominent bluff Alderman Bluff 3° 1'11.34"S, 34°31'49.91"W Chasma Clallam Chasma 3° 5'54.92"S, 34°15'11.50"W Escarpment Enge Escarpment 4°13'48.73"S, 34°47'35.95"W Plateau Humboldt Plateau 4°45'7.64"S, 34°50'54.73"W Stream-lined hill Hawks Hill 4°45'7.64"S, 34°50'54.73"W Rim point Pillar Point 3°48'25.39"S, 34°47'49.51"W Rim point Dungeness Point 3°20'53.76"S, 34°15'55.85"W Crater West Crater 2°46'47.81"S, 36°18'28.56" Crater East Crater 2°47'1.40"S, 35°50'30.32"W Crater Ray’s Crater 3°45'30.38"S, 33°30'38.70"W Crater Thalweg Crater 3°58'56.84"S, 35°33'1.98"W Crater 70 Kilometer Crater 5°14'41.59"S, 35°36'43.15"W Crater Twin Craters 4° 5'15.00"S, 36°10'57.91"W
Table 1. List of geographic and geologic features with new place names and corresponding coor-dinates in the Eastern Valles Marineris outflow region.
3.6 Lander Sites Inset Map
exported as a KML file. Both the sites and bearing polyline KML files were then converted to an ESRI shapefile so they could be included on both the primary East-ern Valles Marineris map and the inset global Mars map.
Fig. 10. Global lander site inset map showing landing sites and bearing lines relative to the Eastern Valles Marineris exploration zone as well as the 47 potential land sites and exploration zones iden-tified in 2015 through NASA’s “First Landing Site/Exploration Zone Workshop” (Bussey, 2016).
4. Conclusions
References
Bussey, B., Hofman, S. (2016). Human Mars Landing Site and Impacts on Mars Surface Opera-tions. https://ntrs.nasa.gov/archive/nasa/casi.ntrs.nasa.gov/20160001040.pdf. PDF. Accessed 21 October 2016.
Chaikin, A. (2012). Is SpaceX Changing the Rocket Equation?.
http://www.airspace-mag.com/space/is-spacex-changing-the-rocket-equation-132285884/?no-ist. Website.
Ac-cessed 17, October 2016.
Google Earth’s Mars. (2016). Google Earth program. Downloadable at:
https://www.google.com/earth/explore/products/desktop.html. Software download website.
Accessed 21, October 2016.
Hargitai, H. I., Shingareva, K. B. (2011). Planetary Nomenclature: A Representation of Human Culture and Alien Landscapes.Advances in Cartography and GIScience. Volume 2. P 275-288.International Cartographic Association (ICA) Commission on Planetary Cartography. (2016). Call for maps: Mars Exploration Zone Map Design Competition.
https://planet-carto.wordpress.com/2016/04/22/mars-exploration-zone-map-competition/. Website.
Ac-cessed 17 October 2016.
Jet Propulsion Laborator (JPL). (2015). NASA, Microsoft Collaboration Will Allow Scientists to ‘Work on Mars’. http://www.jpl.nasa.gov/news/news.php?feature=4451. Website. Ac-cessed 10 October, 2016.National Aeronautics and Space Administration. (2016). A Chronol-ogy of Mars Exploration . http://history.nasa.gov/marschro.htm. Website. Accessed 17 Octo-ber 2016.
Neumann, G.A., D.E. Smith, and M.T. Zuber. (2003). Two Mars years of clouds detected by the Mars Orbiter Laser Altimeter, Journal of Geophysical Research, 108(E4), 5023,
doi:10.1029/2002JE001849.
Neumann, G.A., Rowlands, D.D., Lemoine, F.G., Smith, D.E., and Zuber, M.T. (2001). Crosso-ver analysis of Mars Orbiter Laser Altimeter data: Journal of Geophysical Research, v. 106, no. E10, p. 23,753-23,768.
Newcomb, D. (2015). Augmented Reality Head-Up Displays Point the Way Toward Self-Driv-ing.
http://www.forbes.com/sites/dougnewcomb/2015/10/15/augmented-reality-head-up-dis-plays-point-the-way-toward-self-driving/#42f844fc77c0. Website. Accessed 17, October
2016)
Robbins, S. (2013). Mars Crater Catalog by Stuart Robbins (20120821). http://astrogeol-ogy.usgs.gov/search/map/Mars/Research/Craters/RobbinsCraterDatabase_20120821. Appli-cation/zip GIS data for download on website. Accessed 21 October 2016
Tanaka, K. L., Skinner, Jr., J. A., Hare, T. M. (2011). Planetary Geologic Mapping Handbook.
http://astrogeology.usgs.gov/search/details/Docs/Mappers/PGM_Handbook_2011/pdf. PDF.
Accessed 17 October 2016
USGS. (2014). MGS MOLA Elevation Model 463m (MEGDR). http://astrogeol-
ogy.usgs.gov/search/map/Mars/GlobalSur-veyor/MOLA/Mars_MGS_MOLA_DEM_mosaic_global_463m. Website. Accessed 20
Octo-ber, 2016.
USGS. (2016). Gazetteer of Planetary Nomenclature.
http://plane-tarynames.wr.usgs.gov/GIS_Downloads. GIS file metadata. Downloaded and viewed 21
! ( 10k m 20km 30km 40k m 50k m 60km 70km 80km 90km 100k m
Viking1 L ander (USA, 1
975) - 1 736km
N. 334° W. Mar sP ath fin der V ik in g 2 (U S A ,1 98 0) -10 ,5 04 km B ea gl e 2 (U K ,2 00 3) -7, 50 4k m M E R O pp or tu ni ty M S L C ur io si ty Mars
6 Lan
der (US
SR, 1
973)- 1
,501k m 16 .1 ° S lo pe 6. 5° S lo pe N.5 °E . N .7 3° E . N .8 3° E . N .8 7° E . S .9 0. 5° E .
S.141.5
° E.
Rim Rou te -7 9.0 km
Alt. RimRoute - 270km
(U S A ,2 00 3) -1, 77 3k m (U S A ,2 01 2) -10 ,2 28 km (U SA ,1 997
)m 80k 1,3
uror aeC haos 70 Kilom et er Cr at er 90 Kilom et er Cr at er Th al w eg C rater T w in Cr at er
s Au
ro rae C ra ter Ra y' s Cr at er W est C rater Ea st C ra te r C ha ot ic T erra in St re am -lin ed Is la nd St re am -lin ed Is la nd St ream -l in ed Is la nd L and -s lid es La ke E lis e T usk eg ee C rater Balb oa Cr at er Conc h es C ra te r Ha wk s Hi ll Mi le s P a ss Pi lla r Po in t Cl a lla m Ch as m a A lde rm an B luf f E nge E sc a rp me nt D ung en ess P o in t H um b ol dt P la te au -400 0 -30 00 -1000 -400 0 -4 00 0 -40 00 -100 0 -400 0 -400 0 -400 0 -4 00 0 -4 000 -4 00 0 -4000 -4 000 -400 0 0 -1000 -100 0 -4000 -4000 -4 000 -300 0 -4 00 0 -4 000 -200 0 -1000 -3000 -4000 -400 0 -4000 -2000 -4 000 -4 00 0
-3000
-4
00
0
-1
000
-4000
0 -4000 -10 00 -200 0
-1000
-400 0 -4000 -1000 -40 00 -400 0 -10 00 -10 00 -4 000 -4 000 -1000 -4 000 -400 0 -3000 -40 00 -40 00 -4000 -300 0 -4 00 0 -400 0
-4000
-30 00 -4000 -4 00 0 -4000 -300 0 -1 00 0 -4000
0 -4000
-1000
-4000
-4000
-4 000 -300 0 -4000 -4 00 0 -4000 -400 0 -10 00 -40 00 -100 0 -1000 -1000 -400 0 -4 00 0 -40 00 -4 00 0 -1000 -10 00 -4 00 0 -1000 -100 0 -4000 -40 00 -4000 -4000 -4000 -3 00 0 -40 00 -4000 -40 00 -4000 -400 0 -4000 -2 00 0 -3 00 0 -4 000 -1 00 0 33 °3 0' 0 "W 33 °3 0' 0 "W 34 °0 '0" W 34 °0 '0" W 34 °3 0' 0 "W 34 °3 0' 0 "W 35 °0 '0" W 35 °0 '0" W 35 °3 0' 0 "W 35 °3 0' 0 "W 36 °0 '0" W 36 °0 '0" W 0' 0 "W 0' 0 "W Ei an S . Ra y C art og ra ph er / Are link ed in.c om /i n/ Au g ust , 2 01
EASTERN
VA
MARINERIS
L
L
L and in g Si te & Ex plo #* #* #* #* #* #* #* #* #* #* #* #* ! ( M E R S p ir it Ro ver P h oe ni x La nd e r M a rs 3 La nd e r M ar s P o lar L an d er Ma rs 2 La nde r Vi k in g 1 La nde rPaLa Ha
Te mpe T e rr a Ka se i V a lle s M e la s C has ma N oc tis Landi ng H ypani s V al C op rates C h as m a V a lle s M a ri ne ri s M o ut h S o uther n N o ct ar is F os E quator ial V a Ma ri n e ri s 30 °0 '0 "W 30 °0 '0 12 0° 0' 0" W 30°0 '0"N 0°0' 0" 30°0 '0"S 60 °0 '0 "S M A R S G L O B E
: The E
as ter n V al les M ar in Z on e (E Z ) an d it 's s pa tia l re la ti on sh ip t o a ll to da te , i n cl udi ng o th er p ote nt ial fu tu re la ndi -La ndin gSi te& Fiel dSt atio n 0 5 10 15 2. 5 0 5 10 2. 5 0 1 02 03 5 -4.1 0°,