Surface Temperatures Initiative Implementation Plan: 2015-‐2018 1
2
Owners: Steering committee 3
4
Authors: Peter Thorne, Jay Lawrimore, Kate Willett, Victor Venema, Xiaolan Wang, 5
Richard Chandler, Blair Trewin, Renate Auchmann, Rachel Warren 6
7
Version: 2/9/15 8
9
Valid until: 1/31/18 or until superseded 10
Executive Summary 1
2
The International Surface Temperatures Initiative exists as an end-‐to-‐end 3
process to facilitate creation of the best possible surface air temperature records 4
over land to meet the myriad of data demands by science and society. The Initiative 5
has strong international participation and representation from multiple relevant 6
fields of expertise. It is supported through volunteer participation with no full time 7
staff. Two years after the second Implementation Plan a follow-‐on version to cover 8
the period 2015-‐2017 has been enacted. The Implementation Plan refresh is 9
structured around thematic areas and relies upon the actions of working groups, 10
task teams and expert teams in addition to the contributions of steering committee 11
members. Actions are always identified with specific owners and time-‐bound. 12
13
The Initiative is currently in its first cycle (due for completion in 2017/2018). 14
Specific priorities for the period covered by this Implementation Plan version are as 15
follows: 16
• To implement updates to the monthly resolution version of the databank 17
including improving coverage and completeness. 18
• To develop an initial daily databank release by augmenting GHCN-‐D with 19
additional daily temperature holdings. 20
• Efforts will continue to be made to exploit innovative techniques for the 21
digitization of images and hard copy archives, for example using citizen science 22
crowdsourcing (e.g. oldweather.org). These efforts will interface closely with 23
existing projects such as IEDRO (International Environmental Data Rescue 24
Organization) and ACRE (Atmospheric Circulation Reconstructions over the 25
Earth). 26
• The expert team on parallel measurements shall build a database of parallel 27
measurements and undertake analyses upon these holdings. 28
• The Benchmarking and Assessment working group will complete an initial 29
ensemble of monthly resolution benchmark datasets, representing analogs of 30
real observations corrupted by various noise models. Data-‐product creators will 31
be encouraged to run their algorithms on the benchmarks. Such practices will 32
enable users to cross-‐evaluate data-‐products and provide a tool for both 33
quantifying structural uncertainty of and further development of 34
homogenization algorithms. 35
• Efforts will be made to engender the creation of new analyses by independent 36
groups to increase the number of estimates and broaden the range of 37
approaches to the creation of global, regional and national analyses. 38
• The Steering Committee will appoint a working group to oversee the 39
development of a functional suite of tools for data analysis, visualization and 40
product inter-‐comparison tools. This working group will be established after 41
release of the benchmarks. 42
• The Steering Committee and working groups will promote the work of the 43
social media (blog) and the website, as well as via talks and posters at relevant 1
conferences, and articles in trade magazines and peer-‐reviewed journals. 2
• Efforts will be made to coordinate with other relevant activities such as ACRE, 3
Earthtemp, Meteomet2, EUSTACE, the task team on homogenization of the 4
commission on climate (TT-‐HOM) etc., and in-‐kind support given where 5
appropriate to these activities. 6
1. International Surface Temperature Initiative Background 1
2
The International Surface Temperature Initiative concept, endorsed by the WMO 3
Commission for Climatology at its 15th session, was launched at a meeting at the UK 4
Met Office, Exeter in September 2010. To meet the requirements placed on climate 5
science in the 21st Century, it is necessary to create a suite of high quality and high-‐ 6
resolution data-‐products, with openness, transparency, verification, and user tools. 7
Such a range of estimates, and common framework, would aid decision-‐making at 8
national and international scales and inform adaptation strategies. Crucially, this 9
Initiative is envisaged to be international and interdisciplinary -‐ involving climate 10
scientists, statisticians, metrologists and software engineers from around the world. 11
The Initiative should encompass: data rescue and digitisation; an open, transparent 12
and comprehensive databank with versioning and provenance tracking; a data 13
portal for multiple products estimating local, regional and global scale changes; a 14
common benchmarking and assessment; and platforms for data download, analysis, 15
intercomparison and visualization solutions. At the 2011 WMO congress the 16
Initiative was formally recognized. It has also been formally recognized by the 17
statistical and metrological overarching bodies of ISI-‐TIES and BIPM respectively. 18
19
The first version of the Implementation Plan was drafted in 2011 and covered the 20
period through 2013. The second version was drafted in early 2013 and intended to 21
cover 2013-‐2015. This third iteration was drafted in early 2015 and is intended to 22
cover 2015-‐2017. It envisaged within this timescale that there will be: further 23
improvement of the databank, a first version parallel measurements archive, and a 24
first release of the benchmark analogs and associated assessment, along with a 25
number of other specific aims. As funding opportunities permit a meeting of 26
Initiative participants is envisaged towards the end of this period or shortly 27
thereafter to evaluate progress and plan activities for a subsequent cycle. 28
29
Progress assessed against prior plans has been mixed, but needs to be considered in 30
the context of Initiative specific dedicated resources, which are limited to in kind 31
support by a number of organizations and individuals principally where aims and 32
objectives substantively overlap. At the time of drafting the new Implementation 33
Plan the databank formal first release has occurred and benchmarks are envisaged 34
to be released within the next 6 months. 35
36
37
2. Implementation Plan scope 38
39
This implementation plan (IP) refresh has been written by the Steering Committee 40
and will be updated again in 2017. It presents a medium-‐term vision of the 41
implementation of this Initiative covering the completion of the first full cycle of the 42
databank and benchmarking exercise. It provides intermediate deliverables and 43
activities to be undertaken by the Steering Committee, or by working groups 44
answering to the Steering Committee and any sub-‐groups thereof. 45
The IP focuses first and foremost on activities leading to completion of the first 1
assessment cycle, presently envisaged to occur in 2016/17. It builds upon the 2
principles agreed at the initiation meeting, held at the UK Met Office in September 3
2010 (details at www.surfacetemperatures.org), and summarized in a BAMS 4
Meeting Summary (Thorne et al., 2011). The dates and aims listed herein will serve 5
as a roadmap and checkpoints with which to guide and gauge progress. 6
7
8
3. Databank updates and improvements 9
10
Databank activities are undertaken under the auspices of the Databank working 11
group and have been led since inception by NOAA’s National Climatic Data Center. 12
The databank first version build was released in June 2014 accompanied by a peer 13
reviewed article that described its production (Rennie et al., 2014). The first version 14
release consists of monthly averages of maximum, minimum and average 15
temperatures from over 32,000 stations. The foundation of this version is the Global 16
Historical Climatology Network-‐Daily data set and is supported by an additional 50+ 17
global, national and regional holdings submitted by multiple parties including 18
Databank working group members and National Meteorological Services among 19
others. Its presence has in addition been actively advertised through the CLIMLIST 20
email distribution list, blog postings, presentations at conferences, flyers circulated 21
at CCl and COP-‐20, and a brief communication in EOS (Lawrimore et al., 2013). A 22
number of beta releases led to improvements suggested by users. The first version 23
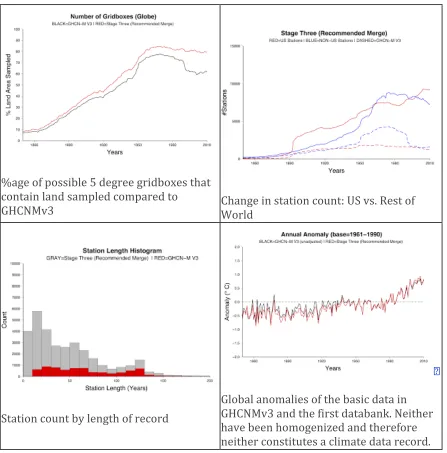
release characteristics are briefly summarized in Figure 1. 24
25
Stations plotted by length (longer records overplot shorter)
%age of possible 5 degree gridboxes that contain land sampled compared to GHCNMv3
Change in station count: US vs. Rest of World
Station count by length of record
Global anomalies of the basic data in GHCNMv3 and the first databank. Neither have been homogenized and therefore neither constitutes a climate data record. Figure 1. Summary of the databank first version release.
1 2
Although the land surface databank has initially focused upon surface temperature 3
on the monthly and daily timescales, long-‐term goals are much broader. It is 4
envisaged that eventually a successful land databank will consist of holdings of 5
other essential climate variables (Bojinski et al., 2014) at monthly, daily, and sub-‐ 6
daily resolutions. The current version also holds other variables where available and 7
data added from various data-‐rescue efforts is included in its entirety. Wherever 8
possible the databank has been built to be traceable to the raw data records through 9
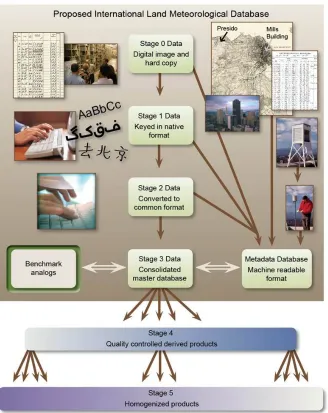
an unbroken chain of evidence (Figure 2), provided by supplementary metadata. 10
The databank is version controlled and the data and databank construction 11
metadata (including all code used to convert and merge the data) are made available 12
without restriction. 13
1
Figure 2. Structure of the comprehensive land surface databank and products derived 2
therefrom. From Thorne et al., 2011 3
4
3.1 Databank hosting and structure
5 6
The fundamental Databank holdings consist of four stages as depicted in Figure 2. 7
Stage 0 records consist of the paper or imaged forms on which the original 8
observation was recorded. Because many observations are no longer hand written, 9
this stage also may include the original engineering units of an automated 10
observation (e.g., voltage). Once initially digitized from paper records in native 11
format or converted from engineering units to a digital record, the observations are 12
structures. Already in the first release there exist a plethora of stage 1 formats. This 1
is followed by conversion of all data to a common format in Stage 2. Data 2
provenance tracking flags have been included in this stage as part of the process of 3
tracing the origin and path of each observation. Because observations may be 4
provided by more than one source, with data from each source being similar but not 5
identical, a process of data merging has then been developed to place all 6
observations into a single dataset (Stage 3). There exist several variants to give an 7
idea of the structural uncertainty in this step. Stages 4 and 5 describe climate data 8
products derived from the databank by individuals and institutions and are not 9
within the scope of the Databank working group. 10
11
The four stages of the Databank have been provided initially from a central 12
repository at NOAA’s National Climatic Data Center and are discoverable via the 13
Global Observing Systems Information Center (GOSIC). Stage 0 and 1 data, because 14
they are provided by a variety of host organizations, exist in a variety of formats. 15
Stage 2 and Stage 3 data are available in ASCII. Stage 3 data are available in three 16
formats including a version in CF-‐compliant NetCDF. 17
18
3.2 Recovery and conversion of non-‐digital data
19 20
Recent estimates suggest that there are comparable amounts of data yet to be 21
digitized as are already digitized (Stott and Thorne, 2010). Much of this data has 22
been imaged but never digitized. Millions of images exist and even more hard copy 23
archives have yet to be fully cataloged and exploited. This inevitably constitutes a 24
multi-‐year effort. Traditionally this has been done professionally at significant cost, 25
typically for small-‐scale isolated projects. Some initial efforts are being made to 26
broaden the range of approaches including the use of citizen science crowdsourcing 27
(e.g. oldweather.org, data-‐rescue-‐at-‐home.org). These and other mechanisms will 28
need to be pursued to get the data digitized in a reasonable timescale. This effort 29
will need to interface closely with existing projects such as ERA-‐CLIM, IEDRO and 30
ACRE to ensure against duplicate efforts. As such, the Initiative will participate in 31
and contribute to the emerging I-‐DARE data rescue activities being organized under 32
the auspices of WMO CCl 33
(http://www.wmo.int/pages/prog/wcp/wcdmp/documents/IDARE_wcdmp83.pdf) 34
. 35
36
3.3 Metadata
37 38
Development of the databank requires the collection of metadata corresponding to 39
each observation in the databank. A minimal amount of metadata information is 40
required for the most basic use of any data. This information includes station name, 41
coordinates, and station elevation. Additional metadata information is essential for 42
fully understanding the nature of the source of data and for making necessary bias 43
corrections, although more often than not these data are not available. Examples of 44
this type of information includes station history information (dates of station moves 45
formulas used in computing means, and other information pertinent to 1
characterizing the station or station environment. Efforts will continue to be made 2
to collect as much metadata as possible with each source of data. However, it is 3
understood that the quantity and quality of metadata information will vary greatly 4
from one source to another. In the period 2015-‐2017 additional efforts will be made 5
to improve the metadata holdings and make them machine readable and a number 6
of actions have been proposed to this end. These activities might reasonably use the 7
quasi-‐complete US metadata holdings as a working standard format and approach 8
the owners of subsets of the global network who may be amenable in the first 9
instance. Further particulars of the strategy are to be developed by the Databank 10
Working Group members. 11
12
3.4 Parallel measurements database
13 14
The databank working group will work together with an Expert Team on parallel 15
measurements constituted under the Working Group and led by Victor Venema and 16
Renate Auchmann to build and populate a database of parallel measurements to 17
augment the databank. This expert team is building a database with parallel 18
measurements to study non-‐climatic changes in the climate record. In a parallel 19
measurement, two or more measurement set-‐ups are compared to each other at one 20
location. Such data is analyzed to see how much a change from one set-‐up to another 21
affects the climate record. 22
23
24
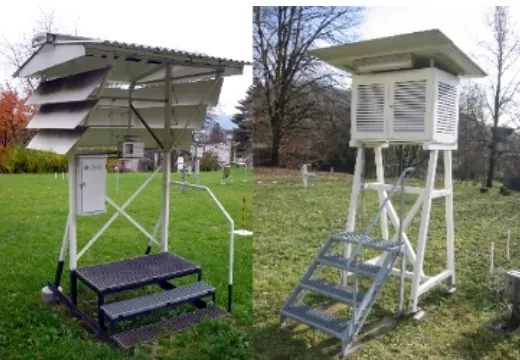
Figure 3. A parallel measurement with a Wild screen and a Stevenson screen in Basel, 25
Switzerland. Double-‐Louvre Stevenson screens protect the thermometer well against 26
influences of solar and heat radiation. The half-‐open Wild screens provide more 27
ventilation, but were found to be significantly affected by radiation errors. In 28
Switzerland they were substituted by Stevenson screens in the 1960s. 29
30
Quite a lot of parallel measurements are and have historically been performed, 31
however they have often only been analyzed for a change in the mean and rarely are 32
the results published beyond the grey literature. It is recognized that there is much 33
important for improving our understanding of the physical and statistical properties 1
of non-‐climatic changes in weather extremes and weather variability. Studies on 2
parallel measurements to date typically analyze single pairs of measurements. In the 3
best cases a regional network is studied. However, the instruments used are often 4
somewhat different in different networks and the influence of a certain change can 5
depend substantially on the local weather and climate and local environment. Thus 6
to draw solid conclusions about the influence of a specific change on large-‐scale 7
(global) trends, we need large datasets with parallel measurements from many 8
locations. 9
10
Studies on changes in the mean can be compared relatively easily with each other to 11
get a big picture understanding. But changes in the distribution can be analyzed in 12
many different ways. To be able to compare changes found at different locations, the 13
analysis needs to be performed in the same way. To facilitate this, gathering the 14
parallel data in a large dataset is beneficial. 15
16
A standard directory and file format has been defined so that the data is easily 17
accessible to all. The data processing, especially quality control and testing for the 18
presence of inhomogeneities (break detection) still needs to be coded. The largest 19
task is likely the handling of the metadata. It is necessary to complete a specification 20
for the metadata needed, ideally through the use of a webform where people can 21
enter this information. And finally the parallel databank will have to be filled and 22
analyzed. 23
24
In addition to the parallel temperature measurements, ideally, related 25
measurements should be stored. For example, to understand the differences 26
between two temperature measurements, additional measurements (co-‐variates) 27
such as insolation, wind or cloud cover are important. Also metadata needs to be 28
collected, stored and should be machine readable. Without meta-‐information on 29
how the parallel measurement was performed, the data are not useful. 30
31
We are interested in parallel data from any source, variable and temporal 32
resolution. High resolution (sub-‐daily) data are very important for understanding 33
the reasons for any differences, and essential to reducing uncertainty in our 34
understanding of extremes There is probably more data, especially historical data, 35
available for coarser resolutions and these data are important for studying non-‐ 36
climatic changes in the means. 37
38
However, the primary focus will be on changes in the distribution of daily 39
temperature and precipitation data in the climate record. Thus, we will compute 40
daily averages from sub-‐daily data and will use these to compute various indices on 41
extreme weather and weather variability. Where the length of the datasets allow 42
this we will additionally compute a subset of the indices of the Expert Team on 43
Climate Change Detection and Indices (ETCCDI), which are often used in studies on 44
changes in “extreme” weather. Where this is not possible similar indices will be 45
inhomogeneities. Actively searching for data, we will prioritize instruments 1
that were used to perform operational climate measurements instead of those only 2
used in experiments. We will also prioritize early historical measurements, which 3
are rarer and are expected to show larger changes . 4
5
Following the principles of the ISTI, the aim is to provide a data set openly available 6
to all with good provenance, i.e., it should be possible to tell where the data comes 7
from. For this reason, the dataset will have levels similar to those in the main ISTI 8
databank, with increasing degrees of processing, so that one can go back to a more 9
primitive level if one finds the need. For this same reason, the processing software 10
will also be made available and open software and programming languages will be 11
used to the greatest extent possible (e.g., the programming language R). 12
13
Although this will ultimately be an open data set, as an incentive to contribute to 14
this effort, initially only contributors will be able to access the data. After joint 15
publications, the dataset will be opened for academic research as a common 16
resource for the climate sciences. Regardless, people using the data of a small 17
number of sources are requested to explicitly cite them, so that contributing to the 18
dataset also makes the value of making parallel measurements visible. 19
20
The basic structure is envisaged to consist of 5 levels: 21
22
0: Original, raw data (e.g. images) 23
1: Native format data (as received) 24
2: Data in a standard format at original resolution 25
3: Daily data 26
4: ETCCDI indices 27
28
29
3.5 Databank working group related activities
30 31
Activity Details Owner Due date
Establish Parallel observations science team
Science team will serve to establish the parallel measurements
collection
Victor Venema (Chair) Members TBD
January 2015
Add at least 10 new sources to Monthly databank and release
version 1.1.
Conduct merge of new sources into monthly databank as part of version 1.1 release
Jared Rennie and
Merge Team March 2015
Plan for
advancing multi-‐ element databank holdings
With the ISTI Steering Committee establish plan for multi-‐element holdings
Lawrimore,
Finish basic data processing of the parallel database
Quality control, inhomogeneity detection and
computation of indices has to be coded.
Published for code review.
Victor Venema, Enric Aguilar, Renate
Auchmann
July 2015
Metadata collection
Add at least two new sources of metadata to Databank
Databank Working Group
September 2015
Addition of new sources to GHCN-‐ Daily
Work with NCDC Science Council and DWG to select and add candidate sources
Matt Menne September 2015
Conduct pilot experiment for extension of IMMA format to land
meteorological data
Select one land source and translate into modified IMMA format
Lawrimore, Woodruff (Guest expert)
November 2015
Collection of parallel
measurements and integrate parallel
measurements into consolidated collection
Integrate data into established format for parallel measurement collection
Parallel observations science team and databank WG, lead by Victor Venema and Jared Rennie
March 2016
Submit paper on the parallel data concept & data processing and a first comparison paper
Most likely first comparison paper is about the transition from Stevenson screens to automatic weather stations
Parallel observations science team
June 2016
Release version 2 of the Monthly Databank
Integrate expanded daily collection into major version release
All, led by Jared
Rennie January 2017
Ongoing activities Advocacy of the databank, efforts to augment holdings
Every effort should be made to engender data submissions
Steering committee, Databank working group
Ongoing
Data rescue Continued pursuit of
support of
crowdsourcing of already imaged forms (such as NOAA foreign data library)
Working Group
Parallel
measurements database data collection
Pursuit of parallel measurements data holdings
Databank
Working Group / Parallel
Observations Science Team
Continuous
1
2
3
4. Engendering dataset algorithm production and participation 4
5
It is recognized that production of data-‐products from the databank is inherently a 6
science process and ill-‐suited to concrete Initiative driven deliverables per se. 7
However, to be a success the Initiative needs to engender multiple contributions of 8
plausible methodological choices, and specifically, algorithms used to remove 9
inhomogeneities from the data. To this end, there is a rolling expectation on the 10
Steering Committee members in particular, but also all ISTI participants, to act as 11
champions of the appearance of new algorithms from the databank and their 12
submission to the benchmarking process (see 5 below). 13
14
Activity Details Owner Due date
Engendering new
dataset efforts Exploit opportunities to promote
awareness of the need for
improvements to and diversity of algorithms, for example by organizing conference sessions and journal special issues and by lobbying funding bodies to support research in this area
Steering committee, working groups
Ongoing
15
5. Benchmark creation and assessment 1
2
Benchmarking represents a unique facet of the Initiative that, if done correctly, will 3
add substantial interpretative value. The principles underlying the benchmarking 4
have been documented in the peer reviewed literature by the working group 5
(Willett et al. 2014). There are three key benefits of such a benchmarking tool: 6
1. Enabling useful inter-‐comparison of independently created data-‐products 7
and gauging fitness for purpose of any specific product 8
2. Aiding methodological advancements through improved understanding 9
and exploration of algorithms with a set of standard benchmarks 10
3. Aiding quantification of uncertainty due to remaining systematic errors 11
within the data-‐product and due to methodological (structural) choices 12
13
The benchmarking exercise is to be cyclical and tied to the databank release cycle– 14
importantly the benchmark ‘analog-‐clean-‐world truths’ will be withheld until 6 15
months prior to the end of the cycle to prevent over-‐tuning to specific ‘analog-‐error-‐ 16
worlds’. Points two and three are applicable after release of the benchmark ‘truths’. 17
However, an open release of a subset of benchmark analog-‐clean-‐worlds and analog-‐ 18
error-‐worlds is envisaged so that such efforts are of immediate benefit to the 19
community and also to help engender a culture of benchmarking. Benchmarking 20
aspects are under the purview of a working group 21
(http://www.surfacetemperatures.org/benchmarking-‐and-‐assessment-‐working-‐ 22
group/). Ongoing discussions and methodological development are conducted 23
through a publicly open blog where although only members can start threads, 24
anyone can read and comment (http://surftempbenchmarking.blogspot.com/). 25
26
5.1 Benchmark definition
27 28
The databank first version release provides the basis for a global scale 29
benchmarking system, hosted in tandem with the actual station data that are 30
accessible to all. Crucially, the benchmarks should test algorithms on real-‐world 31
problems. The analog stations (both clean-‐world and error-‐worlds) should contain 32
realistic characteristics of the climate (e.g., climatology, variance, background 33
trends, natural modes of variability and forcings such as volcanoes and solar cycles, 34
serial autocorrelation, inter-‐station characteristics, etc.). The error models will span 35
a physically plausible range of inhomogeneities (e.g., station moves where the effect 36
on the record depends on radiation [time of day, time of year, cloudiness] and wind 37
speed) including possible optimistic and pessimistic scenarios. Users should be able 38
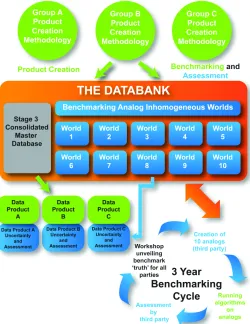
to download the benchmark analog worlds (Figure 4) alongside the identical station 39
network from the databank as these will be in identical formats. Data-‐product 40
creators will be encouraged to run their algorithms on the benchmarks through 41
advocacy from all involved with the Initiative by promoting the clear benefits. 42
43
1
Figure 4. Conceptual flow diagram of scientific outputs from the databank starting with 2
methodologies used to create data-‐products (e.g., homogenization algorithms to 3
produce monthly mean timeseries for a region) through the databank to the end 4
products and the benchmarking and assessment cycle. Image courtesy of NCDC graphics 5
team. 6
7
5.2 Algorithm assessment
8 9
The benchmarks have to be designed in such a way as to maximize the usefulness of 10
the assessment. Four levels of assessment are envisaged: 11
• Level 1 – Adjustment ability: how close are the homogenized analog-‐error-‐ 12
worlds to their analog-‐clean-‐world counterpart in terms of long-‐term trend, 13
climatology, variance etc? 14
• Level 2 – Detection ability: what is the hit rate/false alarm rate for each 15
world, taking into account basic inhomogeneity characteristics (size, 16
frequency, seasonal cycle etc.)? 17
• Level 3 – Specific performance: how does an algorithm perform against a 18
specific problem e.g., missing data, large verses small non-‐stationarity, 19
complex seasonal cycles etc.? 20
• Level 4 – Benchmark validity: how realistic are the benchmarks compared to 21
These four assessments should enable the skill of the algorithm to be assessed (and 1
consequently improved upon) and some level of uncertainty to be ascertained in 2
terms of remaining inhomogeneity or over/under adjustment. The level 1 and 2 3
assessments will be conducted by the Benchmarking and Assessment working 4
group and fed back to the data-‐product creators. Level 3 is more appropriate for 5
algorithm designers to take on independently and all relevant information will be 6
made available to anyone wishing to do this. Level 3 assessments will be actively 7
encouraged as will publication of any results because these are of benefit to the 8
wider community but beyond the capacity of the Working Group. The Working 9
Group will also take on the level 4 assessment. This is an essential component both 10
to feed into the conclusions drawn from level 1 and 2 assessments, which assume 11
the benchmarks are a fair test, and also to allow improvements to the benchmarks 12
for the next cycle. 13
14
5.3 The benchmarking cycle
15 16
The benchmarking is envisaged to take place over a repeated three year cycle, 17
nominally aligned with major updates to the databank, although with a lag to allow 18
developments from the updated databank to be incorporated into the benchmarks. 19
At the beginning of the cycle a set of benchmark analog-‐clean-‐worlds and analog-‐ 20
error-‐worlds will be created and the analog-‐error-‐worlds will be publicly available. 21
Throughout the next three years, testing of any data-‐product creation algorithms 22
associated with users of the databank will be strongly encouraged. Assessments are 23
to be fed back in a timely manner. Data-‐product creators should be allowed to 24
iterate through versions of their algorithms within a single cycle to allow algorithm 25
development. However, analog-‐clean-‐worlds and specifics of the errors applied will 26
not be publicly released until 6 months prior to the end of the cycle, when a 27
workshop will be held, possibly online, to bring together data-‐product creators and 28
benchmark providers. This will aid both future improvements to the benchmarks 29
and dataset algorithm development. 30
31
5.4 Benchmarking activities
32 33
Analog-‐clean-‐worlds open worlds Create software to produce analog-‐clean-‐ worlds on a global scale
Team Creation – lead by Robert Lund and Kate Willett
March 2015
Analog-‐clean-‐worlds global scale
production Produce analog-‐clean-‐
worlds for all blind and open error worlds and
Team Creation – code run and data hosted by Kate Willett
submit methods paper 2 Analog-‐error-‐worlds concepts finalised Using the
defined set of blind and open worlds define the distribution and statistical probability framework
Team Corruption – lead by Claude Williams & Victor Venema
April 2015
Analog-‐error-‐worlds open worlds Create software to produce analog-‐error-‐ worlds for at least the open worlds
Team Corruption – lead by Claude Williams & Victor Venema and coding by Kate Willett
July 2015 (potential workshop )
Analog-‐error-‐worlds blind worlds (official benchmarks)
Produce analog-‐error-‐ worlds from the analog-‐ clean-‐worlds ready for distribution as official benchmark data
Team Corruption – lead by Claude Williams &Victor Venema
August 2015
Benchmarking Platform Design Create a webpage showing step-‐ by-‐step ‘How to
benchmark’ with
appropriate links to data, validation and
intercomparis on tables with registration
All – lead by
so that feedback can be provided and contact maintained Benchmark Cycle Release of analog-‐
error-‐worlds Release first official benchmarks – publicise widely
All – lead by
Kate Willett September 2015
PhD on Daily benchmarking completed Phd on designing, using and providing assessment for a daily mean surface temperature benchmark comes to an end
Rachel Warren – supervised by Kate Willett and Ian Jolliffe (and Trevor Bailey – non-‐ member)
Septembe r to March 2015/201 6)
Validation concepts finalised Decide upon tests with which to perform validation
Team Validation – lead by Ian Jolliffe
October 2015
Error world methods paper Describe concepts of how the error worlds are built
Team Corruption – lead by Claude Williams and Victor Venema
January 2016
Validation proof-‐of-‐concept Create
software and score system/ intercomparis on tables to run the validation on a proof-‐of-‐ concept scale
Team Validation – lead by Ian Jolliffe
March 2016 (potential workshop )
Validation global scale production Produce software and framework
Team Validation – lead by Ian
ready for running on the global scale –
automated or manual
Jolliffe
Validation methods paper Describe
concepts of validation for benchmarkin g
Team Validation – lead by Ian Jolliffe
December 2016
Deadline for submission of benchmark
results Homogenisers to submit
their
homogenised benchmark data and a set of specified statistics
Dataset creatorsTea m
Validation – lead by Ian Jolliffe
March 2018
Benchmark Cycle – release of the
‘answers’ Release the ‘answers’
(analog-‐
clean-‐worlds)
All – lead by
Kate Willett March 2018
Organise benchmark cycle 1 wrap-‐up
workshop Plan and run a workshop, perhaps in conjunction with full ISTI meeting or other conference? Resource dependent.
All – lead by
Kate Willett Early 2018
Return of assessment of benchmark
homogenisation Supply all appropriate statistics to the dataset creators
Team Validation led by Ian Jolliffe and working group
Septembe r 2018
Publication of benchmark results and
assessment of the cycle Assess the success/value of the first benchmark cycle
Benchmarki ng working group
January 2019
improvement s made from previous cycle and different issues
explored with the error worlds
ng working
group decided
Ongoing activities
Advocacy of ISTI and the benchmarks and support for users
Presentation of concepts and progress at relevant conferences and events
All Ongoing
Maintenance of the website Keep up to date with publications, blog posts, members, regional inhomogeneit ies document summary
All Ongoing
Up to date reference list of work on inhomogeneities in surface
temperatures on the website
(www.surfacetemperatures.org/benchm arking-‐and-‐assessment-‐working-‐group)
Ongoing throughout but will have formed the basis for defining error model spread.
Benchmarki ng and Assessment working group led by Kate Willett
Ongoing
1
2
6. Analysis, Visualization and dataset portal 3
4
A crucial element of success is engaging data-‐product creators and data-‐product 5
users. A data-‐portal is proposed, to hold any value-‐added product originating from 6
the databank. The portal must be easy to search and download and effort will be 7
needed to advertise its presence and its purpose such that all data-‐product creators 8
feel inclined to upload their products there and keep them up to date. Any product 9
in the data-‐portal would ideally have supplementary information alongside: the 10
benchmarking assessment report (if appropriate); a data-‐source list; any related 11
latter would ideally include an audit trail of methodological steps taken and source 1
code although this is not essential. 2
3
To aid users, a functional suite of visualization and inter-‐comparison tools is to be 4
created. Data-‐product creators may also wish to upload key graphics alongside their 5
data-‐product with appropriate copyright and citation. 6
7
This aspect of the Initiative is yet to be formalized. It was not possible to establish a 8
working group at the Exeter meeting and so it is now within the realm of the 9
Steering Committee to create this working group. Once the databank and 10
benchmarks are at a sufficient maturity it is envisaged that the steering committee 11
will instigate a working group with input from initiative sponsors to investigate and 12
oversee these aspects of the initiative. 13
14
Activity Details Owner Due date
Instigate analysis, access and
visualization working group
Steering
committee June 2015
15
16
7. Reporting 17
18
Reporting on progress and issues will be open and transparent. To not overburden 19
the Steering Committee or working groups, only annual formal reporting will occur. 20
This reporting shall be to Initiative sponsors and be posted online without 21
restriction. Working groups will report in advance to the Steering Committee. All 22
meetings are expected to be documented and the minutes posted online. 23
24
Activity Details Owner Due date
Regular
teleconferences For Steering Committee and any groups formed under auspices of the Initiative. Minutes posted online.
Steering
Committee Quarterly or more frequently.
Formal annual written report on Initiative
By Steering Committee to sponsors and posted online
Steering Committee
Every January
Formal written reports on working group progress
From working groups to Steering Committee and posted online
1
8. Communication, collaborations and outreach 2
3
8.1 Communications and outreach
4 5
Efforts are required to engage both expert and non-‐expert audiences in the work of 6
the Initiative. Much of this is envisaged to be achieved through business as usual 7
updates of the blog and website. The steering committee and members of the 8
working groups are encouraged to inform relevant science meetings of progress 9
through talks or posters. The steering committee will undertake periodic reviews of 10
communication strategy and make efforts to optimize the ability to communicate 11
with users through either dedicated mailing lists or existing mailing lists. 12
13
8.2 Collaborations
14 15
Collaborations are envisaged with numerous partner initiatives with similar 16
objectives. These will be reviewed periodically but include at least ACRE, 17
MeteoMet2, EUSTACE, and the Earthtemp initiative. Collaborations are also 18
envisaged with our Initiative sponsors. 19
20
The MeteoMet2 consortium, a continuation of the Meteomet project, consisting of 21
European National Institutes of Metrology (NMIs) as funded partners, REG (grant 22
beneficiaries) organizations and collaborators such as Universities and research 23
centers is working in cooperation with ISTI. The main focus of this liaison is the 24
study of methods to provide documented evaluation of uncertainty components to 25
be introduced in temperature data series, such as instrument uncertainties, 26
calibration procedures and associated calibration uncertainties, quantities of 27
influences etc. Meteomet2 is also interested in instigation of reference quality 28
measurements. 29
30
Members of MeteoMet2 also sit in relevant Metrological bodies, such as the CIPM 31
(BIPM) comité consultatif de thermométrie CCT, the technical committee on 32
thermometry of EURAMET (TC-‐T) and the TC12 of IMEKO. The MeteoMet2 33
coordinator is chair of the CCT task group on environmental thermometry and the 34
ISTI Chair is a member of that group. 35
36
The international Atmospheric Circulation Reconstructions over the Earth (ACRE) 37
initiative (http://www.met-‐acre.org/) both undertakes and facilitates the recovery 38
of historical instrumental surface terrestrial and marine global weather 39
observations to underpin 3D dynamical weather reconstructions (reanalyses) 40
spanning the last 200-‐250 years. Such reanalyses outputs can then be downscaled to 41
higher resolution for the full range of climate applications (e.g. impacts, extremes 42
and risks) needs worldwide. ACRE is run by a consortium of nine core partners, and 43
is part of the Global Framework for Climate Services (GFCS). The initiative provides 44
an umbrella that links together some 100+ projects, institutions, organisations, and 45
the major data projects that ACRE links with, and historical surface land 1
temperature records recovered and digitized by ACRE are made readily available for 2
inclusion in the ISTI databank. ACRE and its various activities have been ratified by 3
the WMO Commission for Climatology, extolled in a letter of recognition from GCOS, 4
supported by the Global Earth Observations System of Systems (GEOSS) and 5
endorsed by the Joint WMO/IOC Technical Commission for Oceanography and 6
Marine Meteorology (JCOMM) Expert Team on Marine Climatology, the 7
Intergovernmental Ocean Commission (IOC), and by the World Climate Research 8
Programme (WCRP). 9
10
The EarthTemp Network is a research networking initiative funded by the UK 11
Natural Environment Research Council but with an international agenda. Its aim is 12
to stimulate new international collaboration in measuring and understanding the 13
surface temperatures of Earth across all domains of Earth’s surface and using (and 14
inter-‐relating) the full range of “temperature” measurements. This involves 15
specialists in different types of measurement of surface temperature, who do not 16
necessarily meet. In the context of ISTI, the Visiting Scientist programme associated 17
with the EarthTemp Network offers a flexible opportunity for travel and subsistence 18
resources. Science visits up to 1 month in duration are fundable, as are focused 19
workshops of several parties. There must be some UK and some non-‐UK 20
involvement, which presents no difficulty in the ISTI context. In the White Paper 21
that emerged from the first EarthTemp Network meeting (Merchant et al., 2013), 22
themes relevant to ISTI are: making datasets easier to obtain and exploit; 23
developing understanding of relationships between different surface temperatures, 24
including surface air temperature; providing more realistic uncertainty information 25
about datasets. These areas are priorities at Network meetings and for Visiting 26
Scientist proposals. 27
28
EUSTACE is a new Horizon 2020 project led by the UK Met Office aiming to create 29
globally complete surface temperature estimates using satellite and in-‐situ data. To 30
ensure collaborations and best advice to this new project ISTI has representation on 31
the EUSTACE Scientific Advisory Panel. The project will run from 2015-‐2018. 32
33
Finally, several members of the Initiative have been elected to serve in the present 34
4-‐year term of the Commission for Climatology: 35
• Rapporteurs on Climate Observational Issues: Peter Thorne, Jay Lawrimore 36
(or Jared Rennie) 37
http://www.wmo.int/pages/prog/wcp/ccl/opace/opace1/RP-‐COI-‐1-‐3.php 38
• Expert Team on Education and Training (ET-‐ETR): Enric Aguilar 39
http://www.wmo.int/pages/prog/wcp/ccl/opace/opace5/ET-‐ETR-‐5-‐1.php 40
• Expert Team on Climate Risk and Sector-‐Specific Climate Indices: Lisa 41
Alexander 42
http://www.wmo.int/pages/prog/wcp/ccl/opace/opace4/ET-‐CRSCI-‐4-‐ 43
1.php 44
http://www.wmo.int/pages/prog/wcp/ccl/opace/opace1/ET-‐DARE-‐1-‐ 1
2.php 2
• Task Team on Homogenizsation (TT-‐HOM): Xiaolan Wang, Matthew Menne, 3
Blair Trewin, Victor Venema 4
http://www.wmo.int/pages/prog/wcp/ccl/opace/opace2/TT-‐HOM-‐2-‐4.php 5
• CCl-‐WCRP-‐JCOMM Joint Expert Team on Climate Change Detection and 6
Indices (ETCCDI): Xiaolan Wang 7
The work of several of these teams is likely to be relevant to ISTI’s activities, 8
particularly the Rapporteurs on Climate Observational Issues, ET-‐DARE and TT-‐ 9
HOM. 10
11
8.3 Funded opportunities
12 13
Tasks in MeteoMet2 and possible follow on activities can be directly addressed to 14
respond to needs of the ISTI thus benefiting the initiative. Grants can be requested 15
to the European Metrology research Program (and possibly to the following EMPIR 16
program) for researchers to work in cross cooperation between the ISTI and the 17
European metrology community. Initiative members will consider the viability of 18
applying for COST or similar funding to enable one or more meetings of participants 19
and participating analysts. Further, efforts will be made to enable smaller focused 20
meetings on specific topics as resources permit using mechanisms such as but not 21
limited to the Earthtemp visiting scientist program. 22
23
Activity Details Owner Due date
COST-‐type meeting or ISSI program viability
Initial decision point on viability of funding request
All, especially members with experience of these
September 2015
Ongoing activities Maintenance of
website and blog Materials updated and highlighted on a regular basis.
Steering
Committee Ongoing
Promotion of Initiative through relevant meetings
Talks or posters All Ongoing
Setting up of other communication mechanisms
Mailing list, other means to
propagate information to users
Steering
committee Ongoing
24
9. Consolidated work plan 25
26
This section solely serves to combine work items detailed in previous sections of the 27
1
Activity Details Owner Due date
Ongoing Maintenance of
website and blog Materials updated and highlighted on a regular basis.
Steering
Committee
Promotion of Initiative through relevant meetings
Talks or posters Steering
Committee
Regular
teleconferences, at least quarterly
For Steering Committee and any groups formed under auspices of the Initiative. Minutes posted online.
Steering
Committee
Formal annual written report on Initiative. Each January
By Steering Committee to
sponsors and posted online Steering Committee
Formal written reports on working group progress. Each October
From working groups to Steering Committee and posted online
Working groups
Advocacy of the benchmarks and support for users
All group members should be encouraging use of the benchmarks and providing support where necessary
Benchmarki ng and Assessment working group, Steering Committee
Maintenance of the
website Keep up to date with publications, blog posts,
members, regional
inhomogeneities document summary
Benchmarki ng and assessment working group
Up to date reference list of work on
inhomogeneities in surface
temperatures on the website (www.surfacetem peratures.org/ben chmarking-‐and-‐
Ongoing throughout but will have formed the basis for defining error model spread.
Benchmarki ng and Assessment working