OPTIMIZATION OF HS-SPME-GC METHOD FOR DETECTION OF
STORED GRAIN INSECTS
Yonghao Niu1,2,3*, Giles Hardy3, Lei Hua2, Robert Trengove3, Manjree Agarwal1,3, Hui Cheng1,3, Yonglin Ren1,3,4
1Australia Cooperative Research Centre for National Plant Biosecurity, LPO Box 5012,
Bruce, ACT 2617
2College of Plant Protection, Northwest A&F University, Yangling, Shaanxi, 712100, China 3School of Biological Science and Biotechnology, Murdoch University, South Street,
Murdoch, WA, 6150, Australia
4Australia Department of Agriculture and Food, Western Australia, 3 Baron-Hay Court South
Perth, WA, 6151
*Corresponding author’s email: [email protected]
ABSTRACT
Headspace solid phase micro-extraction (HS-SPME) coupled with gas chromatography (GC) is a useful sample preparation, volatile extraction and separation method for analysis of volatile compounds from stored grain insects and their hosts. However, for using this high-quality analytical method, there is a need to optimize a range of factors to ensure good extraction efficiency. These factors include fibre selection, column selection and sample preparation. In this paper, six types of polar and non-polar fibre
the HS-SPME of volatile chemicals from wheat, wheat flour and two species of stored grain insects Tribolium castaneum (Herbst) and Rhyzopertha dominica (Fabricius). The results showed that the not only extracted the maximum number of volatile organic chemicals (VOCs), but also captured the largest mass of VOCs for subsequent detection by GC. Optimum sample sealing time, fibre extraction time, desorption time and temperature were 24 h, 4 h, 5 The GC results of volatiles from different samples gave different patterns of GC spectrum, which indicated that different volatile compounds were released from the different samples. Therefore, this study provides a detailed sequence of HS-SPME-GC optimization steps that can be applied towards the development of HS-SPME-GC methods to detect stored grain insects.
Key words: Wheat, wheat flour, Rhizopertha dominica, Tribolium castaneum, volatiles, solid phase micro-extraction, gas chromatography
INTRODUCTION
and manually inspecting these samples for adult insects by sieving, flotation and Berlese-funnels (Neethirajan et al., 2007). These techniques can easily trap or detect adult insects but not suitable to find immature insects. X-ray imaging and near infrared reflectance (NIR) spectroscopy have been studied for the detection of stored grain insects as they can detect hidden insects (Milner et al., 1950). However, the operation of these technologies is relatively complicated and there has been no success with in-situ detection.
A good potential detection method is to analyse the air within a grain mass for specific VOCs released by insects. Insect odours or aromas, which are identified through volatile chemical signals, could be used to demonstrate the presence of insects in grain storage facilities. Headspace solid phase micro-extraction (HS-SPME) coupled with gas chromatograph (GC) is probably the method that could compromise between cost and sensitivity (Reuss, 2003). This sample preparation and volatile detection method has been used to examine volatile secretion from stored grains and grain insects because sample preparation is rapid, sampling is integrated, and the extraction, concentration and introduction of the samples to an analytical instrument occurs in one solvent-free step (Risticevic et al., 2010). However, use of GC in combination with SPME requires optimization of various sample preparation and GC parameters which affect the extraction efficiency and GC sensitivity. Therefore, the objective of this research was to provide a detailed sequence of HS-SPME-GC optimization steps that can be applied towards the development of HS-HS-SPME-GC methods to detect stored grain insects.
This paper reports a systematic laboratory study on the a) selection of a suitable fibre which can absorb the maximum number of volatiles from wheat, wheat flour, T. castaneum (H.) and R.dominica (F.); b) development of optimum sample preparation procedures; and (c) the evaluation of optimum GC conditions to achieve the maximum number and best resolution of peaks.
MATERIALS AND METHODS
Grain pre-treatment
The newly harvested (2011-2012) wheat (Australia Standard Wheat I) used for this experiment was procured from CBH (Co-operative Bulk Handling), Western Australia. The moisture content was 11.5% (w/w, Electronic Moisture Meter, PFEUFFER, HOH-Express 50, Kitzingen, Germany). The wheat sample was placed in sealed glass jars (4 L) and stored in a fridge at -4°C for one week to kill any live insects, and then stored at 4°C until use.
The wheat flour was made from the same frozen wheat described above. A coffee
was conditioned at room temperature (25 2 C) for 24 h.
Insects culture
Glassware and SPME fibres
One hundred mL Erlenmeyer flasks (Fisher Scientific, Quickfit, U.K.; Cat. No FE 100/3) equipped with cone/screw-thread adapter (Crown Scientific, Code ST 5313, Wantirna South VIC 3152, Australia) with 7/16” blue septa (Grace Davison Discovery Sciences, Cat. No. 6518, Vic 3178, Australia) were used for samples preparation. The measured volume of each Erlenmeyer flask and inlet system was calculated from the weight of water required to fill the
container. t. No.
57300-
-(PDMS/DVB; Cat. No. 57326-(DVB/CAR/PDMS; Cat. No.
57348-all from Analytical Sigma-Aldrich, Sydney, Australia, and 57348-all were conditioned prior to use,
Apparatus and instruments
A 6890 model Agilent GC manufactured by Agilent Technology (Palo Alto, CA, USA) equipped with a Zebron
ZB-film thickness, polar column) and Flame Ionization Detector (FID) was used to analyse the volatile profiles extracted by HS-SPME.
General procedures
The HS-SPME-GC method included the following procedures: (1) incubate samples for different period, (2) extract VOCs from the head space above the sample within the flask using fibres, (3) setup and precondition GC and insert fibres into GC inlet for a certain desorption period, and then remove the fibre and (4) save the GC chromatogram and export into Microsoft Excel spread sheet for further analysis.
Evaluation of fibres and sample processing conditions
Four types of sample including 80 g wheat, 70 g wheat flour, 100 R. dominica adults and 100 T. castaneum adults were placed in 100 mL Erlenmeyer flasks separately sealed with
cone/screw-temperature controlled room.
For fibre selection, the above four samples were extracted; however, only the wheat sample was systematically tested further under different sample processing conditions, such as sample sealing time, extraction time and desorption time. Three replicates for each treatment were conducted.
GC condition
The following GC conditions were used: hydrogen was used as the carrier gas at a constant speed of 40 mL/min, in the
split-for 5 min, inc
increment with a total run of 51 min.
Optimization Scheme
extractions were for 0.5, 1, 2, 4 and 8 h, and (4) fibre remained in the GC inlet for the desorption of volatiles for 1, 3 and 5 min.
Data Analysis
The GC data including retention time, peak height and peak area were collected and integrated by the chromatography software Agilent Chemstation, and then exported to Microsoft Excel for further analysis. The repeatability of replicates from the same sample was verified by checking the chromatogram pattern features such as detected peak retention times, peak heights, and peak areas.
RESULTS AND DISCUSSION
Effect of fibres
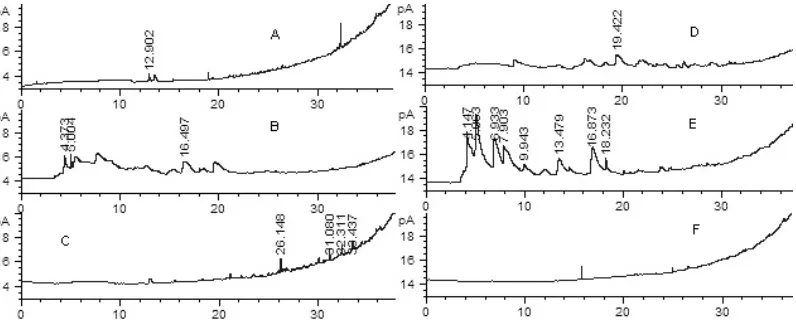
A typical chromatogram of volatiles by six fibres from the wheat sample is given in Fig. 1. Similarly chromatograms were obtained for other samples. Fig. 2 showed the percentage of GC total peak areas from different fibres in four tested samples. All results for wheat, wheat flour, R. dominica and T. castaneum showed that the AR/DVB/PDMS fibre was
three phase fibre, it can extract wide range of components from C2 to C20 (Risticevic et al., 2010) and showed high sensitivity and selectivity for the determination of volatile compounds from all four samples. In the last few years, HS-SPME coupled with GC has been widely used to analyse VOCs from stored grain pests and their hosts, but to date complete VOCs profiles from non polar or polar compounds in stored grain pests and hosts have not been established. Previous research has used either 1 or 2 phase fibre for the detection of metabolites from R. dominica and T. castaneum (Villaverde et al., 2007; Seitz, 2004) and there is a possibility of missing out some compounds hence the need for optimum fibre.
Fig. 2- The percentage comparison of GC total peak areas for six fibres in four samples (The
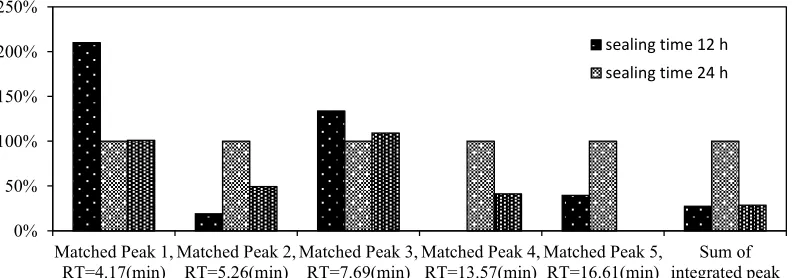
Effect of period of sample sealing
Total peak areas from the different samples sealed for 12, 24 and 48 h are compared in 3. The chromatograms of the three different sealing times are not shown. If the total peaks area of 24 h sealing time was used as 100%,the peak area of the 12 h sealing time had 27% of 24 h, and 48 h sealing sample had 28% of 24 h. This result showed that 24 h sealing period achieved higher efficiency for VOCs extraction from the wheat sample. That is, the equilibrium between the wheat and its volatiles within the flask had an impact on the final volatile extraction by the SPME fibre.
Fig. 3- The percentage comparison of GC total peak areas with 12, 24, and 48 h sealing time in sample preparation (The total peaks area of 24 h sealing time was used as100%). 0%
20% 40% 60% 80% 100% 120%
m PDMS m
CAR/PDMS
m PA m
PDMS/DVB
m DVB/CAR/PDMS
m PDMS
wheat flour R. dominica T. castaneum
0% 50% 100% 150% 200% 250%
Matched Peak 1, RT=4.17(min)
Matched Peak 2, RT=5.26(min)
Matched Peak 3, RT=7.69(min)
Matched Peak 4, RT=13.57(min)
Matched Peak 5, RT=16.61(min)
Sum of integrated peak
Effect of extraction time
Fig. 4 compared the percentage data of the major peaks and the total GC peak areas with
An extraction time of 4 h was the optimum. The extraction time is the time-limiting step of the SPME procedure and is one of the most crucial steps of the development of the SPME method (Kudlejova et al., 2007). During extraction time, sample components in the head-space of the sample transferred to the fibre coating. Thus, different extraction times can affect the fibre absorption results.
Fig. 4- The percentage comparison of GC total peak areas with 0.5, 1, 2, 4 and 8 h extraction time from the wheat sample (The total peak area of 4 h extraction time was used as 100%).
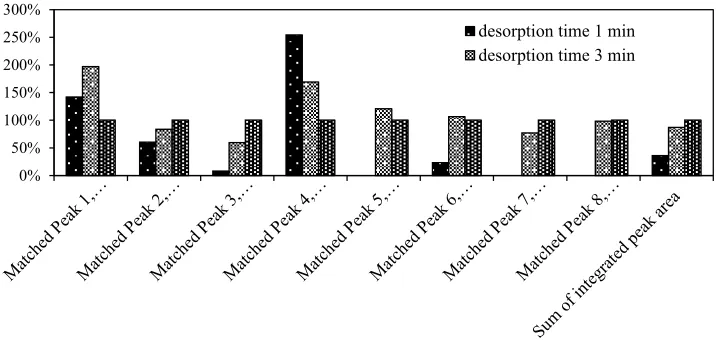
Effect of desorption time
time in the GC inlet are different. Fig. 5 demonstrated the percentage of total GC peak areas for different desorption times of 1, 3 and 5 min. The results showed that more components were detected at 5 min desorption time. Desorption time can influence analytes desorption efficiency, this finally influenced how many compounds were transferred into the GC column. In fact, there are some factors that can affect compounds transfer efficiency such as desorption temperature, carrier gas linear flow rate and desorption time (Kudlejova et al., 2007). In this experiment, same desorption temperature and injector gas flow rate were used for analysing compounds, only different desorption times were tested. The result showed that if the other conditions were same, different desorption time can affect the fibre desorption efficiency.
Fig. 5- The percentage comparison of GC total peak area with 1, 3 and 5 min desorption time from the wheat sample (The total peak area of 5 min desorption time was used as 100%).
ACKNOWLEDGEMENTS
We thank the Australia Cooperative Research Centre (CRC) for National Plant Biosecurity and the China Scholarship Council (CSC) for financial support. We would also like to acknowledge the support of staff from the Separation Science Analysis Laboratory (Murdoch University) for giving Gas Chromatography facility and technical assistance.
REFERENCES
Brett FC (2009) Wheat Science and Trade. Wiley-Blackwell, Ames, Iowa, USA. Page: 6-13. Kudlejova L, Risticevic S, Vuckovic D (2007) Solid phase microextraction method
development. In Handbook of Solid Phase Microextraction: SPME 1st edn (ed. Pawliszyn., J.) 128–171.
Milner M, Lee MR, Katz R (1950) Application of X-ray technique to the detection of internal insect infestation of grain. J Econ Entomol 43: 933-935.
Neethirajan S, Karunakaran C, Jayas DS (2007) Detection techniques for stored-product insects in grain. Food Control 18: 157-162.
Reuss R (2003) Using real-time quality measurement to maintain and increase value across the grain supply chain. Proceedings of the Australian post-harvest technical conference, Canberra, 27-27 June 2003. CSIRO Stored Grain Research Laboratory, Canberra. 49-54. Risticevic S (2010) Protocol for the development of automated high-throughput SPME-GC
methods for the analysis of volatile and semi-volatile constituents in wine samples. Nature Protocols. http://www.nature.com/nprot/journal/v5/n1/full/nprot.2009.179.html. Accessed 7 January 2010
Seitz LM and Ram MS (2004) Metabolites of Lesser Grain Borer in grains. Journal of Agriculture and Food Chemistry 52: 898-908.
Villaverde ML, Juárez MP, Mijailovsky S (2007) Detection of Tribolium castaneum (Herbst) volatile defensive secretions by solid phase micro-extraction capillary gas chromatography (SPME-CGC). Journal of Stored Products Research 43: 540-545.
0% 50% 100% 150% 200% 250% 300%