O R I G I N A L R E S E A R C H
Open Access
Enhanced diagnostic accuracy for quantitative
bone scan using an artificial neural network
system: a Japanese multi-center database project
Kenichi Nakajima
1*, Yasuo Nakajima
2, Hiroyuki Horikoshi
3, Munehisa Ueno
4, Hiroshi Wakabayashi
1, Tohru Shiga
5,
Mana Yoshimura
6, Eiji Ohtake
7, Yoshifumi Sugawara
8, Hideyasu Matsuyama
9and Lars Edenbrandt
10Abstract
Background:Artificial neural network (ANN)-based bone scan index (BSI), a marker of the amount of bone metastasis, has been shown to enhance diagnostic accuracy and reproducibility but is potentially affected by training databases. The aims of this study were to revise the software using a large number of Japanese databases and to validate its diagnostic accuracy compared with the original Swedish training database.
Methods:The BSI was calculated with EXINIbone (EB; EXINI Diagnostics) using the Swedish training database (n= 789). The software using Japanese training databases from a single institution (BONENAVI version 1, BN1,
n= 904) and the revised version from nine institutions (version 2, BN2,n= 1,532) were compared. The diagnostic accuracy was validated with another 503 multi-center bone scans including patients with prostate (n= 207), breast (n= 166), and other cancer types. The ANN value (probability of abnormality) and BSI were calculated. Receiver operating characteristic (ROC) and net reclassification improvement (NRI) analyses were performed.
Results:The ROC analysis based on the ANN value showed significant improvement from EB to BN1 and BN2. In men (n= 296), the area under the curve (AUC) was 0.877 for EB, 0.912 for BN1 (p= not significant (ns) vs. EB) and 0.934 for BN2 (p= 0.007 vs. EB). In women (n= 207), the AUC was 0.831 for EB, 0.910 for BN1 (p= 0.016 vs. EB), and 0.932 for BN2 (p< 0.0001 vs. EB). The optimum sensitivity and specificity based on BN2 was 90% and 84% for men and 93% and 85% for women. In patients with prostate cancer, the AUC was equally high with EB, BN1, and BN2 (0.939, 0.949, and 0.957,p= ns). In patients with breast cancer, the AUC was improved from EB (0.847) to BN1 (0.910,p= ns) and BN2 (0.924,p= 0.039). The NRI using ANN between EB and BN1 was 17.7% (p= 0.0042), and that between EB and BN2 was 29.6% (p< 0.0001). With respect to BSI, the NRI analysis showed downward reclassification with total NRI of 31.9% (p< 0.0001).
Conclusion:In the software for calculating BSI, the multi-institutional database significantly improved identification of bone metastasis compared with the original database, indicating the importance of a sufficient number of training databases including various types of cancers.
Keywords:Bone scintigraphy; Bone scan index; Artificial neural network; Databases; Multi-center study
* Correspondence:[email protected] 1
Department of Nuclear Medicine, Kanazawa University Hospital, 13-1 Takara-machi, Kanazawa 920-8641, Japan
Full list of author information is available at the end of the article
Background
Bone scintigraphy has been accepted as a means to iden-tify bone metastases associated with various types of cancer. Even after the advent of single-photon emission computed tomography combined with X-ray computed tomography, whole-body bone imaging is a standard method to survey the existence and extent of bone me-tastasis. Moreover, although bone scan interpretation may be performed on visual interpretation of whole-body images, an appropriate quantitative approach has been expected. While initial detection of bone metasta-ses is important, quantification of progress of metastasis that results in patients’disability, pain, pathological frac-tures, and mortality would be also beneficial [1,2]. How-ever, there had been no definite imaging method that reflected metastatic disease burden and treatment effect before the advent of bone scan index (BSI) proposed at Memorial Sloan-Kettering Cancer Center [3].
The BSI was developed as a marker of the spread for bone metastasis, which is a fraction of bones involved by a tumor and which realizes the regional distribution of the lesions [4]. The software program for calculating BSI using the neural network system has also been devel-oped using whole-body images with a Swedish database [5]. They successfully applied automatic segmentation of the skeletal regions and automatic detection and feature extraction of hot spots using the neural network system. However, the diagnostic accuracy is potentially influ-enced by training databases. Whether the same database can be used universally in any study population is yet to be determined. The initial version using a Japanese data-base showed promising results with a revised datadata-base, but it was based on a single-center database [6,7].
The aims of this study were to create a multi-center Japanese database based on a large number of subjects with and without definite bone metastasis and to test the diagnostic accuracy compared with the original European database. In addition, to understand the char-acteristics of diagnostic accuracy based on the new
database, a net reclassification improvement analysis was performed [8].
Methods
Patients
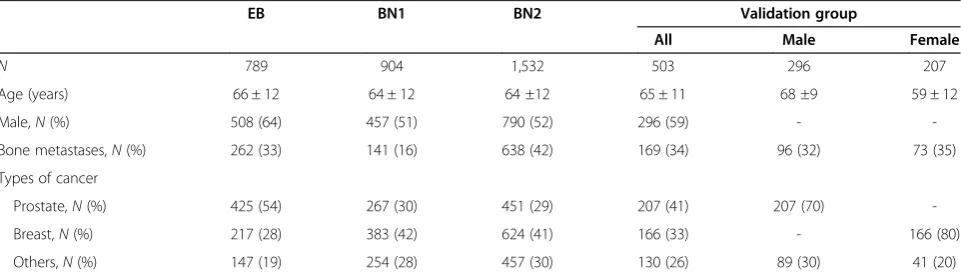
The new multi-center training database used in the de-velopment of BONENAVI version 2 (BN2) comprised 1,532 patients from nine Japanese hospitals (Table 1). The average age was 68 ± 10 (range 20 to 99) years for males and 59 ± 12 (range 26 to 91) years for females. A total of 42% of the patients had bone metastasis, with the underlying cancer being prostate cancer in 29%, breast cancer in 41%, and other cancers in 30% of the cases. In all hospitals, radiology and/or nuclear medicine specialists made the definitive diagnoses. Every hot spot was classified as metastasis or not, based on information from multiple modalities including X-ray computed tomography (CT), magnetic resonance imaging, positron emission computed tomography, and serial bone scan follow-up studies. All patients had X-ray CT studies, and 1,434 (94%) patients had two or more bone scans.
Blood sampling including biochemical bone and tumor markers and the patient clinical courses were also used to reach the gold standard classification. Hot spots most likely due to degenerative disease or arthritis, for ex-ample, in the vertebrae and shoulder joints, were judged as non-metastatic.
The performance of BN2 was compared to that of EXINIbone (EB; version 1.3, EXINI Diagnostics AB, Lund, Sweden) and the first version of BONENAVI (BN1; collaboration between EXINI Diagnostics AB and FUJIFILM RI Pharma, Co. Ltd, Tokyo, Japan). The train-ing database of EB comprised 789 bone scans from a single Swedish hospital [9], and that of BN1 comprised 904 bone scans from a single Japanese hospital [7]. The demographics of the patients from the different training databases are shown in Table 1.
A validation group, used to test the performance of EB, BN1, and BN2, was developed as a second multi-center
Table 1 Demographics of European and Japanese databases and validation groups
EB BN1 BN2 Validation group
All Male Female
N 789 904 1,532 503 296 207
Age (years) 66 ± 12 64 ± 12 64 ±12 65 ± 11 68 ±9 59 ± 12
Male,N(%) 508 (64) 457 (51) 790 (52) 296 (59) -
-Bone metastases,N(%) 262 (33) 141 (16) 638 (42) 169 (34) 96 (32) 73 (35)
Types of cancer
Prostate,N(%) 425 (54) 267 (30) 451 (29) 207 (41) 207 (70)
-Breast,N(%) 217 (28) 383 (42) 624 (41) 166 (33) - 166 (80)
Others,N(%) 147 (19) 254 (28) 457 (30) 130 (26) 89 (30) 41 (20)
group of 503 patients from the same nine Japanese hospitals that participated in the BN2 training database (Table 1). The classification criteria regarding meta-static diseases were the same as in BN2. The underlying malignancies other than breast cancer and prostate cancer (n= 130) were lung cancer (n= 49), renal cancer (n= 17), esophageal cancer (n= 8), gastric cancer (n= 6), thyroid cancer (n= 5), pancreatic cancer (n= 5), and other types of malignancy (n= 4 or less for each type).
To accumulate the scintigraphic images for the data-bases, even though the DICOM data were anonymized, approval of the institutional review board or ethical committee was obtained in all institutions. All the data were accumulated retrospectively. The review boards waived the written informed consent from each patient.
Whole-body bone scan
Whole-body anterior and posterior images were used for the analysis. A standard dose of 555 to 740 MBq of
99m
Tc-methylene diphosphonate (MDP; FUJIFILM RI Pharma, Co. Ltd, Tokyo, Japan) was injected and imaged 3 h (range 2.5 to 5.5 h) later. The matrix size was 256 × 1,024. Energy peak was centered at 140 keV with 15% to 20% windows.
Automated bone scan analysis
The automated method for analysis of anterior and pos-terior whole-body bone scan images has been described previously [9]. Segmentation of the skeleton was per-formed by fitting an atlas to the patient skeleton using Morphon registration for non-rigid image registration. The atlases were based on 10 normal bone scans from European patients for EB and 23 normal bone scans from Japanese patients for BN1, whereas gender-specific atlases were developed for BN2 using normal bone scans from 25 male and 25 female Japanese patients. Regions inside the delineated skeleton with intensities exceeding a threshold were defined as hot spots. This threshold var-ied over different parts of the skeleton and was propor-tional to the overall intensities found in a neighborhood surrounding each hot spot. This made the algorithm equally sensitive to hot spots in low-intensity regions such as the ribs and high-intensity regions such as the lumbar spine. Each individual hot spot was classified as metastasis or not by an artificial neural network (ANN). Separate ANNs were used for each anatomical region, e.g., skull, spine, ribs, pelvis, and femur, and the different ANNs were used as input for specific sets of variables such as size, shape, intensity, and localization of the hot spot. The training databases for EB, BN1, and BN2 were different as described above, and gender-specific ANNs were devel-oped for BN2. The training of the ANNs was performed using customized software at EXINI Diagnostics. The skel-etal involvement of each hot spot was calculated as the
percentage of the total skeleton, and the BSI was calculated as the sum of the skeletal involvement of all hot spots clas-sified as metastases by the ANNs.
Statistical analysis
All the data were expressed as an average and standard deviation. Contingency table analysis was performed to compare values in two groups. The receiver operating characteristic (ROC) analysis was performed and the area under the curve (AUC) was calculated. An optimal cutoff for the sensitivity and specificity could be calcu-lated as the highest value of sensitivity−(1−specificity). The net reclassification improvement (NRI) analysis for identifying bone metastasis was performed using four ANN groups of 0 to 0.24, 0.25 to 0.49, 0.50 to 0.74, and 0.75 to 1.00 [8]. In order to evaluate the effect of the software revisions on BSI, the NRI analysis was also per-formed using four BSI groups of <0.1, 0.1 to 0.99, 1 to 4.99, and≥5.Pvalues <5% were considered significant.
Results
ROC and optimal sensitivity and specificity
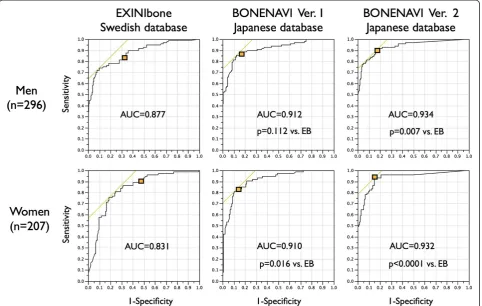
Diagnostic accuracy based on ANN was examined using ROC analysis (Figure 1). Since the databases were made separately for men and women, the ROC AUC based on ANN was calculated in each gender. In men (n= 296), the AUC was 0.877, 0.912, and 0.934 for EB, BN1 (p= not significant (ns) vs. EB), and BN2 (p= 0.007 vs. EB), respectively. The sensitivity was determined as 83% for EB, 88% for BN1 (p= ns vs. EB), and 90% for BN2 (p= ns vs. EB), whereas specificity was determined as 69% for EB, 83% for BN1 (p= 0.001 vs. EB), and 84% for BN2 (p= 0.001 vs. EB). In women (n= 207), the AUC was 0.831, 0.910, and 0.932 for EB, BN1 (p= 0.016 vs. EB), and BN2 (p< 0.001 vs. EB), respectively. The sensitivity was determined as 90% for EB, 81% for BN1 (p= 0.167 vs. EB), and 93% for BN2 (p= 0.774 vs. EB), whereas the specificity was determined as 51% for EB, 87% for BN1 (p< 0.001 vs. EB), and 85% for BN2 (p< 0.001 vs. EB).
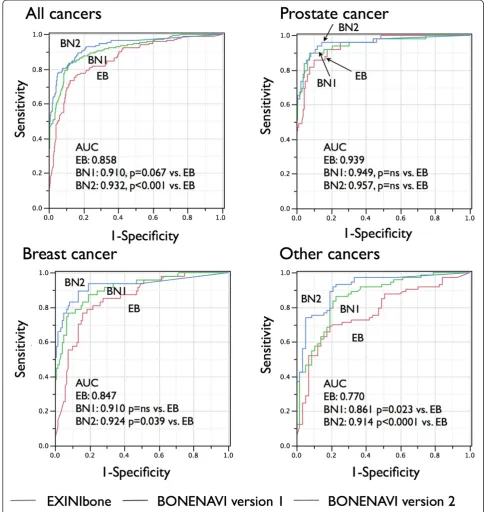
Figure 2 shows differences in ROC curves depending on cancer types. When ANN was used to discriminate metastatic patients with both genders combined, the ROC AUC was 0.858 for EB, 0.910 for BN1 (p= 0.067 vs. EB), and 0.932 for BN2 (p< 0.0001 vs. EB). In pa-tients with prostate cancer, the ROC AUC was not im-proved from EB (0.939), BN1 (0.949), to BN2 (0.957). In patients with breast cancer, however, AUC was improved from EB (0.847) to BN1 (0.910, p= ns) and EB to BN2 (0.924, p= 0.039). In patients with other cancers, AUC was significantly improved from EB (0.770) to BN1 (0.861,p= 0.023) and EB to BN2 (0.914,p< 0.0001).
(p< 0.0001) in patients without metastasis (n= 334) (Table 2). Total NRI was 29.6% and was highly signifi-cant (p< 0.0001). The NRI from EB to BN1 was 17.7% (p= 0.0042) with net gains of −5.3% (p= ns) and−23.1% (p< 0.0001) in patients with and without metastasis, respectively. The NRI from BN1 to BN2 was 10.4% (p= 0.064) with net gains of 10.1% (p= 0.020) and−0.3% (p= ns) in patients with and without metastasis, respectively.
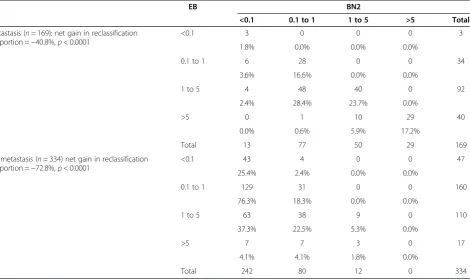
NRI analysis was also performed to evaluate the effect of revision on BSI (Table 3). When EB and BN2 were compared in patients with metastasis, the net gain in re-classification proportion in patients with metastasis was −40.8% (p< 0.0001). In patients without metastasis, the net gain was−72.8% (p< 0.0001). The total NRI was 31.9% and was highly significant (p< 0.0001).
Figure 3 shows a patient with prostate cancer with bone metastasis and a patient with breast cancer without bone metastasis. In the patient with prostate cancer, the metastatic lesions were correctly identified by BN2. The breast cancer patient showed a high BSI with EB and a lower BSI in BN1. The BSI was correctly diagnosed as 0 with BN2.
Discussion
This study was performed as a multi-center project to establish a software program by incorporating a database that includes large number of patients with bone metas-tasis from various cancer types. While the software based on a Japanese single-center database improved the diagnostic accuracy compared with the software based on the original European database, the multi-center database including 1,532 patients further enhanced the diagnostic accuracy. The large training database also made it possible to use gender-specific analysis in BN2.
In addition to the diagnostic use of the software, BSI provides a quantitative measure that reflects the tumor burden expressed as a percentage of total body skeletal mass. The initial study started at Memorial Sloan-Kettering Cancer Center in patients with prostate cancer and showed good reproducibility and a parallel change with prostate-specific antigen [3,4]. BSI has been proved to contain prognostic information in addition to that of conventional prognostic markers such as clinical T stage, Gleason score, and prostate-specific antigen, and it has therefore drawn the attention of oncologists and urolo-gists [10]. When prostate cancer patients were stratified
into, for example, high, intermediate, and low BSI groups, significant differences in survival rate were dem-onstrated [11-13]. On-treatment changes in BSI could be a good response indicator rather than prostate-specific antigen alone in patients with castration-resistant metastatic prostate cancer.
The quantification of bone scans became practical by the use of a computer-aided diagnosis system with
ANN, since the quality of visual bone scan interpretation varied according to readers’ experiences [14]. When the segmentation of the skeletons, hot spot detection, evalu-ation of the characteristics of hot areas, and summed quantitative indexes were available with an automatic method, the reproducibility could be enhanced [5,15]. In a study using EB, a close correlation was demonstrated between manual and automated BSI measurements, and
Table 2 Net reclassification improvement analyses between EB and BN2 based on ANN groups
EB BN2
0 to 0.24 0.25 to 0.49 0.50 to 0.74 0.75 to 1.00 Total
Metastasis (n= 169): net gain in reclassification proportion = 3.6%,p= 0.38
0 to 0.24 1 3 3 3 10
0.6% 1.8% 1.8% 1.8%
0.25 to 0.49 2 2 4 5 13
1.2% 1.2% 2.4% 3.0%
0.50 to 0.74 2 1 5 8 16
1.2% 0.6% 3.0% 4.7%
0.75 to 1.00 1 3 11 115 130
0.6% 1.8% 6.5% 68.0%
Total 6 9 23 131 169
No metastasis (n= 334): net gain in reclassification proportion =−26.0%,p< 0.0001
0 to 0.24 96 31 14 4 145
28.7% 9.3% 4.2% 1.2%
0.25 to 0.49 41 14 5 2 62
12.3% 4.2% 1.5% 0.6%
0.50 to 0.74 34 19 9 5 67
10.2% 5.7% 2.7% 1.5%
0.75 to 1.00 35 11 8 6 60
10.5% 3.3% 2.4% 1.8%
Total 206 75 36 17 334
Total NRI = 29.6%,p< 0.0001.
Table 3 Net reclassification improvement analyses between EB and BN2 based on BSI groups
EB BN2
<0.1 0.1 to 1 1 to 5 >5 Total
Metastasis (n= 169): net gain in reclassification proportion =−40.8%,p< 0.0001
<0.1 3 0 0 0 3
1.8% 0.0% 0.0% 0.0%
0.1 to 1 6 28 0 0 34
3.6% 16.6% 0.0% 0.0%
1 to 5 4 48 40 0 92
2.4% 28.4% 23.7% 0.0%
>5 0 1 10 29 40
0.0% 0.6% 5.9% 17.2%
Total 13 77 50 29 169
No metastasis (n= 334) net gain in reclassification proportion =−72.8%,p< 0.0001
<0.1 43 4 0 0 47
25.4% 2.4% 0.0% 0.0%
0.1 to 1 129 31 0 0 160
76.3% 18.3% 0.0% 0.0%
1 to 5 63 38 9 0 110
37.3% 22.5% 5.3% 0.0%
>5 7 7 3 0 17
4.1% 4.1% 1.8% 0.0%
Total 242 80 12 0 334
the merit of the latter was 100% reproducibility [9]. Owing to simple application, BSI could be incorporated into clinical practice, while patients were diagnosed, treated, and followed up on.
Training databases are essential for a neural network system to diagnose bone metastases. In this study, we used only Japanese patients with definite diagnosis for the exist-ence of bone metastasis. In addition to patient-based diag-nostic accuracy, all the hot areas were confirmed by other imaging modalities and/or follow-up bone scans. Since the BN1 included only 141 (16%) patients with bone metastases from one hospital, it was increased to 638 (42%) patients from nine hospitals. The number of hot spots in ribs, for example, was increased from 2,303 (metastasis 50%) in BN1 to 3,294 (metastasis 43%) in BN2, which contributed to enhancing the learning volumes. When it is utilized in a number of hospitals, the multi-center database judged by multiple experts would be beneficial for enhancing diagnos-tic accuracy in computer learning.
The larger collection of databases including various cancer types is essential for obtaining appropriate BSI values. When we used the EB on Japanese patients for the first time, hot spots indicating high probability of ab-normality were frequently noticed in the skull, shoulder joints, and lumbar vertebrae. These regions included dif-fuse metabolic accumulation in the skull of female pa-tients and degenerative changes in the vertebrae and joints. About half (n= 425) of the Swedish database was from prostate cancer and 28% (n= 217) from breast can-cer. In contrast, the Japanese databases for BN2 included 29% (n= 451) from prostate cancer, 41% (n= 624) from
breast cancer, and 30% (n= 457) from other cancer types. The BN2 databases, therefore, included various cancer types and were closer to the usual clinical envir-onment. From the viewpoint of Japanese population-specific databases, not only the physical stature but also the incidence of degenerative or deformative bone changes might differ between Swedish and Japanese sub-jects. When EB and BN1 were compared, NRI analysis with ANN showed that BN1 increased negative cases in patients without metastasis, indicating significantly de-creased false-positive cases. BN2 further adjusted the diagnostic accuracy and reclassified the metastatic le-sions into the higher ANN groups. With respect to the influence of revisions on BSI, the NRI analysis showed that reclassification was downward in both metastatic and non-metastatic groups. However, reclassification of non-metastatic patients into the lower risk BSI seemed to have meaning, and total net reclassification was im-proved in one third of the patients. The final effect of re-vision on predicting prognosis should be confirmed in future follow-up studies.
Notable effects of training databases differ among prostate, breast, and other cancers. The differences among cancer types seemed to be related to osteoblastic and osteolytic activity of the bone metastases and their imbalance in regulation [16]. Quantitative measurement of bone metastasis or BSI has most widely been used in patients with prostate cancer [9,10,12,17,18]. Prostate cancer shows typical osteoblastic metastasis based on radiological findings, though it is also associated with osteoclastic process and bone resorption. The bone scan
appearance in prostate cancer reveals multiple hot spots and even the so-called superscan in extreme situations. Detecting all metastatic hot areas is important when de-manding an overview of the whole amount of metastasis in prostate cancer. Therefore, the diagnostic accuracy in identifying bone metastasis was high even with EB, and further improvement by BN1 and BN2 was not achieved. In contrast, breast cancer commonly metastasizes to bones and destroys its structure, which causes both osteolytic and osteoblastic appearance in bones. The bone scan might show relatively mild activity or even cold areas in the pure osteolytic lesions. Higher fractions of breast and other cancer types in BN2 as compared with EB were also noted, namely, non-prostate cancer, 46% (n= 364) for EB, 70% (n= 637) for BN1, and 71% (n= 1081) for BN2 (Table 1). To enhance the diagnostic accuracy in breast cancer metastasis, decreasing false-positive hot spots had practically important meaning, and it explained why the diagnostic improvement was obtained in BN1 and BN2 as compared with EB.
Limitations
The detection of metastasis was based on the hot areas, and cold lesions were not included for training the ANN system. However, since most of the diagnosis of the bone metastasis was made by the accumulation of99mTc-MDP, the utility of BSI would not be substantially changed. Although database training was performed using all subjects, specific cancer type-based training, for example, prostate cancer-specific and breast cancer-specific train-ing databases, could be applied. This process requires considerable time for separate training and will be studied in future works. Finally, when the NRI analysis is performed based on skeletal-related events, instead of diagnosis of metastases, true values of BSI will be confirmed in the future.
Even when we consider the possibility of 18F NaF positron emission computed tomography in the future, a similar approach using ANN and new training databases might be an interesting project. What kinds of algorithm of ANN system are appropriate for tomographic images and/or maximum intensity projection images should be investigated.
Conclusion
The Japanese multi-center database significantly im-proved the diagnostic accuracy, showing AUC of 0.93 in both genders with ANN. The improvement from EB to BN1 to BN2 was particularly high in patients with breast cancer and other cancer types, while the diagnostic ac-curacy was equally high in patients with prostate cancer. Reclassification analysis showed that the main improve-ment was the decrease of false-positive results and that non-metastatic patients were reclassified into lower BSI
groups. A large number of training databases including various cancer types were effective in improving the diagnostic accuracy.
Competing interests
LE is employed by and a shareholder of EXINI Diagnostics AB. KN has a collaborative research with FUJIFILM RI Pharma, Co. Ltd, Japan. While FUJIFILM RI Pharma is involved in the distribution of BONENAVI software in Japan, KN has no relationship relevant to the contents of this study to disclose.
Authors’contributions
KN drafted the manuscript and LE and HH edited it. All the authors participated in the study design, and all but LE were involved in the final diagnosis and interpretation of bone scans. KN performed the statistical analysis of the data and YN confirmed it. All authors read and approved the final manuscript.
Acknowledgements
This work was performed as a multi-center study for creating a new database involving nine institutions and supported by the cooperation of medical doctors and technologists in all institutions. Within the multi-center study, the authors would like to express their gratitude for the cooperation of Dr. Tsuyoshi Kawano (Kanagawa Cancer Center); Dr. Kiichiro Kodaira
(International Medical Centre-Comprehensive Cancer Centre, Saitama Medical University); Takeshi Ono, RT (Shikoku Cancer Center); Dr. Koichiro Tsugawa, Dr. Istuko Okuda, Dr. Yasuyuki Kojima, and Yoshiaki Maehara, RT (St. Marianna University School of Medicine); Dr. Kiyoshi Koizumi, Dr. Tsuyoshi Hashimoto, Dr. Kunihito Suzuki, and Kenji Uchida, RT (Tokyo Medical University); Dr. Osamu Manabe (Hokkaido University); and Dr. Kazuhiro Nagao, Dr. Osamu Tokuda, and Yona Oishi, RT (Yamaguchi University). The authors wish to thank Mr. Mattias Ohlsson and Mr. Jens Richter (EXINI Diagnostics, Lund, Sweden), who were involved in software development and training with databases. The authors also thank Mr. Kazunori Kawakami and Mr. Akihiro Kikuchi (FUJIFILM RI Pharma, Co. Ltd, Tokyo, Japan) for their assistance in accumulating all the databases and for their valuable suggestions. They also thank Mr. Ronald Belisle for his editorial assistance and preparation of the manuscript.
Author details
1Department of Nuclear Medicine, Kanazawa University Hospital, 13-1
Takara-machi, Kanazawa 920-8641, Japan.2Department of Radiology St. Marianna University School of Medicine, Kawasaki 216-8511, Japan. 3
Department of Diagnostic Radiology, Gunma Prefectural Cancer Center, Ota 373-8550, Japan.4Department of Urology, International Medical Centre-Comprehensive Cancer Centre, Saitama Medical University, Kawagoe 350-1298, Japan.5Department of Nuclear Medicine, Hokkaido University Graduate School of Medicine, Sapporo 060-8638, Japan.6Department of Radiology, Tokyo Medical University, Tokyo 160-8402, Japan.7Department of Nuclear Medicine, Kanagawa Cancer Center, Yokohama 241-8515, Japan. 8Department of Diagnostic Radiology, Shikoku Cancer Center, Matsuyama
791-0280, Japan.9Department of Urology, Yamaguchi University School of Medicine, Yamaguchi 755-8505, Japan.10Department of Clinical Physiology and Nuclear Medicine, Gothenburg University, Gothenburg 41345, Sweden.
Received: 11 October 2013 Accepted: 10 December 2013 Published: 26 December 2013
References
1. Soloway MS, Hardeman SW, Hickey D, Raymond J, Todd B, Soloway S, Raymond J, Moinuddin M:Stratification of patients with metastatic prostate cancer based on extent of disease on initial bone scan.Cancer
1988,61:195–202.
2. Noguchi M, Kikuchi H, Ishibashi M, Noda S:Percentage of the positive area of bone metastasis is an independent predictor of disease death in advanced prostate cancer.Br J Cancer2003,88:195–201.
3. Erdi YE, Humm JL, Imbriaco M, Yeung H, Larson SM:Quantitative bone metastases analysis based on image segmentation.J Nucl Med1997,
38:1401–1406.
by prostate cancer: the Bone Scan Index.Clin Cancer Res1998,
4:1765–1772.
5. Sadik M, Hamadeh I, Nordblom P, Suurkula M, Hoglund P, Ohlsson M, Edenbrandt L:Computer-assisted interpretation of planar whole-body bone scans.J Nucl Med2008,49:1958–1965.
6. Kikuchi A, Onoguchi M, Horikoshi H, Sjostrand K, Edenbrandt L:Automated segmentation of the skeleton in whole-body bone scans: influence of difference in atlas.Nucl Med Commun2012,33:947–953.
7. Horikoshi H, Kikuchi A, Onoguchi M, Sjostrand K, Edenbrandt L:
Computer-aided diagnosis system for bone scintigrams from Japanese patients: importance of training database.Ann Nucl Med2012,
26:622–626.
8. Pencina MJ, D’Agostino RB Sr, D’Agostino RB Jr, Vasan RS:Evaluating the added predictive ability of a new marker: from area under the ROC curve to reclassification and beyond.Stat Med2008,27:157–172. discussion 207–12.
9. Ulmert D, Kaboteh R, Fox JJ, Savage C, Evans MJ, Lilja H, Abrahamsson PA, Björk T, Gerdtsson A, Bjartell A, Gjertsson P, Höglund P, Lomsky M, Ohlsson M, Richter J, Sadik M, Morris MJ, Scher HI, Sjöstrand K, Yu A, Suurküla M, Edenbrandt L, Larson SM:A novel automated platform for quantifying the extent of skeletal tumour involvement in prostate cancer patients using the Bone Scan Index.Eur Urol2012,62:78–84. 10. Scher HI, Morris MJ, Larson S, Heller G:Validation and clinical utility of
prostate cancer biomarkers.Nat Rev Clin Oncol2013,10:225–234. 11. Sabbatini P, Larson SM, Kremer A, Zhang ZF, Sun M, Yeung H, Imbriaco M,
Horak I, Conolly M, Ding C, Ouyang P, Kelly WK, Scher HI:Prognostic significance of extent of disease in bone in patients with androgen-independent prostate cancer.J Clin Oncol1999,17:948–957.
12. Dennis ER, Jia X, Mezheritskiy IS, Stephenson RD, Schoder H, Fox JJ, Heller G, Scher HI, Larson SM, Morris MJ:Bone scan index: a quantitative treatment response biomarker for castration-resistant metastatic prostate cancer.
J Clin Oncol2012,30:519–524.
13. Kaboteh R, Damber JE, Gjertsson P, Hoglund P, Lomsky M, Ohlsson M, Edenbrandt L:Bone Scan Index: a prognostic imaging biomarker for high-risk prostate cancer patients receiving primary hormonal therapy.
EJNMMI Res2013,3:9.
14. Sadik M, Suurkula M, Hoglund P, Jarund A, Edenbrandt L:Quality of planar whole-body bone scan interpretations–a nationwide survey.Eur J Nucl Med Mol Imaging2008,35:1464–1472.
15. Sadik M, Suurkula M, Hoglund P, Jarund A, Edenbrandt L:Improved classifications of planar whole-body bone scans using a computer-assisted diagnosis system: a multicenter, multiple-reader, multiple-case study.J Nucl Med2009,50:368–375.
16. Guise TA, Mohammad KS, Clines G, Stebbins EG, Wong DH, Higgins LS, Vessella R, Corey E, Padalecki S, Suva L, Chirgwin JM:Basic mechanisms responsible for osteolytic and osteoblastic bone metastases.Clin Cancer Res2006,12:6213s–6216s.
17. Fox JJ, Morris MJ, Larson SM, Schoder H, Scher HI:Developing imaging strategies for castration resistant prostate cancer.Acta Oncol2011,
50(Suppl 1):39–48.
18. Kelly WK, Halabi S, Carducci M, George D, Mahoney JF, Stadler WM, Morris M, Kantoff P, Monk JP, Kaplan E, Vogelzang NJ, Small EJ:
Randomized, double-blind, placebo-controlled phase III trial comparing docetaxel and prednisone with or without bevacizumab in men with metastatic castration-resistant prostate cancer: CALGB 90401.J Clin Oncol
2012,30:1534–1540.
doi:10.1186/2191-219X-3-83
Cite this article as:Nakajimaet al.:Enhanced diagnostic accuracy for
quantitative bone scan using an artificial neural network system: a Japanese multi-center database project.EJNMMI Research20133:83.
Submit your manuscript to a
journal and benefi t from:
7Convenient online submission
7Rigorous peer review
7Immediate publication on acceptance
7Open access: articles freely available online
7High visibility within the fi eld
7Retaining the copyright to your article