Modeling, Optimizing and Control Analysis of a
Debutanizer Column Using Aspen Plus and Aspen
Dynamic
Thesis Report
Eng 470 – Engineering Honours Thesis
ii
Acknowledgment
I welcome this opportunity to convey my gratitude to the Unit Coordinator, Dr.Gareth Lee for providing necessary facilities in the Physics and Engineering Building during the six-month of thesis period. I would be thankful to my supervisor, Dr. Linh Vu for accepting me as one of her thesis students. She always provided me with various information and guidance through the weekly meeting.
iii
Abstract
This thesis project is focusing on the modeling, optimization and control analysis of a debutanizer column using Aspen PLUS and Aspen Dynamics. A complex mixture of hydrocarbons contained a different range of hydrogen and carbon from C2 until nC8 was fed into
the debutanizer column for the separation process. There are two products coming out from this distillation column; the light-end hydrocarbons (C2-C4) and the heavier-end hydrocarbons (C5+).
The C2-C4 became the desired product for debutanizer column which required to be separated
from the mixed hydrocarbons. This C2-C4 was removed from distillate stream as an overhead
product. Meanwhile, the C5+ was removed from the bottoms stream as a bottoms product.
The target of this project was to recover 90% of butane (C4) and maximum 5 mol% of pentane
(C5) composition in the distillate stream. This target was achieved at the end of the project by
obtaining approximately 91.1% of C4 recovery and 4.039 mol% of C5 in the distillate stream.
Therefore, it concluded the recovery of C5 in the bottoms stream was 90.3%.
The debutanizer model was firstly constructed in the Aspen PLUS for steady-state simulation which relied on several specifications of the column and the criteria of the process. The simulation of this separation process was designed using rigorous distillation column simulator, RadFrac. A comparison of physical property methods between Peng-Robinson and RK-Soave were investigated by considering the same theoretical stages in each configuration. Then, the final type of property model was selected depending on the lowest offset from industrial data. A sensitivity analysis was performed to simulate the column within a range of the parameter, and an optimization problem was formulated to be solved.
The steady-state flowsheet generated in Aspen PLUS was exported into Aspen Dynamics to simulate the column in dynamic simulation. The debutanizer system has multiple input variables to control the multiple output variables. Therefore, the relative gain array (RGA) analysis was calculated based on the steady-state gain obtained from open loop transfer functions to find the best pairing of input-output. The conventional Proportional-Integral (PI) and cascade control were implemented into the debutanizer column and both control required to be tuned. Therefore, a relay auto-tuning in Aspen Dynamics was used to determine the ultimate period (Pu) and ultimate gain (KCU) of each process. Then, the controller parameters could be calculated using
iv The control strategy was carried out to observe the process response towards changes of set-point and to analyze the relationships between the process variables (PV) and manipulated variables (MV). The disturbance rejection was performed to determine the success of established control scheme. At the end of the project, multiple comparisons were made between the results obtained from Aspen PLUS and Aspen Dynamics with the literature papers.
v Table of Contents
Acknowledgment ... ii
Abstract ... iii
1. Introduction ... 1
Document Structure... 2
Project Description ... 3
Project Objectives ... 3
2 Literature Review of Debutanizer Column ... 5
Descriptions of Debutanizer Column ... 5
Steady-State Property Parameters ... 6
Dynamic Simulation and Control Strategy ... 11
Optimization and Sensitivity Analysis... 15
Tuning Rules ... 18
Software Overview ... 19
MATLAB ... 19
Aspen PLUS... 19
Aspen Dynamics ... 19
3 Simulation of a Debutanizer Column ... 20
Steady-State Design ... 20
Specifying Chemical Components ... 20
Specifying Distillation Conditions ... 21
Specifying Property Method ... 22
Importing Into Aspen Dynamics ... 25
Column Sizing ... 25
Equipment Sizing ... 27
Control Valves and Pressure Drop ... 29
Dynamic Simulation ... 29
Manual Operation of the Process ... 29
Transfer Functions ... 30
Relative Gain Array (RGA) Analysis ... 32
vi
Tuning Strategy ... 35
Sensitivity Analysis of a Debutanizer Column ... 39
Debutanizer column pressure ... 39
Condenser and Reboiler Heat Duty ... 39
Optimization Design of a Debutanizer Column ... 40
Optimum Number of Stages ... 40
Optimum Reflux Ratio ... 40
Effect on Feed Stage Position ... 40
4 Results and Discussion ... 41
Steady-State Comparison ... 41
Open Loop Step Test ... 47
Performance Analysis ... 55
Set-point Tracking Performance ... 55
Disturbance Rejection Performance ... 69
Statistical Process Chart (SPC) ... 79
Composition Controllers ... 79
Temperature Controllers ... 82
Optimization ... 83
Optimum Number of Stages ... 83
Optimum Reflux Ratio ... 85
Optimum Feed Stage... 86
Sensitivity Analysis ... 87
Condenser and Reboiler Heat Duties ... 87
Debutanizer Column Pressure... 88
5 Conclusion and Recommendations ... 90
Conclusion of the study ... 90
Recommendation for future study ... 91
6 Works Cited ... 92
7 Appendix ... 94
Appendix A: Column Sizing ... 94
Appendix B: Aspen Dynamics (Relay Auto-Tuning Test) ... 95
vii
Appendix D: Steady- State Result ... 99
... 99
Appendix E – Equation and Scripts ... 104
Optimization ... 104
Control Design Interface (CDI) tool ... 104
RGA Calculation for 2x2 subsystems ... 105
RGA Calculation for 5x5 control structure ... 106
List of Tables Table 1: Composition of eight-hydrocarbon components (Jana and Mali, 2010) ... 7
Table 2: Operating specifications for the literature papers ... 9
Table 3: Steady-state result for literature papers ... 10
Table 4: List of manipulated and process variables ... 11
Table 5: Controller configurations of literature papers... 14
Table 6: Operating conditions for sensitivity analysis ... 15
Table 7: Tuning rules in literature papers ... 18
Table 8: Component Selection in Aspen PLUS ... 20
Table 9: Steady-state design data (Jana, 2011) ... 22
Table 10: Recommended property method for gas processing application (2002) ... 23
Table 11: Comparison of Peng-Robinson, RK-Soave with plant data at steady-state... 24
Table 12: Comparison of heat duties between Peng-Robinson and RK-Soave ... 24
Table 13: Sizing of debutanizer column for 0.64m of tray spacing... 26
Table 14: Diameter of debutanizer column ... 27
Table 15: Sizing of reflux drum ... 28
Table 16: Sizing of column base ... 28
Table 17: List of MVs and PVs ... 30
Table 18: Transfer function for debutanizer system ... 31
Table 19: RGA results ... 33
Table 20: Control strategies for debutanizer column ... 34
Table 21: PI Parameters of Default Controllers ... 36
Table 22: PI Parameters of Composition Controllers ... 36
Table 23: PI Parameters of Temperature Controllers ... 37
Table 24: Tuning parameters of the cascade structure... 38
Table 25: Comparison of steady-state results ... 42
Table 26: Result of set-point changes in temperature controllers ... 64
Table 27: Light-key Composition Disturbance ... 69
Table 28: Heavy-key Composition Disturbance ... 71
Table 29: Optimum stage number ... 84
Table 30: Minimum reflux ratio ... 85
viii
Table 32: Optimum feed stage ... 86
Table 33: Sensitivity analysis on condenser duty ... 87
Table 34: Sensitivity analysis on reboiler duty ... 88
Table 35: Sensitivity analysis on column pressure ... 89
Table 36: Column sizing in default tray spacing (0.61 meters) ... 94
Table 37: Hydraulic Profile ... 94
Table 38: Result of Process Stream ... 99
Table 39: Comparison steady-state result between plant data and simulation in Aspen PLUS . 101 Table 40: Result of Process Stream for literature papers ... 102
Table 41: Result of stream during optimization ... 103
Table 42: Transfer function for a 2x2 subsystems ... 105
Table 43: Steady-state gain for 5x5 control structure ... 106
Table 44: Transpose-Inverse Gain Matrix ... 107
Table 45: RGA results for 5x5 control structure ... 107
List of Figures Figure 1: LPG fractionation system (Raheem et al. 2015) ... 1
Figure 2: A flow scheme of debutanizer column ... 6
Figure 3: Manipulated and process variables in a distillation column (Goodwin, Graebe and Salgado 1999) ... 11
Figure 4: Configuration of debutanizer column... 21
Figure 5: Controller Faceplate (Manual Operation) ... 29
Figure 6: Controller chosen in Aspen PLUS ... 32
Figure 7: Cascade structure in Aspen Dynamics ... 38
Figure 8: Change in reboiler duty. Response of a) XD, NC4 b) XB, NC5 c) Reflux drum level d) Column base level e) Column pressure ... 48
Figure 9: Change in reflux flow rate. Response of: a) XD,NC4 b) XB,NC5 c) Reflux drum level d) Column base level e) Column pressure ... 49
Figure 10: Change in bottom flow rate. Response of: a) XD,NC4 b) XB,NC5 c) Reflux drum level d) Column base e) Column pressure ... 50
Figure 11: Change in distillate flow rate. Response of: a) XD,NC4 b) XD,NC5 c) Reflux drum level d) Column base e) Column pressure ... 51
Figure 12: Change in condenser flow rate. Response of: a) XD,NC4 b) XB,NC5 c) Reflux drum level d) Column base level e) Column pressure ... 52
Figure 13: Step Up Test of XD, NC4 Controller ... 56
Figure 14: Step Down Test of XD, NC4 controller ... 57
Figure 15: Step Up Test of XB, NC5 Controller ... 58
Figure 16: Step Down Test of XB, NC5 Controller ... 59
Figure 17: Step Up Test of Pressure Controller ... 60
Figure 18: Step Up Test of Level Controller: Column Base (right) and Reflux Drum (left) ... 60
Figure 19: Step Up Test of TIC-2 Controller... 61
Figure 20: Distillate composition during set-point increase of TIC-2 ... 61
ix
Figure 22: Step Up Test of TIC-15 controller ... 63
Figure 23: Distillate composition during set-point increase of TIC-15 ... 63
Figure 24: Bottom composition during set-point increase of TIC-15 ... 64
Figure 25: Outer-loop of cascade control ... 65
Figure 26: Inner-loop of cascade control ... 65
Figure 27: Set-point tracking between cascade and single temperature controller ... 67
Figure 28: Set-point comparison of composition controller. a: XD, NC4, b: XB, NC5 ... 68
Figure 29: Response during light-key composition as disturbance ... 70
Figure 30: Response during heavy-key composition as disturbance ... 72
Figure 31: Response during feed flow rate as a disturbance ... 74
Figure 32: Response during feed temperature as a disturbance ... 76
Figure 33: Comparison of disturbance rejection in XD, NC4 ... 77
Figure 34: Comparison of disturbance rejection in XB, NC5 ... 77
Figure 35: XD, NC4 controller step up SPC... 79
Figure 36: XB, NC5 controller step up SPC ... 80
Figure 37: XD, NC4 disturbance rejection SPC ... 81
Figure 38: XB, NC5 disturbance rejection SPC ... 81
Figure 39: TIC-2 Controller step up SPC ... 82
Figure 40: TIC-15 Controller step up SPC ... 82
Figure 41: Controller faceplate (Tuning) ... 95
Figure 42: Ultimate gain (Kcu) and ultimate period (Pu) ... 96
Figure 43: Tuning parameters results ... 96
Figure 44: Tuning parameters for composition controller (left: XD, NC4, right: XB, NC5) ... 97
Figure 45: Tuning parameters for temperature controller (left: TIC-15, right: TIC-2) ... 97
Figure 46: Configuration of composition controllers ... 98
Figure 47: Configuration of temperature controllers ... 98
1 | P a g e
1.
Introduction
The processing of natural gas involves several stages of fractionation, aiming for refining the raw natural gas from the mixture of hydrocarbons gas (Khabibullin et al. 2010). These separated hydrocarbons are known as natural gas liquids (NGLs). The NGLs is a mixture of ethane, propane, butane, isobutane, propane, natural gasoline and even higher molecular weight hydrocarbons.
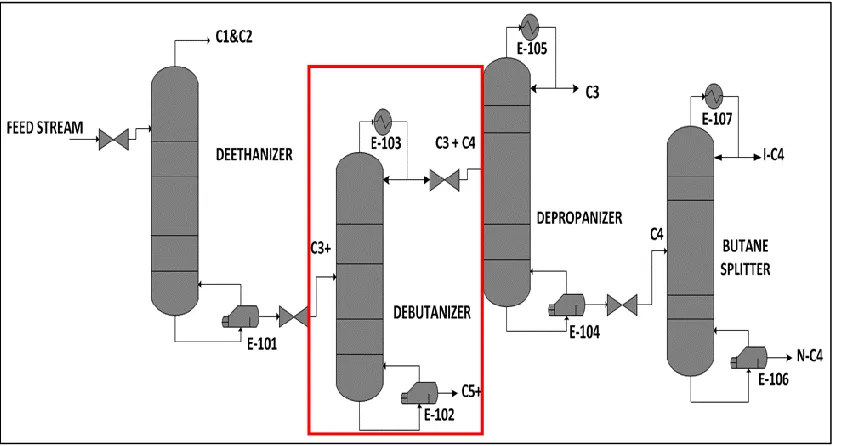
The raw NGLs is removed from the natural gas stream and transferred to the liquefied petroleum gas (LPG) recovery plant for separating LPG from stabilized NGLs. This process is occurring via a series of fractionation columns: a deethanizer, a depropanizer and a debutanizer (Shehata et al. 2015) as shown in Figure 1. The separation process depends on the difference in temperatures at which each component vaporizes and the boiling point which affected by the pressure in the column. The collective LPG mainly comprises three hydrocarbon gases: propane (C3), isobutane
(iC4), and normal butane (nC4).
A debutanizer column is a fundamental unit in oil refineries and petrochemical complexes that responsible for isolating the desired butane (C4) from the mixed hydrocarbons. Therefore, in this
thesis, only the debutanizer column will be designed, simulated and controlled with the help of the computer-aided process engineering tools.
2 | P a g e
Document Structure
This thesis outlines the following sections: Section 1: Introduction
This section introduces the project background, the main propose of the project and the layout of the thesis.
Section 2: Literature Review of the Debutanizer
This section briefly provides the previous work of debutanizer column that simulated in a different type of simulation software, a detailed review of different operating specifications and method of designing the control configurations.
Section 3: Simulation of the Debutanizer
This section reviews the procedures and development of steady-state and dynamic models for debutanizer using Aspen PLUS and Aspen Dynamics. It also displays the calculation of column sizing, the methodology of control structures implements in the dynamic simulation, sensitivity analysis and optimization of the debutanizer.
Section 4: Results and Discussion of Simulation of the Debutanizer
This section presents and compares the results of the current study and the literature papers. It includes the effect of different operating specification during steady-state simulation, the sensitivity analysis, and the optimization.
Section 5: Conclusion and Future Work
This section summarizes the project report and recommends the future work for the next students.
Appendices present at the end of documentation, Section 7:
Appendix A presents the profile for column sizing.
Appendix B shows the relay auto-tuning test in Aspen Dynamics.
Appendix C shows the control structure in Aspen Dynamics.
Appendix D presents the steady-state results in Aspen PLUS.
3 | P a g e
Project Description
This project focuses on the modeling, optimization and control analysis of a debutanizer distillation column for the separation process of an eight-component hydrocarbon mixture. The steady-state and dynamic simulation is performed by reviewing previous work that has been done for the debutanizer column based on information provided by the research papers. There are several modifications from previous work especially in the area of the control structure. The evaluation of the system is observed depending on the outcomes from the steady-state and dynamic simulation.
Project Objectives
The debutanizer model is simulated to study the separation process between light and heavy key components. The separation could be done by developing the column using Aspentech software. The objectives of this case study are outlined below.
To achieve approximately 90% of butane recovery with maximum 5 mol% of natural gasoline composition in the distillate stream.
To investigate the debutanizer column under different operation specification provided in the literature.
To revise the simulation by comparing the simulation results from Aspen PLUS and the result from literature papers.
4 | P a g e
In addition to the operating objectives, this project leads to the series of learning:
To choose appropriate tools for solving a particular engineering problem. Aspentech provides the leading process simulation software used by industries in petroleum refining for the design, operation, and analysis of process behavior.
To develop the techniques in project scheduling, interpreting experiments and technical report writing by referring the ENG470 report guidelines.
To experience the real process of industrial application in a small scope. The debutanizer process designs in the simulation model for operational troubleshooting, sensitivity analysis formulate and optimization problem. In fact, each of data collected will be analyzed and interpreted.
The following tasks are performed to accomplish the objectives:
i. Aspen PLUS is used to simulate the debutanizer model under specific operating conditions. Then, the debutanizer model is optimized, and the sensitivity analysis is conducted in the steady-state simulation to understand the limitation of specific variables.
ii. After obtaining the validate results from steady-state simulation, the model is exported into Aspen Dynamics for dynamic simulation. Here, the step tests in the open loop system are conducted, and the data are collected to determine the transfer functions between manipulated variables (MV) and process variables (PV). The transfer function for each process is obtained using System Identification (IDENT) in MATLAB.
iii. The relative gain array (RGA) analysis is calculated to obtain the recommended pairing of MV and PV. Then, the control structures are implemented based on the RGA pairing.
5 | P a g e
2
Literature Review of Debutanizer Column
Application of debutanizer simulation was completed by previous research papers which aiming for controlling debutanizer process and optimizing the specific conditions to acquire the desired end-product. Various type of simulation software has been used by researchers for calculating the mass and energy balance of this column. For an understanding of simulating the debutanizer column, some background information has been collected and shown in this section which reveals a range of factors affecting the separation process. Below are a few of researchers who have simulated the debutanizer column in the steady-state and dynamic simulation:
Jana and Mali (2010)
Jana (2011)
Ahmadi et al. 2015)
Ahmadi et al. (2015)
Karacan and Karacan (2016)
Bahmani, Shariati and Rouzbahani (2016)
Descriptions of Debutanizer Column
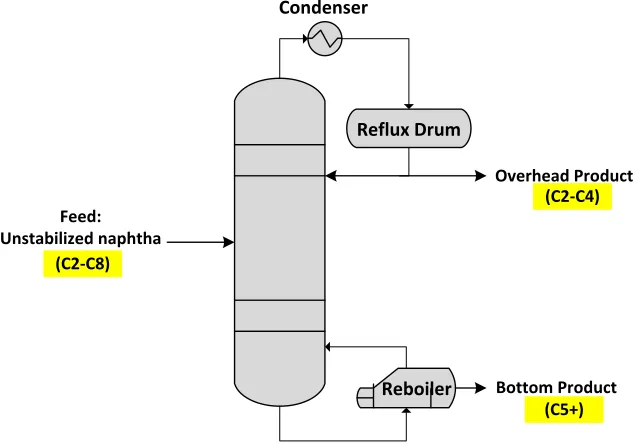
The major distillation equipment is a fractionator, targeting on separating the feed into a vapor portion that moves to the upper part of the column and a liquid portion that moves downward (Liptak 2006). The mixing between the two counter-current flowing phases is crucial in the distillation process for the efficient transfer.
For the debutanizer column, the eight-components hydrocarbon mixture, or known as unstabilized naphtha is introduced on the fifth stage of the column. The feed components are moved downwards into the column and accumulated at the bottoms of the column. Sufficient heat is provided by the reboiler to vaporize the bottoms liquids, and later, the boil-up vapor is returned to the bottoms of the column. The type of reboiler used in this process is kettle reboiler which provides an external forced circulation structure to the column (Liptak 2006).
6 | P a g e
enrich the vapors through the reflux stream. Meanwhile, the remainder is directly transferred to the liquefied petroleum gas (LPG) stream.
This conventional distillation splits the debutanizer naphtha into two streams; the overhead stream and the bottoms product streams. The butane (C4) and lighter hydrocarbons (C2
-C3) are removed from the overhead stream as a light component (Jones and Pujado 2008). The
LPG consist of pentane (C5) and heavier hydrocarbons or known as natural gasoline (C5+) are
withdrawn from the bottoms stream (Khabibullin et al. 2010) before transferred to the naphtha splitter section for the future processing component (Jones and Pujado 2008). Figure 2 shows the schematic diagram of the debutanizer column.
Condenser
Reboiler Reflux Drum
Feed: Unstabilized naphtha
(C2-C8)
Overhead Product (C2-C4)
Bottom Product (C5+)
Figure 2: A flow scheme of debutanizer column
Steady-State Property Parameters
7 | P a g e
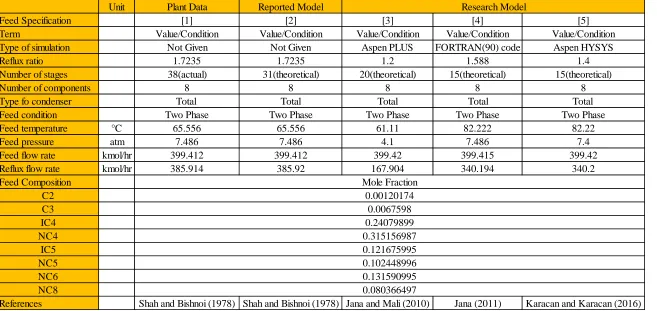
Table 1: Composition of eight-hydrocarbon components (Jana and Mali, 2010)
Jana and Mali (2010) implemented an internal heat integration concept on the conventional debutanizer column for separation of the eight-component hydrocarbon mixture. The theoretical stages were 20 stages, and the feed stage was introduced at stage 10. Aspen PLUS and Aspen Dynamics were used for operating the debutanizer column in the steady-state and dynamic simulation. The end-product composition was targeted to be 0.479 of nC4. The
simulated model was designed based on below assumptions:
The molar vapor holdup is negligible;
Apply the RK-Soave for calculation of vapor-liquid equilibrium (VLE) and enthalpies;
Assume to have an incompressible liquid and a perfect liquid mixing on the trays;
Have a constant pressure drop (0.3 kiloPascal/per stage);
The temperature of cooling water in the condenser is 20 °C.
Jana (2011) presented a simulation model of a 15 theoretical stages debutanizer column and verified the simulated model data with the industrial data proposed by Shah and Bishnoi in 1978. The operating specifications from Jana and Mali (2010) were modified by increasing the reflux ratio, feed stage, feed pressure, and feed temperature. The steady-state results show the final temperature of condenser and reboiler from Jana (2011) was higher than Jana and Mali (2010) due to increase in feed temperature. It concluded the increasing of feed temperature resulted in increasing of the nC4 composition at the overhead stream.
A FORTRAN 90 programming language was used to simulate and calculate the column specification such as vapor root, bubble-point calculation, and the liquid and vapor enthalpies. Two suitable physical properties were studied in this paper to compute the
Component Name Component Formula Feed Composition
ETHANE C2 0.00120174
PROPANE C3 0.0067598
ISOBUTANE IC4 0.24079916
N-BUTANE NC4 0.315157
2-METHYLBUTANE IC5 0.12167645
N-PENTANE NC5 0.10244855
N-HEXANE NC6 0.1315908
8 | P a g e
thermodynamic property for hydrocarbon separations application. These properties were Peng-Robinson (Peng-Rob) and Saove-Redlich-Kwong (SRK). Both physical properties were selected because it consistently predicted the properties of hydrocarbon separation for light and heavy components at low and high temperature. In the end, SRK was chosen for enthalpies calculation and determine the vapor-liquid equilibrium (VLE) in this column. The debutanizer model was designed by applying following assumptions:
The molar vapor holdup is negligible;
Apply the RK-Soave for calculation of vapor-liquid equilibrium (VLE) and enthalpies;
The linear relationship of pressure in the column between the base pressure (PB) and the
top pressure (PT). The top pressure is starting with the lowest pressure of 7.0074 atm and
highest pressure at the base of 8.349 atm;
There is no consideration for sub-cooling in the total condenser;
Well, mixed liquid on the trays.
Karacan and Karacan (2016) used Aspen HYSYS software to perform the dynamic simulation and design the control strategy of the debutanizer column. The column consists of 15 theoretical stages including a total condenser and a reboiler. The reflux ratio was decreased than Jana (2011) to reduce the heat duties. The steady-state results shows the composition of iC4 and
nC4 were kept decreasing as it reaches the bottom stage of the column. Additionally, it proves the reduction in the reflux ratio caused the heat load on reboiler duty to decrease and the column temperature to increase from upper stage to bottom stage.
9 | P a g e
Table 2: Operating specifications for the literature papers
Unit Plant Data Reported Model
[1] [2] [3] [4] [5]
Value/Condition Value/Condition Value/Condition Value/Condition Value/Condition
Not Given Not Given Aspen PLUS FORTRAN(90) code Aspen HYSYS
1.7235 1.7235 1.2 1.588 1.4
38(actual) 31(theoretical) 20(theoretical) 15(theoretical) 15(theoretical)
8 8 8 8 8
Total Total Total Total Total
Two Phase Two Phase Two Phase Two Phase Two Phase
°C 65.556 65.556 61.11 82.222 82.22
atm 7.486 7.486 4.1 7.486 7.4
kmol/hr 399.412 399.412 399.42 399.415 399.42
kmol/hr 385.914 385.92 167.904 340.194 340.2
Shah and Bishnoi (1978) Shah and Bishnoi (1978) Jana and Mali (2010) Jana (2011) Karacan and Karacan (2016) References NC8 IC5 NC5 NC6 0.00120174 Research Model Feed temperature Feed pressure Feed flow rate Term
Feed Specification
Type of simulation Reflux ratio Number of stages Number of components
Feed condition Type fo condenser
0.0067598
0.102448996 0.315156987 Reflux flow rate
10 | P a g e
Table 3 shows the steady-state result for the literature papers. Table 3: Steady-state result for literature papers
Items
Unit Plant Data Reported Model
Steady State Result [1] [2] [3] [4] [5]
Reboiler heat input kW Not Given Not Given Not Given 2930.71 2795
Distillate temperature °C 54.4 57.3 33.45 57.156 57.15
Distillate flow rate kmol/hr 223.919 223.919 139.92 214.204 214.2
Bottoms product temperature °C 122.2 132.4 79.06 125.361 104.8
Bottoms product flow rate kmol/hr 175.496 175.496 259.494 185.211 185.22
Distillate Composition
C2 0.0021436 0.0021436 0.00343033 0.0022396 0.0022
C3 0.012058 0.0120578 0.019164 0.0125736 0.0125
IC4 0.4295284 0.4294212 0.479978 0.4277434 0.4277
NC4 0.55627 0.5554394 0.47884 0.5143382 0.5143
IC5 - 0.0008842 0.0164636 0.0341264 0.0344
NC5 - 0.0000536 0.00217027 0.00893 0.0089
NC6 - - 1.4852E-07 0.0000507 0.00005
NC8 - - 2.03823E-16 0.000000082 0.00000008
Bottoms Composition
C2 5.02636E-20 6.54673E-17 4.41682E-11 0.00000006 0.00000006
C3 4.66712E-12 1.80231E-10 7.09879E-05 0.00003427 0.000034
IC4 8.31205E-05 0.000223978 0.111824 0.02458328 0.0245
NC4 0.00796269 0.008721029 0.226917 0.08478892 0.0847
IC5 0.276430807 0.275642322 0.178411 0.22293856 0.2229
NC5 0.233124641 0.233013929 0.156522 0.21061263 0.2106
NC6 0.299490855 0.299490855 0.202551 0.28372456 0.2837
NC8 0.182907887 0.182907887 0.123704 0.173314 0.1733
References Shah and Bishnoi (1978) Shah and Bishnoi (1978) Jana and Mali (2010) Jana (2011) Karacan and Karacan (2016) Research Model
11 | P a g e
Dynamic Simulation and Control Strategy
This subsection discusses the dynamic simulation of the debutanizer, the tuning methods and the type of control configurations implemented in the literature.
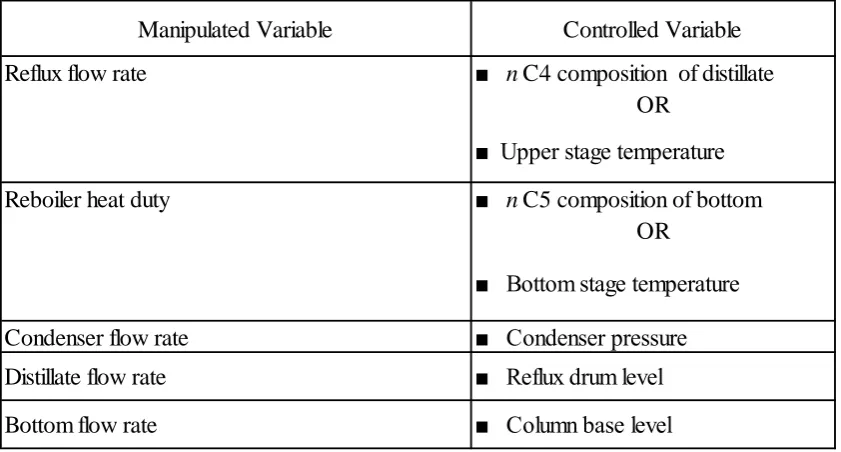
Each of the standard distillation column as shows in Figure 3 is necessarily identifying the manipulated, process and load variables for controller design (Liptak 2006). The process variable is an output variable to be maintained at a particular value to meet the column target (Liptak 2006). The manipulated variable is an input variable that changed to reach and maintain the set-point of process variables. The load variables are variables that introduced the disturbance into the system (Liptak 2006).
Figure 3: Manipulated and process variables in a distillation column (Goodwin, Graebe and Salgado 1999)
Table 4 shows the controller configuration based on Figure 3. Table 4: List of manipulated and process variables
Manipulated Variables Process Variables Distillate flow rate, D Condenser level Bottom product flow rate, B Reboiler level
12 | P a g e
Jana and Mali (2010) proposed the proportional integral (PI) controllers for the closed-loop system in the partial heat integrated debutanizer column. A dual-composition control scheme was developed for maximizing the yield of C4 in the distillate stream. The nC4
composition in the distillate considered as a process variable and controlled by varying reflux mass rate with direct action control loop. The nC5 composition in the bottoms considered as a
second process variable and controlled by manipulating reboiler heat duty with reverse action control loop. The dual-loop composition controllers employed the Tyreus-Luyben tuning approach. The ultimate gain and ultimate period were determined using the relay auto-tuning. The set-point tracking and disturbance rejection performance were conducted to observe the process response between these controllers.
Jana (2011) developed the dual-composition PI controllers for controlling nC5
composition in the distillate and nC4 composition in the bottoms stream. The reflux molar flow
rate and vapor boil-up molar flow rate were chosen as manipulated variables for the respectively controlled variables. Another dual-level PI controller was implemented for holdups control by adjusting the level flow rates. The holdup in reflux drum was controlled by manipulating the distillate flow rate while the holdup in column base was controlled by manipulating the bottoms product flow rate. Two continuous set-point changes were conducted by stepping up and stepping down the set-point of distillate composition. An increased in set-point of the distillate compositionled to the increased of reflux flow rate, bottoms composition,andvapor boil-up rate. Meanwhile, a decrease in set-point of bottoms composition has an opposite response for stepping up distillate composition. The feed flow rate was introduced as the disturbance for the system. The reflux flow rate, thevapor boil-up rate, the distillate and bottoms production were increased when the disturbance was added
Karacan and Karacan (2016) used Aspen HYSYS to operate the dynamic simulation and develop the controller mechanism involving concentration controller and reboiler temperature controller. The concentration of nC4 product at the distillate stream was controlled by
set-13 | P a g e
point tracking was conducted by lowering the set-point of nC4 and bottom temperature for
concentration controllers and temperature controller, respectively. Both MPC and PID controllers were compared based on the response of nC4 concentration and the bottom
temperature towards the changed of input variables. As a result, it concluded the MPC controller has better performance than PID controller. It can be proven by the decreased of time response in MPC controller to reach the desired set-point. Besides that, the step tests also have conducted without the implementation of the controller to analyse the relationship between process variables and controlled variables. From these tests, it shows an increase of reflux flow rate caused increased of nC4 composition while a decrease of reboiler heat duty resulted in decreased
of bottom product temperature.
14 | P a g e
Table 5: Controller configurations of literature papers
References Column
Configuration Types of Controllers Controller Name Manipulated Variables Process Variables
Distillate composition
controller Reflux flow rate
Distillate composition of normal butane
Bottoms product
composition controller Reboiler heat duty
Bottom composition of normal pentane
Distillate composition
controller Reflux flow rate
Distillate composition of normal pentane
Bottoms product
composition controller Vapor boil-up rate
Bottoms composition of normal butane
Distillate level controller Holdup in reflux drum Distillates flow rate
Bottoms product level
controller Holdup in column base
Bottoms product flow rate
Proportional, Integral and Derivative (PID) Controller
Distillate composition
controller Reflux flow rate
Distillate concentration of normal butane
Model Predictive Control (MPC)
Bottoms product temperature
controller Reboiler heat duty
Bottoms product temperature Jana and Mali
(2010) 20 theoretical stages
Proportional and Integral (PI) Controller
Karacan and
Karacan (2016) 15 theoretical stages
Proportional and Integral (PI) Controller 15 theoretical stages
15 | P a g e
Optimization and Sensitivity Analysis
In order to minimize the operating cost and maximize the production yield, some operational conditions affecting separating process should be modified by performing the optimization and sensitivity analysis. The explanation of these analyses provided below.
2.1.3.1 Sensitivity Analysis
Bahmani, Shariati and Rouzbahani (2016) presented the sensitivity analysis of an industrial condensate stabilization unit to modify LPG and NGLs production. The sensitivity analysis was conducted using model analysis tool in Aspen PLUS which depends on the approval of the stabilization unit simulation. Table 6 shows the sensitivity analysis was performed under specified operating conditions to control the process variables.
Table 6: Operating conditions for sensitivity analysis
Analysis 1: Condenser Temperature and Heat Duty.
Bahmani, Shariati and Rouzbahani (2016) operated the debutanizer column under a constant reboiler heat duty and maximum operating pressure. However, the tower operating pressure must be lower than the maximum pressure to avoid the excess pressure imposed on the column. This condition was feasible if the temperature tower constant low.
The decrease of tower operating pressure enhanced the vapor pressure of light-end components at the upper stage and caused the condensation temperature to decrease. The total condenser was required for cooling down the vapors at the lower temperature which generates a saturated liquid stream. It concluded the higher-pressure caused the increment of energy consumption for water-cooling which resulted in the low of the heavy-end components at the vaporous stream and higher condensation temperature.
Operating Variables Process Variables
Debutanizer tower pressure Distillate composition
Condenser heat duty and reboiler heat duty Distillate flow rate
16 | P a g e
Analysis 2: Distillate and Bottoms Product
17 | P a g e
2.1.3.2 Optimization
Ahmadi et al. (2015) conducted the optimization by reviewing several essential specifications affected the operation of the separation process.
1. Equipment sizing such as:
o Column diameter;
o Number of stages;
o Trays spacing;
o Feed location.
2. Operating parameters such as:
o Reflux flow rate;
o Pressure;
o Concentration;
o Temperature
Optimum reflux condition
Ahmadi et al. (2015) determined the optimum reflux ratio to improve the operation of the separation process in debutanizer column. The component purity in the distillate was observed with the focus on achieved zero amount of iC5 by changing the initial reflux ratio to optimum
reflux ratio.
Optimum feed location
18 | P a g e
Tuning Rules
The types of tuning methods that have been implemented into the closed-loop system for each research paper shows in Table 7.
The classical tuning rules implement after obtaining the value of ultimate gain and the ultimate period from the relay auto-tuning. Below is the type of tuning methods mainly used in the literature papers:
i. Ziegler-Nichols ii. Tyreus Luyben
Both Tyreus Luyben and Ziegler-Nichols calculate the tuning parameters either in P, PI or PID mode. Typically, the Tyreus-Luyben is more appropriate implementing in distillation column where there is an aggressive response lead to flooding and dumping due to hydraulic restrictions (Luyben 2013). The Tyreus-Luyben method considers as an improvement from Ziegler-Nicholes for providing less oscillatory response and more efficient in the disturbance performance.
Table 7: Tuning rules in literature papers
Reference Tuning Method Controller Type
Jana and Mali
(2010) Tyreus-Luyben Dual-loop PI structure for Composition Control
Dual-loop PI structure for Composition Control
Dual-loop PI structure for Holdup Control
Single-loop PI structure for Distillate Concentration Control
Single-loop PI structure for Bottoms Stage Temperature Control
Jana (2011) Tyreus-Luyben
Karacan and
19 | P a g e
Software Overview
This subsection discusses the software packages such as Aspen PLUS, Aspen Dynamics, and MATLAB that used to conduct simulations in this thesis.
MATLAB
The MATLAB is an appropriate tool for estimating the transfer function model of the experimental result by using the System Identification Toolbox (IDENT). The transfer function could be implemented on Simulink by creating a model to reflect the real-plant system and simulate the interaction between the open-loop system, controller algorithm, and additional disturbance.
Karacan and Karacan (2016) used IDENT tools to develop a multiple-input and multiple-output (MIMO) transfer function models that based on dynamic simulation operated in Aspen HYHYS. This thesis applied the similar method as Karacan and Karacan (2016) to determine the transfer function of each input-output variable based on the open loop system.
Aspen PLUS
Aspen PLUS is a software package created to allow developing the process model according to the conservative’s laws of mass and energy balance by executing a simple task such as explaining thermodynamic properties and assuming the steady-state behavior of a full-scale plant. This software is a handy tool for simulating system scenarios such as predicting of reaction conversion, the understanding reaction of equilibrium behavior, designing, and sizing of the column.
Aspen Dynamics
20 | P a g e
3
Simulation of a Debutanizer Column
The first part of the chapter describes the characteristics of the steady-state simulation and the methodology of designing a steady-state model, sensitivity analysis and optimization in Aspen PLUS. The second part presents the tuning parameters obtained from the built-in application in Aspen Dynamics and develops the control design interface.
Steady-State Design
The debutanizer model was designed using the operating specification proposed by Jana (2011). Jana (2011) model was selected because the column consists of 15 theoretical stages which similar to the thesis proposal. Additionally, the value of condenser pressure could be obtained from this literature paper. The development of simulation model in Aspen PLUS is described based on the following procedures below.
Specifying Chemical Components
In this phase, the target is to specify the chemical components involved in the separation and understanding components parameters that have been automatically retrieved from the databanks of pure components in Aspen PLUS.
The debutanizer feed is involving a mixture of eight-hydrocarbon components ranging from C2 (methane) to C8 (octane). These components should firstly identify in Aspen PLUS before
creating the column feed flowsheet at the next procedure. The physical property parameters such as molecular weight and critical properties for each component have been stored in an extensive database in Aspen PLUS. Therefore, the chosen component is automatically filled in the required table for component name. Table 8 contains the components formula entered in Aspen PLUS.
Table 8: Component Selection in Aspen PLUS
Component ID Type Component name Formula
C2 Conventional ETHANE C2H6
C3 Conventional PROPANE C3H8
IC4 Conventional ISOBUTANE C4H10-2
NC4 Conventional N-BUTANE C4H10-1
IC5 Conventional 2-METHYLBUTANE C5H12-2
NC5 Conventional N-PENTANE C5H12-1
NC6 Conventional N-HEXANE C6H14-1
21 | P a g e
Specifying Distillation Conditions
Aspen PLUS provides three distillation models: DSTWU, Distl and RadFrac. The DSTWU model is designed for calculation of minimum stages number and minimum reflux ratio. Meanwhile, the Distl model is designed for a specified product recovery by firstly estimating the minimum stages number, minimum reflux ratio, feed tray location and heat duties.
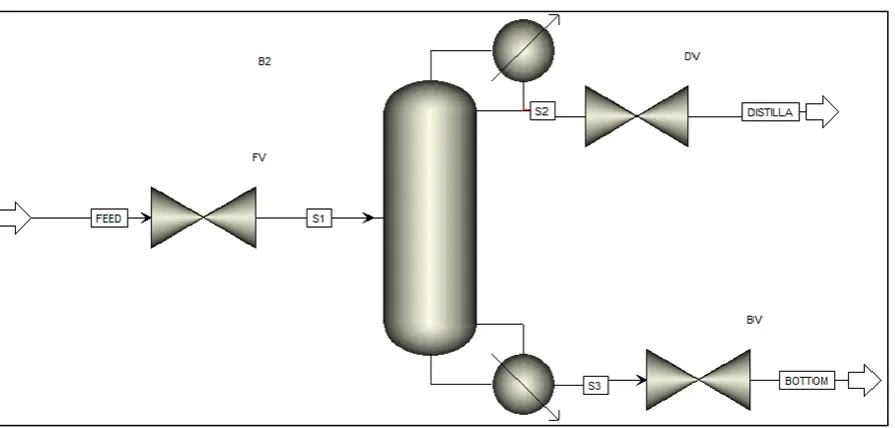
The preferred column is RadFrac model with 15 trays including the condenser with reflux drum and the reboiler. The RadFrac model was chosen because the location of the feed tray, the reflux ratio, and the reflux flow rate already provided in Table 9. In fact, the RadFrac model allows designing of condenser and reboiler characteristics to meet the column’s operation.
The configuration of debutanizer column in Aspen PLUS displays in Figure 4.
22 | P a g e
The simulation model is executed based on the feed specification summarized in Table 9. Table 9: Steady-state design data (Jana, 2011)
Specifying Property Method
The simulation in Aspen PLUS involves the choosing of an appropriate physical property method, which requires calculating the thermodynamic and transport properties for the chemical component system. The thermodynamic properties consist of fugacity coefficient, entropy, enthalpy, volume and Gibbs energy (Aspentech 2001). Meanwhile, transport properties include surface tension, viscosity, thermal conductivity and diffusion coefficient (Aspentech 2001).
The selection of the right property method is very crucial to ensure the accurate calculation of a unit model and to validate the simulation model. The selection of property method is based on the following factors (Edwards 2008):
i. The components composition ii. Type of process.
iii. Operating range of temperature and pressure. Feed Specification
Term Units Value/Condition
Type of simulation - Aspen PLUS
Reflux ratio - 1.588
Number of theoretical stages - 15
Number of components - 8
Type of condenser - Total
Feed condition - Two Phase
Feed Stage - 5
Feed temperature °C 82.222
Feed pressure atm 7.486
Condenser pressure atm 7.0074
Feed flow rate kmol/hr 399.415
Reflux flow rate kmol/hr 340.194
Feed Composition Mole Fraction
C2 kmol/kmol 0.00120174
C3 kmol/kmol 0.0067598
IC4 kmol/kmol 0.24079916
NC4 kmol/kmol 0.315157
IC5 kmol/kmol 0.12167645
NC5 kmol/kmol 0.10244855
NC6 kmol/kmol 0.1315908
23 | P a g e
iv. Type of process phases. v. Nature of the fluids.
vi. Parameters availability in the property model.
Aspen PLUS has four categories of physical property methods:
Ideal Model
Activity Coefficient
Special Model
Equation of State (EOS).
3.1.3.1 Equations of State as Property Method
The EOS model was selected as the property method to model the debutanizer column. The main advantage of EOS is it can implement a wide range of temperature and pressure. It is suitable to be applied to supercritical phases and a mixture of various components, from light gases to heavy fluids calculations (Ramdharee, Muzenda and Belaid 2013). The objectives of EOS are to generate the information including the volume of each component, thermophysical data and to accomplish the vapor-liquid equilibrium (VLE) calculations (Ramdharee, Muzenda and Belaid 2013). In Aspen PLUS, various type of EOSs is available and could be selected depending on the process application. The Peng-Rob, SRK, and RK-Soave with its variations are the most popular of EOS model. Table 10 shows the EOS extensively used for the gas processing application have been narrowed down to several options based on the recommendation in Aspen Guide.
Table 10: Recommended property method for gas processing application (2002)
Based on Table 10, Peng-Rob and RK-Soave are the most applicable property methods for the hydrocarbon separation application. These models are recommended due to the accuracy and consistency for estimating the thermodynamic properties of pure substances and the vapor-liquid mixture under high pressure. Additionally, these EOS only involved two adjustable parameters and merely extended to a more complex mixture of unknown hydrocarbons and could be implemented on the separation system (Jana 2011).
Application Hydrocarbon separations: i. Demethanizer
ii.C3-Splitter
Cryogenic gas processing
Gas dehydration with glycols PR-BM, RKSWS, PRMHV2, RKSMHV2, PRSK, SR-POLAR Recommended Property Methods
24 | P a g e
According to this recommendation, the debutanizer simulation was performed individually using Peng-Rob and RK-Soave in Aspen PLUS. The version of the RK-Soave was compared to the Peng-Rob model based on the accuracy of the VLE, the range of temperature and distillate composition. As both property packages utilized the similar steady-state flowsheet, thus the results of distillate stream and energy duties become the primary factor of comparison between both models.
Table 11: Comparison of Peng-Robinson, RK-Soave with plant data at steady-state
Table 12: Comparison of heat duties between Peng-Robinson and RK-Soave
Referring to Table 11 and Table 12, the lowest offset from the plant data could be achieved using the RK-Soave property method. It then concluded the RK-Soave would be selected for the final steady-state simulation because of the low generated error.
Aspen PLUS section is completed after performing procedures explained above. The next step is the starting point for exporting the model from Aspen PLUS into Aspen Dynamics.
Debutanizer flow rate and Plant Data Peng-Rob RK-Soave
process parameters (Jana 2011) Deviation (%) Deviation (%)
Mole fraction: C2 0.0021436 0.00224057 0.00224057 4.327918131 4.327918126 C3 0.012058 0.012603103 0.012603087 4.325148311 4.325027867 IC4 0.4295284 0.44056852 0.441000702 2.505880344 2.601424942
NC4 0.55627 0.504682858 0.503981486 -10.221695 -10.3750863
IC5 - 0.02675103 0.026905084 0 0
NC5 - 0.012759416 0.012931799 0 0
NC6 - 0.000394199 0.000337028 0 0
NC8 - 3.04039E-07 2.44432E-07 0 0
Distillate mole flow (kmol/hr) 223.9 214.23 214.23 -4.51384027 -4.51384027
Temperature(°C) 54.4 57.93 57.34 6.093561195 5.127310778
Pressure (atm) 7.0074 7.0074 7.0074 0 0
Peng-Robinson RK-Soave
Peng-Robinson RK-Soave
Reboiler Duty 2886.33 2848.11
25 | P a g e
Importing Into Aspen Dynamics
Aspen Dynamics becomes a platform to study the dynamics and the process control. The steady-state simulation is converted in the dynamic simulation by exporting the steady-state information generated in Aspen PLUS into Aspen Dynamics. In addition, the following information must be constructed in Aspen PLUS before the simulation conversion:
1. Specify the physical size of the column and equipment. 2. Implement the control valves.
3. Pressure drop conditions.
Column Sizing
The size of the column is determined based on the diameter and the length of the vessel. The calculation of column size is measured in meter (m).
3.3.1.1 Column Height
The length of the vessel for debutanizer easily calculated as the number of theoretical stages already known. It is recommended to increase the actual column height by 20% more than required (Luyben 2013). This additional space essential for installing the reflux piping at the top of the column and for the feed distributing piping at the feed tray (Luyben 2013). This extra space is also necessary at the column base to determine the liquid holdup needed for surge capacity and to provide sufficient net positive suction head (NPSH) requirement for the pump (Luyben 2013).
Equation 1 is used to estimate the column height:
𝐿 = 1.2(0.61)(𝑁 − 2)
Equation 1: Column height calculation (Luyben 2013)
The standard tray spacing of the column is 0.61m. If the number of theoretical stages (N) is known, then the number of trays is measured by N-2 because of the reflux drum and the reboiler at the top and bottom column, respectively (Luyben 2013). Table 36 in Appendix A shows the calculation of column sizing during the initial simulation using the standard tray spacing which is 0.61m.
26 | P a g e
𝐿 = 1.2(0.64)(𝑁 − 2)
Equation 2: Column height calculation for 0.64m of tray spacing
The column height given by Aspen PLUS is 8.32m which is 20% less than the actual column height of 9.984m. Table 13 shows the sizing of debutanizer column after increasing the tray spacing.
Table 13: Sizing of debutanizer column for 0.64m of tray spacing
3.3.1.2 Diameter of Vessel
The column diameter determines by the maximum vapour velocity (vmax). In debutanizer process, the tray sections start from Stage 2 as the top tray to Stage 14 as the bottom tray. The vapour flow rates change from tray to tray; therefore the tray that contains highest vapor velocity set the minimum column diameter.
Maximum vapor velocity
The diameter of a vessel provided in Aspen PLUS checks by calculating the approximate heuristic which the “𝐹𝑓𝑎𝑐𝑡𝑜𝑟” is equal to 1 (Luyben 2013).
𝐹𝑓𝑎𝑐𝑡𝑜𝑟 = 𝑣𝑚𝑎𝑥√𝜌𝑣
Equation 3: Calculation of maximum vapour volumetric (Luyben 2013).
Where ⍴v is the vapor density in units of 𝑘𝑔
𝑚3, and vmax is the maximum vapour velocity in units of m/s. Therefore, the vmax is 0.2829
𝑚 𝑠.
Units
Section starting stage 2
Section ending stage 14
Tray type SIEVE
Number of passes 1
Tray spacing 0.64 m
Section diameter 1.40872 m
Section height 8.32 m
Section pressure drop 0.07464 bar
Section head loss 1414.43 mm
27 | P a g e
The cross-sectional area of debutanizer column
From the hydraulic profile in Table 37 of Appendix A, the maximum vapour volumetric flow rate (𝑉𝑓) is 0.440964 𝑚
3
𝑠 on Stage 14 and the maximum vapour density (⍴v) on this stage is 0.0185918 𝑐𝑚𝑔3. The cross-sectional area could be calculated corresponds to the vmax using Equation 4. The column diameter is calculated using Equation 5.
𝐴𝑐 = 𝑉𝑓× 1 𝑣𝑚𝑎𝑥
Equation 4: Cross-sectional area of column (Luyben 2013)
𝐴𝑐 = 𝜋 4× 𝐷2 Equation 5: Column Diameter
Table 14: Diameter of debutanizer column
Equipment Sizing
The calculation for equipment sizing has two main parts:
The reflux drum
The sizing of reflux drum depends on the total of the liquid distillate and the reflux.
The column base
The sizing of column base depends on the liquid entering the reboiler from the bottom stage.
A heuristic is used to calculate the equipment sizing by assuming the liquid holdups such as there is 10 minutes of liquid holdup when the column is 100% full.
Units Maximum Vapor Volumetric 0.440964 m3/s Maximum Vapor Density 0.0185918 g/cm3
Maximum Velocity 0.282920664 m/s
Cross-Sectional Area 1.55815091 m2
28 | P a g e
3.3.2.1 Total volume
The total volume of reflux drum and the column base expresses in Equation 6, and the length of diameter ratio is assumed as two for both cases. Table 37 in Appendix A shows the volumetric liquid flow rates for each stage.
𝑉𝑜𝑙𝑢𝑚𝑒 = 𝜋𝐷 2
4 × 2𝐷
Equation 6: Total volume of reflux drum and column base
Table 15: Sizing of reflux drum
Table 16: Sizing of column base
Value Units
Liquid from reflux drum 0.017224 m3 10 minutes holdup
Total volume of reflux drum 10.3344 m3 L/D (Assume)
Diameter 1.873793796 m
Length 3.747587592 m
Reflux Drum
100% Full
2
Value Units
Liquid from column base 0.022909833 m3 10 minutes holdup
Total volume of column base 13.7459 m3 L/D (Assume)
Diameter 2.060714219 m
Length 4.121428438 m
Column Base
29 | P a g e
Control Valves and Pressure Drop
The steady-state simulation is converted to dynamic simulation either in pressure-driven or flow-driven simulation. For the debutanizer case, the steady-state model is converted into Aspen Dynamics in the flow-driven simulation and requires the following configurations:
Three control valves are installed in each stream to enhance the separation process: i. Feed valve (FV)
ii. Distillate valve (DV) iii. Bottom valve (BV)
The top and base pressure is specified as 7.1003 bar and 7.1705 bar, respectively
The pressure drop for each control valve is 0.0054 bar, and the total pressure drop for the column section is 0.07464 bar, according to the calculation of column sizing in Table 13.
Dynamic Simulation
In Aspen Dynamics, the debutanizer process is tested in the open loop and closed-loop system.
The control configuration is developed based on the tuning parameters obtained from a relay auto-tuning test. The efficiency of each controller is examined through the performance of set-point tracking and the disturbance rejection test.
Manual Operation of the Process
Initially, the process is run in “Initialization” mode to ensure the overall system is in a correct condition after the conversion of simulation. Then, the run mode must be switched to “Dynamic” for dynamic simulation.
In the manual operation, the process is operated without any implementation of control action that influences the process behavior. A controller faceplate shown in Figure 5 enables the changing of operation mode from auto to manual action. The results in the open loop system are discussed in Section 4.2.
30 | P a g e
Transfer Functions
The transfer functions of the open loop system are determined via the step change of the process. The open loop tests were performed by introducing the step magnitude of +5% to the manipulated variable individually. The +5% was reasonable as the system, specifically the column levels not relatively change over time. In this current study, there are five manipulated variables and five process variables that lead to a 5𝑥5-control structure. Below is the list of MVs and PVs.
Table 17: List of MVs and PVs
In response to this, 25 transfer functions must be obtained as the result of the input-output combination. The responses of process variable obtained from the step change in the manipulated were used to derive the transfer function model using System Identification Toolbox in MATLAB. Table 18 shows the transfer functions of each manipulated variables and the respective process variables.
Manipulated Variables Process Variables
Reflux flow rate nC4 composition of distillate Distillate flow rate nC5 composition of bottom Bottom flow rate Column base level
31 | P a g e
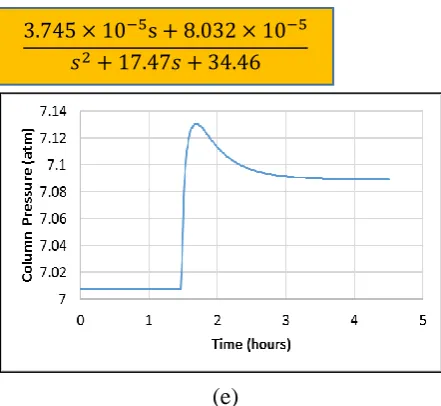
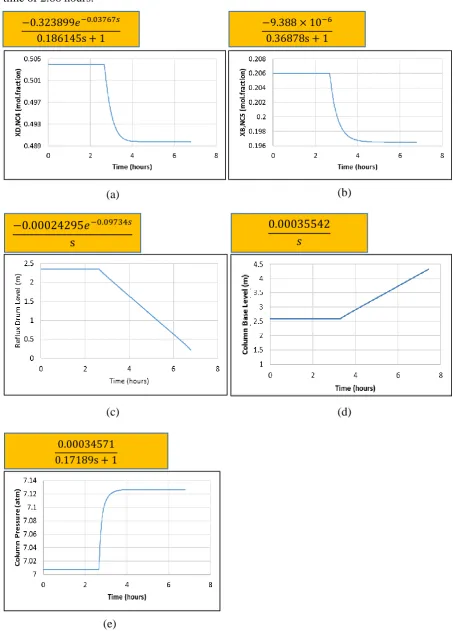
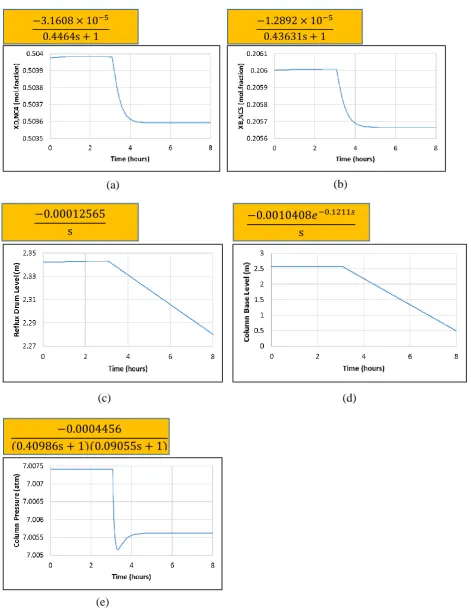
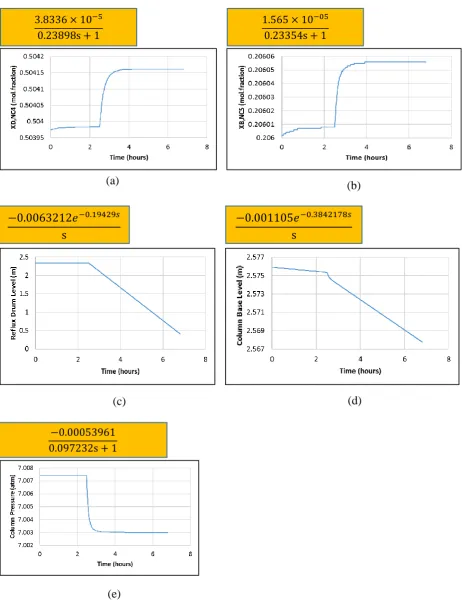
Table 18: Transfer function for debutanizer system
Condenser Medium
Flow Rate (kg/hr)
Reboiler Heat Duty (kW) Reflux Flow Rate (kg/hr) Distillate Flow Rate
(kg/hr)
Bottoms Flow Rate (kg/hr)
Condenser
Pressure
−8.3383 × 10⁻⁵ 0.098008s + 1
3.745 × 10⁻⁵s + 8.032 × 10⁻⁵ 𝑠2+ 17.47𝑠 + 34.46
0.00034571 0.17189s + 1
−0.00053961 0.097232s + 1
−0.0004456
(0.40986s + 1)(0.09055s + 1)
nC4 Distillate
Composition
0.05498𝑒−0.045782𝑠 0.151815s + 1
1.6935 × 10⁻⁷𝑒−0.00014𝑠 0.36545s + 1
−0.323899𝑒−0.03767𝑠 0.186145s + 1
3.8336 × 10⁻⁵ 0.23898s + 1
−3.1608 × 10⁻⁵ 0.4464s + 1
nC5 Bottoms
Composition
2.4788 × 10⁻⁶ 0.095246𝑠 + 1
0.227498𝑒−0.049299𝑠 0.610611s + 1
−9.388 × 10⁻⁶ 0.36878s + 1
1.565 × 10−05 0.23354s + 1
−1.2892 × 10⁻⁵ 0.43631s + 1
Reflux Drum
Level
7.9561 × 10⁻⁵ s
1.5263 × 10⁻⁶𝑒−0.02687𝑠 s −0.00024295𝑒−0.09734𝑠 s −0.00063212𝑒−0.19429𝑠 s −0.00012565 s Column Base Level
−2.4857 × 10⁻⁵ s
32 | P a g e
Relative Gain Array (RGA) Analysis
The relative gain array (RGA) analysis is a method provides the best pairing between process and manipulated variables. From RGA result, the interaction between input-output could be minimized and provides a better control performance that develops under single-input and single-output method (SISO). The RGA calculated as the ratio of the steady-state gain in all open loops to the steady-state gain in all another closed-loop (Babatunde and Ray 1994)
𝜆𝑖𝑗 =
(𝑑𝑦𝑖
𝑑𝑚𝑗) 𝑎𝑙𝑙 𝑙𝑜𝑜𝑝𝑠 𝑜𝑝𝑒𝑛
(𝑑𝑦𝑖
𝑑𝑚𝑗) 𝑎𝑙𝑙 𝑙𝑜𝑜𝑝𝑠 𝑐𝑙𝑜𝑠𝑒𝑑 𝑒𝑥𝑐𝑒𝑝𝑡 𝑓𝑜𝑟 𝑚𝑗 𝑙𝑜𝑜𝑝
Equation 7: RGA between the output variable, 𝒚𝒊and input variable, 𝒎𝒋(Babatunde and Ray 1994)
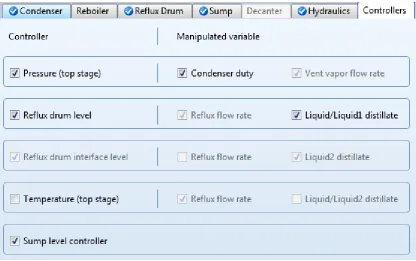
As mentioned in Section 3.4.2, the debutanizer process has the 5𝑥5-control structure. However, three default controllers are automatically created in Aspen Dynamics to control the condenser pressure, reflux drum level, and column base level. Figure 6 shows these controllers could be selected in Aspen PLUS before converting into the dynamic simulation to ensure the flow sheet in a stable condition. The MVs of these controllers are recommended by Aspen PLUS.
33 | P a g e
The composition of the light-key (nC4) and heavy-key (nC5) component are significant to be
observed in the debutanizer column. Therefore, additional two controller compositions are added to control the nC4 in distillate stream and nC5 in the bottom stream.
The pairing of two remaining input-output variables calculated using Equation 7. Table 19 shows the suggested pairings of output variables in bold. The best loop pairing of input-outputs variables selected based on following rules (Babatunde and Ray 1994)
Positive relative gain or closest to “1”
Avoiding the negative relative gains or near to zero
The RGA calculation provided in Section 7.6.3 of Appendix E. Table 19: RGA results
Additionally, the RGA for 5𝑥5-control structure also calculated and shown in Section 7.6.4 Appendix E.
Reboiler Heat Duty Reflux Flow Rate
nC4 Composition of Distillate -2.15806E-11 1
34 | P a g e
Control Strategy
The controller implementation is crucial for a chemical system to achieve the stable conditions for the process operation and regulates the process conditions for obtaining the desired product specifications. Each of the control loops must be necessarily tuned process variables to compensate the disturbance during the system operation.
Additionally, the temperature controllers are implemented to alternate the composition controllers. The cascade control is applied to the system to observe the control performance over single-loop control. Table 20 displays the implementation of the control configuration.
Table 20: Control strategies for debutanizer column
Manipulated Variable Controlled Variable
Reflux flow rate ■ nC4 composition of distillate
OR ■ Upper stage temperature
Reboiler heat duty ■ nC5 composition of bottom
OR
■ Bottom stage temperature
Condenser flow rate ■ Condenser pressure
Distillate flow rate ■ Reflux drum level
35 | P a g e
Tuning Strategy
Each controller in the debutanizer process is tuned individually using the “Auto-tune Variation,” a tuning tool in Aspen Dynamics. The objective of tuning is to achieve the best tuning parameters for applying in the control applications. Appendix B explains the procedure of relay auto-tuning test and the test results. Meanwhile, Appendix C shows the controllers connection in Aspen Dynamics.
3.4.5.1 Default Control Configurations.
As stated before, Aspen Dynamics automatically develops three basic control configurations when opening the dynamic simulation. The three controllers are:
1. Column pressure controller 2. Reflux drum level controller 3. Column base level controller
Controller Parameter of Column Pressure Controller
The pressure at the upper stage was chosen as the pressure to be controlled in this column. The column pressure could be controlled by manipulating either vaporization rate in reboiler, distillate flow rate or condensation rate in the condenser (Smith 2012). In the most distillation column, the column pressure is efficiently controlled using the condensation rate. Therefore, the similar MV was chosen by Aspen PLUS for controlling the pressure of debutanizer column.
Controller Parameter of Reflux Drum Controller
The debutanizer column was operated using a total condenser; hence all overhead vapors will be condensed. This liquid that flows from a total condenser becomes the liquid feed to a reflux drum (Smith 2012). The condensation flow rate is the primary flow of the reflux drum and might be the MV in the reflux drum controller (Smith 2012). However, this input was implemented to control the column pressure.
In controlling the reflux drum level, there are another preference techniques which are by manipulating either reflux or distillate flow rate (Smith 2012). Based on the Aspen PLUS suggestion, the distillate flow rate was selected as the MV for controlling the reflux drum level.
Controller Parameter of Column Base Level Controller
36 | P a g e
base level. Besides that, it is required to control the column base level by manipulating the bottoms flow, when the condensation flow rate controls the column pressure (Smith 2012). Table 21 shows the parameters given by Aspen Dynamics.
Table 21: PI Parameters of Default Controllers
3.4.5.2 Tuning of Composition Controller
During developing a composition controller for the distillation column, the composition of the component to be controlled becomes the most influenced to a significant degree by the controls. In debutanizer column, the composition control loop primarily affects two components:
The light-key in the distillate product: nC4 (XD, NC4). The heavy-key in the bottoms product: nC5 (XR, NC5).
Table 22 shows the PI tuning parameters calculated using Ziegler-Nichols tuning rules in Aspen Dynamics.
The distillate composition controller is tuned by considering the controller operated in direct action loop while bottoms composition controller considers as reverse action loop.
37 | P a g e
3.4.5.4 Tuning of Temperature Controller
The traditional strategy to control stage selection depends on the change of stage temperature. During a control stage temperature, the product composition could be indirectly controlled instead implemented a direct composition measurement into the system.
Two temperature controls stage for debutanizer are: 1. Upper control stage (TIC-2)
The objective is to maintain the distillate composition by maintaining a constant temperature at the upper stage. The temperature at upper stage is controlled by manipulating the reflux flow rate.
2. Bottom control stage (TIC-15)
The objective is to maintain the bottoms composition by maintaining a constant temperature at the bottom stage. The temperature at the bottoms stage is controlled by manipulating reboiler heat duty.
Major changes in temperature at these stages mainly affect the changing of the product composition. Thus, maintaining these temperatures should hold the composition at a desired value and avoiding the increase of the heavy components at the top and light components at the bottom. In debutanizer column, the chosen stage temperatures to be controlled are at the 2nd stage and the15th stage. The chosen stage temperature selected based on where a component is dominantly in the overall composition and at the temperature is most sensitive towards the changes of composition.
Both TIC-2 and TIC-15 controller applied the PI tuning parameters calculated from Ziegler-Nichols tuning rules in Table 23. The TIC-2 controller operated in direct control action while the TIC-15 controller operated in reverse control action.
38 | P a g e
3.4.5.5 Tuning of Cascade Controller
A cascade control structure in Figure 7 was composed by a combination of distillate composition controller (XD, NC4) and bottom stage temperature controller (TIC-15). The inner
controller is the bottom stage temperature, which manipulates by reboiler heat duty. The output of the XD, NC4 (outer controller) is the set-point for the TIC-15 (inner controller).
The inner temperature controller applies P tuning parameters to achieve fast control. Meanwhile, the outer composition controller applies PI tuning parameters. The inner temperature loop is firstly tuned by performing the relay auto-tuning test to obtain the value of P. The outer composition loop is then tuned using the relay auto-tuning, with the inner temperature loop in operation. Both controllers are tuned using Ziegler-Nichols tuning parameters shown in Table 24 and operated in reverse control action.
Figure 7: Cascade structure in Aspen Dynamics
39 | P a g e
Sensitivity Analysis of a Debutanizer Column
The effects of a manipulated variable on a particular design specification are crucial to study. The variables such as column pressure, condenser and reboiler heat duty are interesting to be investigated in the debutanizer. Thus, the sensitivity analysis conducts using “Sensitivity” tool that exists under the Model Analysis folder in Aspen PLUS.
Debutanizer column pressure
The column pressure used in the analysis is determined to reach the best purity of C4 at distillate stream and minimize the reboiler heat duty. Below are the procedures to perform the analysis:
i. Select the tower pressure as a manipulated variable.
ii. Specify the range of pressure from 5 to 7.0074 atm by choosing the equidistant as the type of limits within an interval.
Condenser and Reboiler Heat Duty
The condenser and reboiler heat duty is determined to obtain the desired distillate mass flow rate. Below are the steps to perform the analysis:
i. Select the condenser or reboiler heat duty as a manipulated variable.