Open Access
Research
Analytical and numerical quantification and comparison of the local
electric field in the tissue for different electrode configurations
Selma
Жorovi
ć
, Mojca Pavlin and Damijan Miklav
č
i
č
*
Address: University of Ljubljana, Faculty of Electrical Engineering, Ljubljana, Slovenia
Email: SelmaЖorović- [email protected]; Mojca Pavlin - [email protected]; Damijan Miklavčič* - [email protected]
* Corresponding author
Abstract
Background: Electrochemotherapy and gene electrotransfer are novel promising treatments employing locally applied high electric pulses to introduce chemotherapeutic drugs into tumor cells or genes into target cells based on the cell membrane electroporation. The main focus of this paper was to calculate analytically and numerically local electric field distribution inside the treated tissue in two dimensional (2D) models for different plate and needle electrode configurations and to compare the local electric field distribution to parameter U/d, which is widely used in electrochemotherapy and gene electrotransfer studies. We demonstrate the importance of evaluating the local electric field distribution in electrochemotherapy and gene electrotransfer.
Methods: We analytically and numerically analyze electric field distribution based on 2D models for electrodes and electrode configurations which are most widely used in electrochemotherapy and gene electrotransfer. Analytical calculations were performed by solving the Laplace equation and numerical calculations by means of finite element method in two dimensions.
Results: We determine the minimal and maximal E inside the target tissue as well as the maximal
E over the entire treated tissue for the given electrode configurations. By comparing the local electric field distribution calculated for different electrode configurations to the ratio U/d, we show that the parameter U/d can differ significantly from the actual calculated values of the local electric field inside the treated tissue. By calculating the needed voltage to obtain E > U/d inside the target tissue, we showed that better electric field distribution can be obtained by increasing the number and changing the arrangement of the electrodes.
Conclusion: Based on our analytical and numerical models of the local electric field distribution we show that the applied voltage, configuration of the electrodes and electrode position need to be chosen specifically for each individual case, and that numerical modeling can be used to optimize the appropriate electrode configuration and adequate voltage. Using numerical models we further calculate the needed voltage for a specific electrode configuration to achieve adequate E inside the target tissue while minimizing damages of the surrounding tissue. We present also analytical solutions, which provide a convenient, rapid, but approximate method for a pre-analysis of electric field distribution in treated tissue.
Published: 15 October 2007
BioMedical Engineering OnLine 2007, 6:37 doi:10.1186/1475-925X-6-37
Received: 8 June 2007 Accepted: 15 October 2007
This article is available from: http://www.biomedical-engineering-online.com/content/6/1/37
© 2007 Жorović et al; licensee BioMed Central Ltd.
Background
Electroporation, also termed electropermeabilization, is a phenomenon where increased permeability of cells exposed to an external electric field is observed. The induced transmembrane voltage presumably leads to the formation of aqueous pores in the phospholipid bilayer, which increases the permeability of the cell membrane for water-soluble molecules and ions [1-4]. Electropermeabi-lization is currently widely used in vivo and in vitro in many biological and medical applications including elec-trochemotherapy of tumors (ECT) [5-7], transdermal drug delivery [8,9] and gene electrotransfer [5,10-14].
Electropermeabilization is a phenomenon, where the membrane becomes permeable after the magnitude of the electric field (E) exceeds reversible threshold value (Erev), while E below Erev does not significantly affect the cell membrane. When the magnitude of local electric field E
reaches irreversible threshold value (Eirrev), electric field causes permanent damages on the cell membrane leading to cell death. The threshold values, Erev and Eirrev vary for different tissues in range from 200–400 V/cm and 450– 900 V/cm, respectively [15-19]. Electropermeabilization with E in the range of Erev ≤E <Eirrev reversibly permeabi-lizes the cell membrane and at the same time does not affect the viability of a biological cell. Reversible elec-tropermeabilization has been proven to be successful in electrochemotherapy, where electric field enables chemo-therapeutic drug to enter into tumor cells, and for gene electrotransfer, which can be used for gene therapy, where electric field enables DNA to enter the target cells. Irrevers-ible electroporation with E > Eirrev was suggested for water treatment and food preservation as a method for destruc-tion of the cell membrane of noxious microorganisms and for tissue ablation [20-22].
In this paper we focus on the importance of calculating the local electric field distribution for successful electro-chemotherapy tumor treatment and gene electrotransfer of target cells. Namely, for successful electrochemother-apy it is crucial that all clonogenic cells forming tumor tis-sue are exposed to the local electric field above the threshold value Erev and preferably below irreversible threshold Eirrev. Similarly, successful gene electrotransfer also requires local electric field in the range of reversible electroporation regime (Erev ≤E <Eirrev). It was previously shown by combining numerical modeling and experi-mental approaches that the efficacy of the electrochemo-therapy and gene electrotransfer treatment depends on the magnitude of the local electric field inside the target tissue [17,18,23-28].
However, both threshold values (Erev, Eirrev) differ for elec-trochemotherapy and gene electrotransfer as well as they depend on pulse parameters and the type of treated tissue.
From the theoretical principles it follows that the local electric field inside the tissue is in general a function of time and place E(x, y, z, t). However, since most often elec-tric pulses used in electrochemotherapy and gene electro-transfer are usually long (0.1 – 10 ms) compared to the typical constant for the polarization of the cell membrane (around 1 µs), we can assume steady-state conditions for our analysis [29,30]. The local electric field distribution
E(x, y, z) in the tissue is a complex function of several parameters. It depends on the applied voltage on the elec-trodes, the geometry and position of the elecelec-trodes, and on the non-homogeneous properties and geometry of the tissue. For this reason electric field distribution during electroporation can not be solved analytically except for the most simple cases [31] and therefore numerical meth-ods have to be used [16,25].
In principle there are two complementary approaches to determine the optimal electrode configuration and applied voltage to achieve appropriate local electric field inside the target tissue (E ≥Erev). Ideally one should calcu-late E for each individual case taking into account all geo-metric details and electric properties of the treated tissue in order to assure appropriate local E inside the target tis-sue (i.e. pretreatment planning). However, this requires sophisticated numerical modeling for each individual problem and is in many cases not realistic. Alternatively some approximate estimates of E inside the target tissue are used, where usually a gross approximation U/d "elec-tric field intensity" as defined and reported in a number of different reports [8-10,12,15,32-36] is used as an approx-imate value of E for plate as well as for needle electrodes.
Most of the experimental and clinical studies on electro-chemotherapy were performed with the treatment proto-col (applying eight 100 µs long pulses at the repetition frequency 1 Hz) using the parameter (U/d) from 1300– 1500 V/cm to select applied voltage on the electrodes [26,37]. However, despite the fact that the parameter U/d
is widely used in order to determine the applied voltage, this parameter alone does not give the information about the actual electric field inside the target tissue. It also makes difficult the comparison between different studies reported, especially since exact geometry is usually not given.
electric field inside the target tissue strongly depends on the chosen electrodes and electrode configuration and can be significantly different than the value U/d. In order to quantify and compare different electrode configurations we visualized the regions inside the treated tissue exposed to the local electric field exceeding the value U/d (E ≥U/d) keeping the value U/d for all configurations constant so that the electric field distribution can be directly com-pared between electrode configurations. In addition, we calculate the necessary voltage for a given electrode con-figuration in order to achieve adequate electric field distri-bution in the target tissue. We also demonstrated that changing electrodes' orientation and electrode arrange-ment with respect to the target tissue leads to better expo-sure of the target tissue to the adequate electric field distribution.
Methods
Numerical calculations
Numerical calculations were performed by means of finite element method (FEM) [38] using FEMLAB software packages Femlab 2.3 and 3.0 (Comsol, Sweden). The numerical calculations were performed on the personal computer Intel Pentium 4, 2.40 GHz CPU and 1 GB RAM. The electric field distribution in 2D models was calculated using the steady current module. We analyzed E(x,y) for two parallel plate electrodes (Fig. 1) and different number (2, 4, 6 and 7) and configurations of needle electrodes as shown in Fig. 2. These configurations were chosen based on different reports [15,25,26,33,39-41] where such elec-trodes and electrode configurations were used in electro-chemotherapy and gene electrotransfer in vivo experiments.
In all models the electrodes were positioned inside a square representing homogeneous tissue having a con-stant conductivity. A concon-stant voltage was assigned to the grid points in regions where electrodes were placed, while insulation boundary conditions were set on the remain-ing boundaries. In all cases the constant voltage was applied between the electrodes giving U/d = 1.15 V/cm. The radius a of all needle electrodes was 0.215 mm. The distance d, defined as the distance between the positive
and the negative electrode, was for
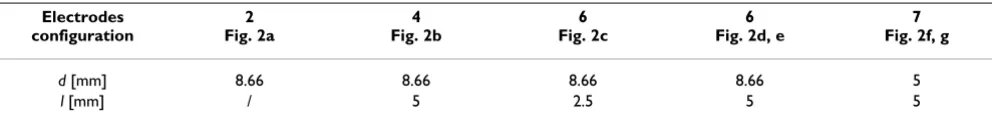
configu-rations shown in Figs. 2a–2e, whereas in configuconfigu-rations shown in Figs. 2f and 2g we set d = l = 5 mm. The dimen-sion of the outer square was 20 mm > 2d in all models, since it was already shown [31] that for model size (boundaries of the outer square) being 2d the error due to the finite size of the model is negligible.
Model geometries were meshed by triangular finite ele-ments. The final mesh models were obtained refining the mesh until the discrepancies of the mean and maximum relative difference between numerical solutions, obtained with two different meshes were negligible. For example, for electrode configuration 2c the final mesh consisted of 86 944 elements. The results of this model were compared to the results obtained with the same electrode configura-tion but coarser mesh which consisted only of 21 736 ele-ments. The relative difference of the mean and the maximum value of the electric field between the two mod-els were 2.14 * 10-6 and 4.22*10-3, respectively.
Analytical calculations – plate electrodes
Analytical solution for the electric field between two infi-nite parallel plate electrodes (Fig. 1a) gives a trivial solu-tion E = U/d, where d is the distance between the
d=5 3 mm
Different needle electrode configurations analyzed in this study
Figure 2
Different needle electrode configurations analyzed in this study.
Three geometries with parallel plate electrodes analyzed in this study (d = 8.66 mm)
Figure 1
electrodes and U is the applied voltage on the electrodes. The electric field strength E is constant in the entire region between infinite electrodes.
Analytical calculations – needle electrodes
As already shown [31], for electrostatic problem analytical solution for the potential and the electric field also around the needle electrodes in 2D can be obtained by solving Laplace equation, if the needle penetration depth is larger than the distance between the electrodes. If we consider Laplace equation of a complex analytic function for a given region:
∆φ(z) = 0, (1)
where z = x + iy, we obtain that the real part of this func-tion Re (Φ(z)) is also a solution of the Laplace equation. The potential can be written as a sum of multipoles of all electrodes, details are given in reference [31]. If higher terms in multipole series are neglected we can write the potential as a sum of the leading terms of all n electrodes:
where a is the radius of an electrode, zn is the position of the n-th electrode and the coefficients Cn are determined from the boundary conditions. The above approximation can be used when a << d (needle electrodes are not too thick compared to typical inter-electrode distance). From Eq. 2 we can obtain the electric field strength from calcu-lating the gradient of the potential:
Results
The results of our study are organized in five subsections. The first and second subsections show the numerical and analytical results of the electric field distribution, respec-tively, for plate and needle electrodes as shown in Figs. 1 and 2. In the third subsection we present the comparison of the numerical and analytical results. In the next subsec-tion we quantify the local electric field for given electrode configurations. Finally, in the last subsection we analyze the effect of tissue inhomogeneities on the local electric field distribution for the needle electrode configurations.
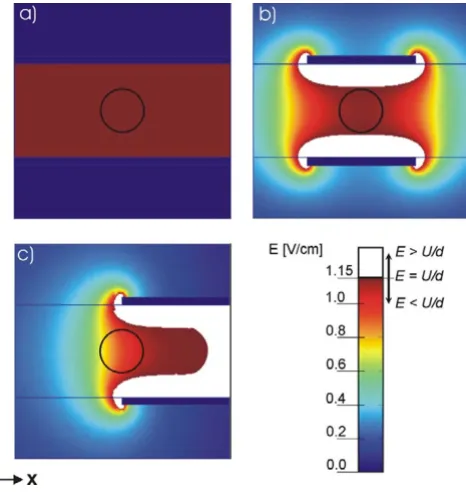
In order to compare and quantify the influence of geome-try, number and position of different electrode configura-tions on the electric field distribution we used the same parameter U/d = 1.15 V/cm in all models. We present the calculated electric field with equal scale of E from 0 to 1.15 V/cm. The values of electric field strength are shown by colour scale legend (see Figs. 3 and 4) with the
maxi-mal value representing the ratio U/d = 1.15 V/cm in order to demonstrate the region below (color scale) and above the value U/d (white region). The encircled region in Figs. 3a–3c and Figs. 4a–4e represent one of the possible geometries and positions of the target tissues. It is within this target tissue that the electric field needs to be suffi-ciently high (E > Erev).
Electric field distribution between plate and needle electrodes – numerical results
All models were calculated for the voltage between two electrodes U = (1 V, 0.575 V) giving the value of parameter
U/d = 1.15 V/cm, but values of E' for any other voltage can be obtained just by multiplying all values with given volt-age U' divided by applied voltage U (1 V, 0.575 V). Namely, since our models are linear all results for E can be scaled for any arbitrary applied voltage U': E' = E U'/U. In the following subsections we will present results obtained for U/d = 1.15 V/cm and scaled results for U/d = 1300 V/ cm.
φ( )z C log a ,
z z C
n
n n
N =
− +
=
∑
1
0 (2)
E z C
z z
n n n
N
( )= .
−
=
∑
11
(3)
Calculated electric field distribution for the geometries with parallel plate electrodes
Figure 3
Calculated electric field distribution for the
I.) Plate electrodes
Fig. 3 presents the comparison of electric field distribution of three different configurations of parallel plate elec-trodes for U = 1 V and d = 8.66 mm (U/d = 1.15 V/cm). For an ideal case with infinite parallel plate electrodes (Fig. 3a) we obtained constant electric field in the entire region between the electrodes. In Fig. 3b we can see that for a more realistic geometry, where finite electrodes are con-sidered, the electric field between the electrodes is not constant and is decreased towards the central region. Fur-thermore, if we change the position of electrodes with respect to the target tissue (encircled region), as presented in Fig. 3c, the electric field inside the target tissue is further reduced. Only in the case of the infinite parallel plate elec-trodes, one can use the expression E = U/d, and only in this ideal case E is constant in the entire region between the electrodes (provided that the tissue between the elec-trodes is homogeneous).
II.) Needle electrodes
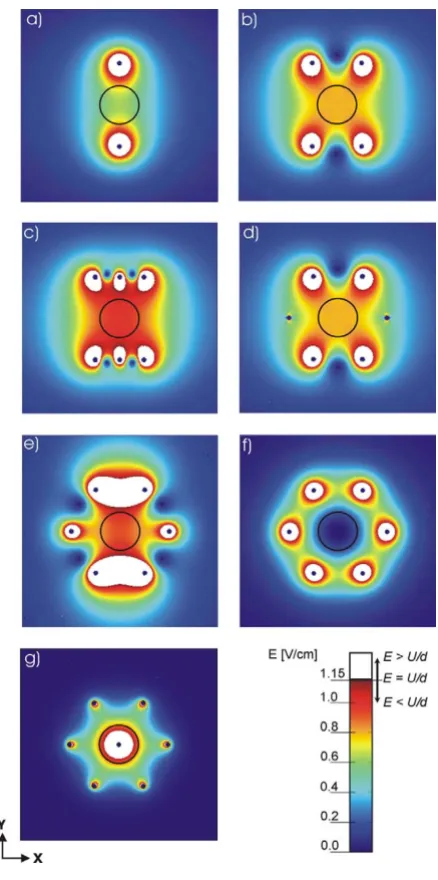
In Fig. 4 numerically calculated electric field distribution for different needle electrode configurations and different polarities are shown. The values of the distances between the needle electrodes d and l are shown in Table 1, and were chosen in a way to correspond to values of Dev et al. [31]. The applied voltage for all configurations was U = 1 V (d = 8.66 mm), except for configurations shown in Fig. 2g and Fig. 2f where U = 0.575 V (d = 5 mm) keeping the ratio U/d constant.
In Fig. 4 it can be clearly seen that the electric field distri-bution in the tissue strongly depends on the number, position and polarities of the electrodes. As expected the highest values of E are obtained in the vicinity of the trodes. With increasing the number of electrodes the elec-tric field strength inside the target tissue becomes higher. It can be seen that by using six or seven electrodes we can achieve a better distribution of E than by using only two or four electrodes. One can also observe that only a smaller part of the tissue is exposed to E ≥ U/d (white region), whereas in the other regions of tissue E is smaller then U/d.
In Figs. 4d and 4e we compare the distribution of E for two different sets of polarities for electrode configuration of six electrodes arranged in the circle as used by Gilbert and co-workers [26]. We obtained higher electric field inside the target tissue with electrode configuration shown in Fig. 4e (3 positive, 3 negative electrodes) com-pared to the electric field inside the target tissue with the electrode configuration shown in Fig. 4d (2 positive, 2 negative electrodes). For both configurations the specific electrodes' positions enables rotation of the electric field direction (by rotating the polarities of the electrodes for a given angle) thus achieving better coverage of the target
Calculated electric field distribution for different needle elec-trode configurations
Figure 4
tissue with needed electric field. Comparing Figs. 4d to 4b we can also see that both electrode configuration results in equal electric field distribution, since the two electrodes with zero potential do not contribute to E distribution.
Figures 4f and 4g represent two examples of seven elec-trodes arranged in a circle with a central electrode having different polarities. We can see that in the first case (Fig. 4f) we obtain high intensity of the electric field in the ring around the electrodes surrounding the central region, whereas in the second case (Fig. 4g) we obtain high inten-sity of the electric field in the central region between the electrodes. Therefore by using combinations of these two different possibilities of setting the polarities of the elec-trodes we can successfully electropermeabilize all the tis-sue between the electrodes. However, by using only the configuration as shown in Fig. 4d the target tissue is not permeabilized.
Electric field distribution between plate and needle electrodes – analytical results
I.) Plate electrodes
Analytical solution for the electric field between two infi-nite parallel plate electrodes (Fig. 1a) gives a trivial solu-tion E = U/d, where E is constant in entire region. In all other cases E between the electrodes is not constant: for finite dimensions of the electrodes (Fig. 1b) or if the target tissue is not set entirely between the plate electrodes as shown in Fig. 1c.
II.) Needle electrodes
Since the derivation using the leading-order solution for a problem with electrodes positioned as shown in Fig. 2b is already given in detail in [31] we present here the final solutions for different geometries as shown in Fig. 2. In all geometries we set the applied voltage U by setting the potential on the electrodes to V0 = ± U/2. Using the equa-tion for the potential Eq.2 (leading order approximaequa-tion)
and applying appropriate boundary condition (potential on the electrodes) we obtained the coefficients Cn, which are given in Appendix section. Taking the real part of Eq. 3 and solutions for Cn (Eqs. A.1-A.6) we obtained
analyti-cal expressions for the electric field strength for different geometries as shown in Fig. 2:
The presented analytical results are extensions of the ana-lytical expression given by Dev et al. [31] for geometries given in Fig. 2 for arbitrary values of d and l, as well as for
different polarities in case of seven electrodes, where is the position of the n-th electrode as shown Fig. 2. Using the analytical expression for the electric field (Eq.5 and Eqs. A.1-A.6) we calculated electric field distribution E for different electrode configurations. These analytical results arevery similar to numerical results of electric field distri-bution shown in Fig. 4.
Comparison of the analytical and the numerical results
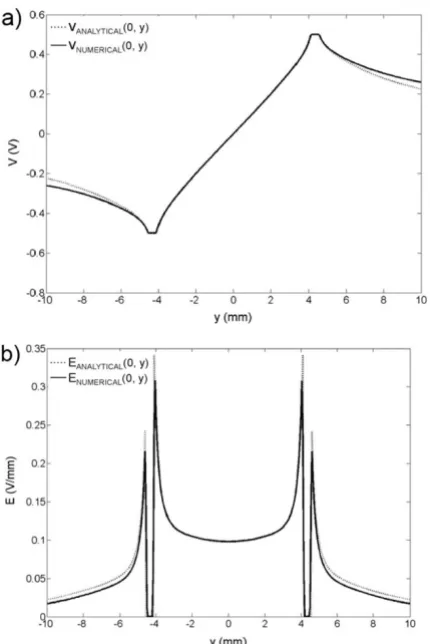
In our study both numerical results as well as analytical results were obtained. The analytical results were vali-dated with the numerical calculations for given electrode configurations. In Fig. 5 we compare the analytical and numerical solutions for the geometry of six electrodes (Fig. 2c) of the electric potential V(x,y) (a) and the electric field distribution E(x,y) (b) along y axis (x = 0). We can see that a good agreement between numerical and analytical solution is obtained in the area between the electrodes, whereas the discrepancy between numerical and analyti-cal solution increases outside the electrodes |y| > 4. The mean and maximal relative difference between numerical and analytical solutions of electric field strength inside the electrode array calculated between the electrodes (over all nodes within the area: |x| < 4 and |y| < 4) were less than 0.7 % and 3.9 %, respectively. Similarly, we obtained a good agreement for both, the potential and the electric field also for other presented geometries (results are not shown).
Since the differences between analytical and numerical results were negligible only numerical results are further analyzed and presented in figures.
Quantification of the local electric field
In order to further quantify and compare local electric field distribution within the tissue for different electrodes
φ( ) log
| | ,
K
K K
r C a
r r C
n
n n
N =
− +
=
∑
1
0 (4)
E r C
r r
n n n
N
( )K = K JKJ .
−
=
∑
1 1(5)
rn
K
Table 1: The distances d and l between the needle electrodes as defined in Fig. 2. Electrodes
configuration
2 Fig. 2a
4 Fig. 2b
6 Fig. 2c
6 Fig. 2d, e
7 Fig. 2f, g
d [mm] 8.66 8.66 8.66 8.66 5
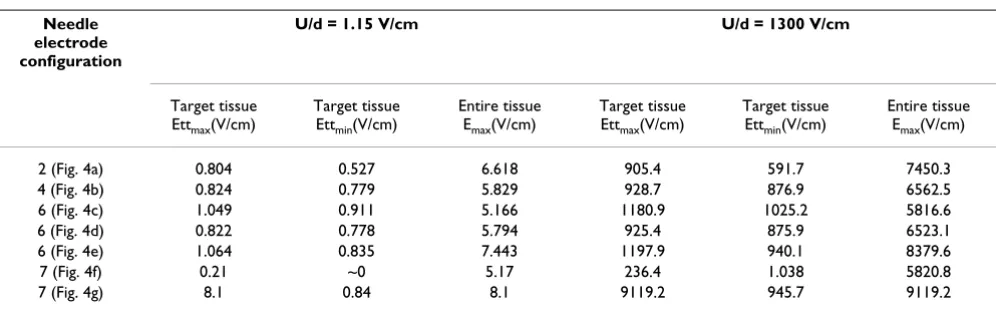
and electrode configurations, as defined in Fig. 1 and Fig. 2, we calculated minimal Ettmin and maximal electric field strengths Ettmax inside the target tissue, as well as the
high-est value of E within entire tissue – Emax. These parameters are important for the optimization of electrochemother-apy and gene electrotransfer, namely Ettmin should be above Erev while Emax should be as low as possible to pre-vent excessive damages of the surrounding tissue. Further-more, we calculated the necessary voltage Uc which has to be applied to the electrodes in order to achieve successful electropermeabilization in the target tissue Ettmin ≥ Erev, where we used Erev = U/d. Here we have to stress that we set the value Erev = U/d in order to compare our results of the local electric field distribution to the previously published studies which used the approximation U/d as an estimate of the local electric field in the treated tissue. The results of quantification of the parameters Ettmin, Ettmax and Emax
for given electrode configurations are listed in Tables 2, 3, 4, 5.
I.) Plate electrodes
From Fig. 1 and Table 2 it can be seen that electric field is homogeneous (Ettmax= Ettmin= Emax= U/d) only for the model with infinite plate electrodes and can be calculated as the ratio E = U/d. As soon as we use more realistic elec-trodes having finite length l (see Fig. 1b), or realistic elec-trodes position with the respect to the treated tissue (see Fig. 1c), the electric field intensity within the tissue between the electrodes is no longer homogeneous. The values of Ettmin and Ettmax inside the target tissue have lower values from U/d whereas the Emax in the near prox-imity of the plate electrodes increases and are higher than ratio U/d (see Table 2). In Table 3 we give the results of necessary voltage Uc in order to obtain the condition Ettmin > U/d, needed for successful target tissue permeabiliza-tion. Based on this we can conclude that in realistic cases (see Figs. 1b and 1c) the value of Uc has to be higher com-pared to the value Uc in the homogeneous model (Fig. 1a) in order to effectively treat the entire target tissue.
II.) Needle electrodes
In Fig. 4 we compare electric field distributions calculated numerically using FEM method for different needle
elec-Table 2: Quantification of electric field strength for plate electrodes models – calculated Ettmin, Ettmax and Emax parameters. 2 plate
electrode configuration
U/d = 1.15 V/cm U/d = 1300 V/cm
Target tissue Ettmax(V/cm)
Target tissue Ettmin(V/cm)
Entire tissue Emax(V/cm)
Target tissue Ettmax(V/cm)
Target tissue Ettmin(V/cm)
Entire tissue Emax(V/cm)
(Fig. 3a) U/d = 1.15 U/d = 1.15 U/d = 1.15 U/d = 1300 U/d = 1300 U/d = 1300 (Fig. 3b) 1.152 1.113 5.515 1297.0 1253.0 6209.0 (Fig. 3c) 1.081 0.691 5.533 1217.0 777.9 6229.2
Calculated minimal E (Ettmin) and maximal E (Ettmax) inside the target tissue and maximal E within the entire tissue Emax for different plate electrode configurations as defined in Fig. 1 are given. The results are given for applied voltage U = 1 V giving U/d = 1.15 V/cm and for applied voltage (scaled results) for U = 1125.83 V giving U/d = 1300 V/cm.
Comparison of the analytical and the numerical solution
Figure 5
trode configurations and polarities. In order to obtain the
parameter U/d = 1.15 V/cm in all models we set the
applied voltage for
elec-trode configurations shown in Figs. 4a–4e and for models shown in Figs. 4f–4g for applied voltage U = 0.575 V (d =
l = 5 mm) giving U/d = 1.15 V/cm.
As shown in Figs. 4d–4g, we obtained that by using several electrodes (six or seven electrodes in the circle) and chang-ing the potential and polarity on the electrodes we can achieve better coverage of target tissue with adequate E. In the case of only two electrodes we can see that the E in the surrounding tissue can be too high and may cause irre-versible damages (Fig. 4a). In the cases of two, four and six electrodes (Figs. 4a–4c) reversing the polarities does not change the electric field distribution. Nevertheless, revers-ing the polarity can improve electropermeabilization on the level of cell membrane since the orientation of the electric field determines which side of the cell will be more permeabilized [23,31,42-44].
In table 4 we compare different configurations of the nee-dle electrodes. If we compare these values to the "electric field intensity" U/d, we can see that both maximal and minimal E deviate significantly from U/d value, which can
be seen also in Fig 4. The low values of Ettmin mean that some parts of the target tissue will not be permeabilized whereas some parts of the 0surrounding tissue might be exposed to too high values causing irreversible damage especially around the electrodes (too high Emax), which is most pronounced for the geometry with two needle elec-trodes. From Table 4 it can be seen that for four and six electrodes Ettmin increases while Emax decreases. We also calculated the needed voltage Uc (Table 5) which has to be applied on the electrodes in order to achieve the condi-tion Ettmin ≥U/d assuming target tissue permeabilization and as it can be seen from Table 5 the needed voltage Uc
differs substantially for different needle electrode configu-rations. Namely, increasing the number of electrodes from two to six we can decrease the applied voltage Uc
from 2467 V to 1427 V.
The effect of tissue inhomogeneities on the electric field distribution
In order to analyze possible effects of tissue inhomogenei-ties we made additional models where target tissue had increased conductivity which is based on the fact that the tumor tissue has in general higher conductivity than its surrounding tissue. Namely, from the literature [19,45] we determined that reasonable approximation for con-ductivity of the target (tumor) tissue is σtt = 0.4 S/m and U=1V( /U d=1V/5 3mm
Table 4: Quantification of electric field strength for needle electrode models – calculated Ettmin, Ettmax and Emax parameters. Needle
electrode configuration
U/d = 1.15 V/cm U/d = 1300 V/cm
Target tissue Ettmax(V/cm)
Target tissue Ettmin(V/cm)
Entire tissue Emax(V/cm)
Target tissue Ettmax(V/cm)
Target tissue Ettmin(V/cm)
Entire tissue Emax(V/cm)
2 (Fig. 4a) 0.804 0.527 6.618 905.4 591.7 7450.3 4 (Fig. 4b) 0.824 0.779 5.829 928.7 876.9 6562.5 6 (Fig. 4c) 1.049 0.911 5.166 1180.9 1025.2 5816.6 6 (Fig. 4d) 0.822 0.778 5.794 925.4 875.9 6523.1 6 (Fig. 4e) 1.064 0.835 7.443 1197.9 940.1 8379.6 7 (Fig. 4f) 0.21 ~0 5.17 236.4 1.038 5820.8 7 (Fig. 4g) 8.1 0.84 8.1 9119.2 945.7 9119.2
The results for models shown in Figs. 4a – 4e were calculated for applied voltage U = 1 V ( ) and for models shown in Figs. 4f – 4g for applied voltage U = 0.575 V (d = l = 5 mm) giving U/d = 1.15 V/cm. Furthermore, by scaling the results we also calculated the parameters Ettmin, Ettmax and Emax for U/d = 1300 V/cm.
d=5 3 mm
Table 3: Calculated values of Uc and corresponding Ettmin, Ettmax and Emax for plate electrodes. 2 plate electrode
configuration
Target tissue Ettmax(V/cm)
Target tissue Ettmin(V/cm)
Entire tissue Emax(V/cm)
Needed voltage on the electrodes-Uc (V)
(Fig. 3a) U/d = 1300 U/d = 1300 U/d = 1300 U = 1125.83 (Fig. 3b) 1345.8 U/d = 1300 6441.5 1168
(Fig. 3c) 2001 U/d = 1300 10242 1851
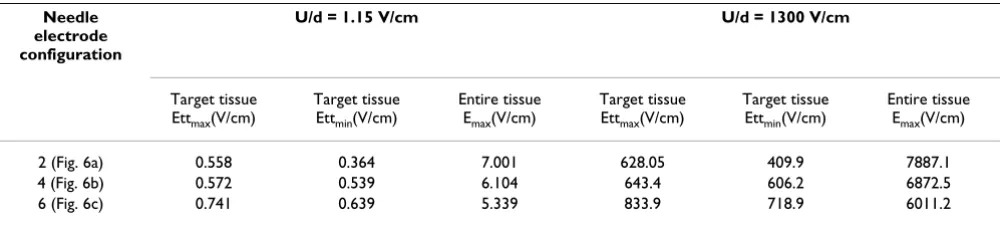
conductivity of the surrounding tissue σst = 0.2 S/m. In Fig. 6 we compare electric field distributions calculated numerically using FEM method for two, four needle elec-trodes and six needle elecelec-trodes taking into account higher conductivity of the target tissue compared to the surrounding tissue.
Comparing the results of the inhomogeneous models shown in Fig. 6 to the electric field distribution in homo-geneous models (Figs. 4a–4c) we obtained that in the inhomogeneous model the electric field strength inside the target tissue is lower, while the larger portion of the surrounding tissue is exposed to the value exceeding U/d. However, similarly as in homogenous model we again obtained that with larger number of electrodes better cov-erage of the target tissue with adequate E is obtained, namely for larger number of electrodes Ettmin increases while Emax decreases (see Table 6). We also obtained that similarly as for homogeneous models the local electric field is significantly different from the value U/d, e.g. for the selected parameters the minimum electric field strength inside the target tissue can deviate from the U/d
by more than factor 3, see the Table 6.
In Table 7 we give the results of the necessary voltage Uc in order to meet the condition Ettmin> U/d for inhomogene-ous models where σtt is higher then σst. Our results show that Uc for given inhomogeneous model (σtt = 2 × σst) has to be higher compared to Uc in the homogeneous models in order to effectively treat the entire target tissue.
Discussion
In this study we numerically and analytically determined and compared the local electric field distribution in 2D for different electrode configurations which are used for in vivo electrochemotherapy and gene electrotransfer. We quantify and compare the local electric field by means of three parameters: the maximal in minimal local electric fields inside the treated tissue – Ettmin, Ettmax and maximal
E over the entire treated tissue – Emax. Namely, the criteria for adequate or »optimal« local E distribution are the fol-lowing: i) all the target tissue has to be exposed to the E
above the threshold value for reversible electroporation (Ettmin> Erev); ii) the maximal E inside the target tissue Ettmax
has to be below the threshold value for irreversible electro-poration (Ettmax< Eirrev), which is specially important in gene electrotransfer and iii) the surrounding tissue should not be exposed to excessively high electric field, therefore the
maxi-Calculated electric field distribution for in-homogeneous models
Figure 6
Calculated electric field distribution for in-homoge-neous models. Numerical results of the electric field distri-bution for needle electrode configurations defined in Figs. 2a-2c: a) two needle electrodes, b) four needle electrodes, c) six needle electrodes in two rows taking into account two-times higher conductivity of the target tissue compared to sur-rounding tissue (conductivity of the target tissue is σtt = 0.4 S/m and conductivity of the surrounding tissue σst = 0.2 S/ m). In all cases the applied voltage was set in such a way that
U/d = 1.15 V/cm.
Table 5: Calculated values of Uc and corresponding Ettmin, Ettmax and Emax for needle electrodes. Needle electrode
Configuration
Target tissue Ettmax(V/cm)
Target tissue Ettmin(V/cm)
Entire tissue Emax(V/cm)
Needed voltage on the electrodes-Uc (V)
2 (Fig. 4a) 1983.3 U/d = 1300 16325.0 2466.8 4 (Fig. 4b) 1376.8 U/d = 1300 9727.4 1668.8 6 (Fig. 4c) 1496.9 U/d = 1300 7371.9 1427.0 6 (Fig. 4d) 1373.2 U/d = 1300 9625 1670.0 6 (Fig. 4f) 1653.7 U/d = 1300 11558.7 1557.0
7 (Fig. 4f) * / / / /
7 (Fig. 4g) 12536 U/d = 1300 12536 889.88
mal electric field in entire tissue Emax should be as low as pos-sible, while meeting the first condition Ettmin >Erev.
We further calculated the needed voltage Uc (Table 5) which has to be applied on the electrodes in order to sub-ject the entire target tissue to the sufficiently high local electric field (Ettmin ≥U/d), where the value U/d was used in order to compare this parameter to the actual magni-tude of E inside the treated tissue.
We showed that the electric field distribution in the tissue strongly depends on the number and position of the elec-trodes, as well as of the electric field orientation, as dem-onstrated in Fig. 4. As expected the highest values of E are obtained in the vicinity of the electrodes where E can exceed the irreversible threshold value Eirrev leading to the damage of the tissue. With increasing the number of elec-trodes the electric field strength inside the target tissue becomes higher for the same voltage applied, e.g. from the Table 4 it can be seen that Ettmin increases and Emax
decreases for higher number of electrodes. Considering that Ettmin should be above Erev, while keeping Emax as low as possible it can be seen (Table 4) that the six electrode configurations have the best ratio between Ettmin and Emax. Configurations with seven electrodes are reasonable only when combining the two polarities settings (Figs. 4f and
4f) on the electrodes in order to electropermeabilize the larger area of treated tissue.
We also demonstrate that if parameter U/d is used to select the applied voltage only smaller part of the tissue is exposed to E ≥U/d (white region in Fig. 4), whereas in the other regions of tissue E is too small. We obtained that the ratio between minimal E inside the target tissue (Ettmin) and the value U/d can deviate for more than a factor of 2 (see Table 4). The higher local electric field can be achieved by increasing the applied voltage, therefore we further calculate the needed voltage Uc to fulfill the condi-tion Ettmin> U/d over the entire target tissue. We showed that the needed applied voltage Uc differs substantially for different needle electrode configurations (Table 5). Thus, the electric field distribution strongly depends on geome-try and position of electrodes with respect to the target tis-sue therefore the needed voltage (Uc) requires its own calculation for each individual configuration. From Table 5 it can be seen that the Uc for two needle electrodes has to be about 2400 V compared to other configurations where Uc is in the range from 1400 V to 1700 V.
Another possibility to achieve better coverage of the target tissue with the adequate E with the same applied voltage is changing the electric field orientation as already experi-mentally and numerically demonstrated with two 90°
Table 7: Calculated values of Uc and corresponding Ettmin, Ettmax and Emax for in-homogeneous models (Figs. 6a-6c). Needle electrode
configuration
Target tissue Ettmax(V/cm)
Target tissue Ettmin(V/cm)
Entire tissue Emax(V/cm)
Needed voltage on the electrodes-Uc (V)
2 (Fig. 6a) 1991.87 U/d = 1300 25014.0 3570.6 4 (Fig. 6b) 1379.80 U/d = 1300 14738.4 2414.4 6 (Fig. 6c) 1508.0 U/d = 1300 10870.4 2035.9
Specific conductivity of the target tissue is σtt = 0.4 S/m and specific conductivity of the surrounding tissue σst = 0.2 S/m.
Table 6: Quantification of the electric field strength for in-homogeneousmodels – calculated Ettmin, Ettmax and Emax parameters. Needle
electrode configuration
U/d = 1.15 V/cm U/d = 1300 V/cm
Target tissue Ettmax(V/cm)
Target tissue Ettmin(V/cm)
Entire tissue Emax(V/cm)
Target tissue Ettmax(V/cm)
Target tissue Ettmin(V/cm)
Entire tissue Emax(V/cm)
2 (Fig. 6a) 0.558 0.364 7.001 628.05 409.9 7887.1 4 (Fig. 6b) 0.572 0.539 6.104 643.4 606.2 6872.5 6 (Fig. 6c) 0.741 0.639 5.339 833.9 718.9 6011.2
Quantification of the electric field strength (E) for in-homogeneous models with needle electrode configurations which are defined in Fig. 2a-c. Conductivity of the target tissue is σtt = 0.4 S/m and the conductivity of the surrounding tissue σst = 0.2 S/m. Calculated minimal E (Ettmin) and maximal E (Ettmax) inside the target tissue and maximal E within the entire tissue Emax for different needle electrode configurations. The results for
models shown in Figs. 6a-6c were calculated for applied voltage U = 1 V ( ). Furthermore, by scaling the results we also calculated the parameters Ettmin, Ettmax and Emax for U/d = 1300 V/cm.
rotations of E using plate electrodes in [23] and experi-mentally in [26] with a sequence of 60° rotations of E
using needle electrode configurations, as shown in Figs. 2d and 2e.
Moreover, changing the electric field orientation during the electric pulse delivery is also important for gene elec-trotransfer as it improves the efficiency of gene electro-transfer indirectly by also increasing the membrane area available for the transfer of plasmid DNA [46].
We used 2D numerical and analytical models in order to compare E for different electrode configurations in the central plane of a more general 3D model. The presented 2D results are good approximation of local electric field distribution in 3D models for needle electrodes since elec-trodes are usually long and deeply inserted in tissue.
The presented analytical solutions in 2D for the electric field around needle electrodes are extensions of the ana-lytical expressions given by Dev et al. [31] for geometries given in Fig. 2 for arbitrary values of d and l, as well as for different polarities in case of six and seven electrodes. By comparing numerical and analytical calculations for given needle electrode configurations we obtained good agree-ment between the two methods. Thus we showed that the leading-order analytical approximation accurately describes the electric field distribution in the region between the needle electrodes. The presented analytical solutions can be used as a rapid pre-analysis of the electric field distribution for different needle electrode configura-tions.
Our models are approximation of more complex and in general time-dependent models where one has to take into account also the increase of the effective conductivity of the permeabilized region [18,19,47-51]. In our present study we assumed that tissue has a constant value of con-ductivity which represents the final stage of electroperme-abilization. In most of the models we assumed homogeneous properties of the treated tissue which neglects the differences of the conductivities for different tissues. For plate electrodes, which are usually placed on the skin, this approximation is not adequate since the conductivity of the skin is few orders of magnitude lower [19]. However, for needle electrodes homogeneous mod-els can be used to compare different configurations, since the treated tissues have roughly similar conductivities [45] and we can use the average conductivity.
In order to analyze possible effects of tissue inhomogenei-ties we made additional numerical models where target tissue had increased conductivity. The main conclusions of our study are independent of the electrical properties of tissues either homogenous or inhomogeneous. We
obtained that similarly as for homogeneous models elec-tric field distribution significantly depends on the
config-uration and that the deviation of the value U/d
approximation from local E inside the target tissue can be even more pronounced. Furthermore, also for inhomoge-neous models six electrodes result in better local electric field distribution in terms of achieving high Ettmin and rel-atively low Emax compared to two or four needle electrodes models (Table 6).
Conclusion
The main objective of this paper was to provide the solu-tions of local electric field distribution and to visualize the local electric field inside the target tissue for most com-monly used electrode configurations in electrochemo-therapy and gene electrotransfer. In presented study we numerically and analytically quantify and compare elec-tric field distribution in 2D for different electrode config-urations which are used for in vivo electrochemotherapy and gene electrotransfer for the same value of parameter
U/d. We demonstrate that the calculated local electric field inside the target tissue strongly depends on the chosen electrodes and electrode configuration and can be signifi-cantly different from a gross approximation U/d as usually used as an estimate of the local electric field in a number of different reports [8-10,12,15,32-36].
We show that electric field distribution strongly depends on geometry, position and polarity of the electrodes with respect to target tissue and that it requires its own calcula-tion for each individual configuracalcula-tion, which is in agree-ment with previous reports [12,15,17,25,26,32,34,40,41, 52]. We present visualization of the electric field distribu-tion and quantificadistribu-tion of the maximal and minimal val-ues of E inside the target tissue for frequently used electrode configurations. We also calculate the needed voltage for a specific configuration to meet the criterion that the local electric field over the entire target tissue exceeds the threshold value.
configurations Fig. 4f and Fig. 4g) we electropermeabilize larger area with the same electrode configurations.
In addition we showed that for needle electrode configu-ration we can use the analytical solution as a rapid and simple method for visualizing electric field distribution inside the tissue without using special software for numer-ical modeling. But in case of more complex geometries and inhomogeneities of the tissue, numerical modeling is required to determine optimal parameters in order to achieve efficient tissue permeabilization [15-17,25,49,50, 52].
To conclude, our numerical models and analytical calcu-lations provide an estimate of actual local E inside the tar-get tissue and can be used for comparison of different electrode configurations. They also enable more precise choice of applied voltage compared to using U/d approxi-mation. Since optimal geometry, arrangement and posi-tion of the electrodes strongly depend on the posiposi-tion and geometry of the target tissue it is of crucial importance to design a system of electrodes, which could be easily adjustable according to each individual case and to develop software for numerical calculation which would enable optimization of parameters in order to render elec-trochemotherapy and gene electrotransfer as efficient as possible. An important step towards the optimization of local electric field for effective ECT has been made recently by IGEA company [53] currently providing the electropo-rator designed specifically to be used in the clinical prac-tice for electrochemotherapy. They provide the voltage for different distances between electrodes taking into account also the differences in local electric field distribution for different electrode configurations. In order to improve the efficiency of the treatments training sessions should be also involved. The training sessions should also provide educational material about the knowledge and experi-ences that have already been acquired with electrochemo-therapy and gene electrotransfer. This can be brought about by the web technology, as an easy and important way to collect and organize the information obtained from different clinical and research centers [54-56].
Appendix
In this section we present solutions of the Laplace equa-tion for the coefficients Cn from Eq. 4 for different needle electrode configurations. We obtained the following result for two needle electrodes (Fig. 2a):
for four electrodes (Fig. 2b):
for six electrodes (arranged in two parallel rows of three electrodes in each), as shown in Fig. 2c:
for six electrodes arranged in circle (Fig. 2e):
for seven electrodes, as shown in Fig. 2f (six electrodes arranged in circle with additional placed in the center of this circle):
In all configurations 2a–2f is the number of positive and negative electrodes equal, so we can set C0 = 0.
For seven electrodes as shown in Fig. 2g we have one pos-itive and six negative electrodes, so C0 is not zero. To sat-isfy conservation of the current we have additional condition C7 = -6C1..6, and thus we obtain:
Competing interests
The author(s) declare that they have no competing inter-ests.
Authors' contributions
All authors contributed equally to this work
All authors read and approved the final manuscript.
C C V
d a
1= − 2= 0
(
)
log / , (A.1)
C C C C V
d l
l d a
1 2 3 4 0
2 2 = = − = − = + log , (A.2)
C C C C V d a d l l
d a d d l
1 3 4 6 0
2 2
2 42 2
= = − = − = − +
+
log( / ) log( / )
log( / )log( / aal d l l
C C V C d l l
d a
) log( / )
,
log( / ) log( / ) ,
−
(
+)
= − = − +
2
2
2 2 2
2 5 0 1
2 2
(A.3)
C C C C V a d
C C C V
1 5 2 4 0
3 6 1 0
2 3 2
2 3
= = − = − = +
− = = −
log( ) log( / ) ,
log( )
loog( /a 2d) ,
(A.4)
C C V
d a C
1 3 5 2 4 6 0 7
2 3 0
, , , ,
log / , .
= − =
(
)
= (A.5)C V
a d a d
C C C V C
1 6 5 5 0 7 1 6 0 0 1 6
2
6 6 12
6 6
.. .. ..
log / log /
, , l
= −
(
)
− ( ) = − = − oog(a d/ ).Acknowledgements
This research was supported by the Ministry of High Education, Science and Technology of the Republic of Slovenia under the grant P2-0249, and under the grants ESOPE QLK3-2002-02003 QLK within the 5th framework pro-gram and ANGIOSKIN LSHB-CT-2005-512127 within the 6th framework program funded by the European Commission.
References
1. Zimermann U: Electric field-mediated fusion and related elec-trical phenomena. Biochim Biophys Acta 1982, 694:227-277. 2. Neumann E, Sowers AE, Jordan CA: Electroporation and
Electro-fusion in Cell Biology. New York: Plenum Press; 1989. 3. Tsong TY: Electroporation of cell membranes. Biophys J 1991,
60:297-306.
4. Weaver JC, Chizmadzhev YA: Theory of electroporation: A review. Bioelectrochem Bioenerg 1996, 41:135-60.
5. Mir LM: Therapeutic perspectives of in vivo cell electroper-meabilization. Bioelectrochemistry 2001, 53(1):1-10.
6. Okino M, Mohri H: Effects of a high-voltage electrical impulse and an anticancer drug on in vivo growing tumors. Jpn J Cancer Res 1987, 78:1319-1321.
7. Mir LM, Glass LF, Serša G, Tessie J, Domenge C, Miklavčič D, Jarosz-eski MJ, Orlowski S, Reintgen DS, Rudolf Z, Belehradek M, Gilbert R, Rols MP, Belehradek JJr, Bachaud JM, DeConti R, Štabuc B, Жemažar M, Coninx P, Heller R: Effective treatment of cutaneous and subcutaneous malignant tumors by electrochemotherapy.
Br J Cancer 1998, 77:2336-2342.
8. Barry BW: Novel Mechanisms and devices to enable success-ful transdermal drug delivery. Eur J Pharm Sci 2001, 14:101-114. 9. Denet AR, Vanbever R, Préat V: Skin electroporation for transdermal and topical delivery. Adv Drug Deliv Rev 2004, 56(5):659-674.
10. Mossop BJ, Barr RC, Henshaw JW, Zaharoff DA, Yuan F: Electric fields in tumors exposed to external voltage sources: Impli-cation for electric field-mediated drug and gene delivery.
Annals of biomedical engineering 2006, 34:1564-1572.
11. Nishi T, Yoshizato K, Yamashiro S, Takeshima H, Sato K, Hamada K, Kitamura I, Yoshimura T, Saya H, Kuratsu J, Ushio Y: High-effi-ciency in vivo gene transfer using intraarterial plasmid DNA injection following in vivo electroporation. Cancer Res 1996, 56:1050-1055.
12. Jaroszeski MJ, Heller R, Gilbert R: Electrochemotherapy, elec-trogene therapy and transdermal drug delivery: electrically mediated delivery of molecules to cells. Totowa, New Jersey: Humana Press; 1999.
13. Neumann E, Schaefer-Ridder M, Wang Y, Hofschneider PH: Gene transfer into mause lyoma cells by electroporation in high electric fields. EMBO J 1982, 1:841-845.
14. Prud'homme GJ, Glinka Y, Khan AS, Draghia-Akli R: Electropora-tion-enhanced nonviral gene transfer for the prevention or treatment of immunological, endocrine and neoplastic dis-eases. Current Gene Therapy 2006, 6:243-273.
15. Gehl J, Sorensen TH, Nielsen K, Reskmark P, Nielsen SL, Skovsgaard T, Mir LM: In vivo electroporation of skeletal muscle: thresh-old, efficacy and relation to electric field distribution. Biochim Biophys Acta 1999, 1428:233-240.
16. Šemrov D, Miklavčič D: Numerical Modelling for In Vivo Elec-troporation. Meth Mol Med 2000, 37:63-81.
17. Miklavcic D, Semrov D, Mekid H, Mir LM: A validated model of in vivo electric field distribution in tissues for electrochemo-therapy and for DNA electrotransfer for gene electrochemo-therapy. Bio-chim Biophys Acta 2000, 1523(1):73-83.
18. Šel D, Cukjati D, Batiuskaite D, Slivnik T, Mir LM, Miklavčič D: Sequential finite element model of tissue electropermeabili-zation. IEEE Trans Biomed Eng 2005, 52:816-827.
19. Pavšelj N, Bregar Z, Cukjati D, Batiuskaite D, Mir LM, Miklavčič D: The course of tissue permeabilization studied on a mathe-matical model of a subcutaneous tumor in small animals.
IEEE Trans Biomed Eng 2005, 52:1373-1381.
20. Vernhes MC, Benichou A, Pernin P, Cabanes PA, Teissié J: Elimina-tion of free-living amoebae in fresh water with pulsed elec-tric fields. Water Res 2002, 36:3429-3438.
21. Yeom HW, Streaker CB, Zhang QH, Min DB: Effects of pulsed electric fields on the quality of orange juice and comparison
with heat pasteurization. J Agric Food Chem 2000, 48(10):4597-4605.
22. Davalos RV, Mir LM, Rubinsky B: Tissue ablation with irreversi-ble electroporation. Ann Biomed Eng 2005, 33:223-231. 23. Serša G, Жemažar M, Šemrov D, Miklavčič D: Changing electrode
orientation improves the efficacy of electrochemotherapy of solid tumors in mice. Bioelectrochem Bioenerg 1996, 39:61-66. 24. Miklavcic D, Semrov D, Mekid H, Mir LM: A validated model of in
vivo electric field distribution in tissues for electrochemo-therapy and for DNA electrotransfer for gene electrochemo-therapy. Bio-chim Biophys Acta 2000, 1523(1):73-83.
25. Miklavčič D, Beravs K, Šemrov D, Жemažar M, Demšar F, Serša G: The importance of electric field distribution for effective in vivo electroporation of tissues. Biophys J 1998, 74:2152-2158. 26. Gilbert RA, Jaroszeski MJ, Heller R: Novel electrode designs for
electrochemotherapy. Biochim Biophys Acta 1997, 1334(1):9-14. 27. Sel D, Lebar AM, Miklavcic D: Feasibility of employing
model-based optimization of pulse amplitude and electrode dis-tance for effective tumor electropermeabilization. IEEE Trans Biomed Eng 2007, 54:773-781.
28. Miklavčič D: Electrodes and corresponding electric field distri-bution for effective in vivo electroporation. Proceedings of MEDICON-Mediterranean conference on medical engineering and comput-ing, Pula, Croatia 2001:5-9.
29. Schwan HP, Kay CF: The conductivity of living tissues. Ann NY Acad Sci 1957, 65:1007.
30. Polk C, Postow E: Dielectric Properties of Tissues. In Handbook of Biological Effects of Electromagnetics Fields 2nd edition. Edited by: Polk C, Postow E. Florida: CRC Press; 2000:28-92.
31. Dev BS, Dhar D, Krassowska W: Electric field of a six-needle array electrode used in drug and DNA delivery in vivo: ana-lytical versus numerical solution. IEEE Trans Biomed Eng 2003, 50(11):1296-1300.
32. Heller R, Jaroszeski M, Atkin A, Moradpour D, Gilbert R, Wands J, Nicolau C: In vivo gene electroinjection and expression in rat liver. FEBS Letters 1996, 389:225-228.
33. Puc M, Reberšek S, Miklavčič D: Requirements for a clinical elec-trochemotherapy device-electroporator. Radiol Oncol 1997, 31:368-373.
34. Serša G, Жemažar M, Rudolf Z: Electrochemotherapy. "Advan-tages and drawbacks in treatment of cancer patients. Cancer Therapy 2003, 1:133-142.
35. Leroy-Willing A, Bureau MF, Scherman D, Carlier PG: In vivo imag-ing evaluation of efficiency and toxity of gene electrotrensfer in rat muscle. Gene Ther 2005, 12:1434-1443.
36. Jaichandran S, Yap STB, Khoo ABM, Ho LP, Tien SL, Kon OL: In Vivo Liver Electroporation: Optimization and Demonstration of Therapeutic Efficacy. Hum Gene Ther 2006, 17:362-375. 37. Marty M, Serša G, J GarbayR, Gehl J, Collins CG, Snoj M, Billard V,
Geertsen PF, Larkin JO, Miklavčič D, Pavlović I, Paulin-Košir SM,
Жemažar M, Morsli N, Soden DM, Rudolf Z, Robert C, O'Sullivan GC, Mir LM: Electrochemotherapy – An easy, highly effective and safe treatment of cutaneous and subcutaneous metastases: Results of ESOPE (European Standard Operating Proce-dures of Electrochemotherapy) study. Eur J Cancer Suppl 2006, 4:3-13.
38. Fagan MJ: Finite element analysis-Theory and practice Long-man Scientific Technical. Harlow: Longman Scientific and Tech-nical; 1992.
39. Puc M, Жorović S, Flisar K, Petkovsek M, Nastran J, Miklavčič D: Techniques of signal generation required for electroperme-abilization. Survey of electropermeabilization devices. Bioe-lectrochemistry 2004, 64:113-124.
40. Trezise AE: In vivo DNA Electrotransfer. DNA Cell Biol 2002, 21(12):869-877.
41. Šemrov D, Miklavčič D: Numerical modeling for in vivo electro-poration. Meth Mol Med 2000, 37:63-81.
42. Tekle E, Astumian RD, Chock PB: Electro-permeabilization of cell membranes: effect of the resting membrane potential.
Biochem Biophys Res Commun 1990, 172(1):282-287.
Publish with BioMed Central and every scientist can read your work free of charge "BioMed Central will be the most significant development for disseminating the results of biomedical researc h in our lifetime."
Sir Paul Nurse, Cancer Research UK
Your research papers will be:
available free of charge to the entire biomedical community peer reviewed and published immediately upon acceptance cited in PubMed and archived on PubMed Central yours — you keep the copyright
Submit your manuscript here:
http://www.biomedcentral.com/info/publishing_adv.asp
BioMedcentral
44. Valic B, Pavlin M, Miklavcic D: The effect of resting transmem-brane voltage on cell electropermeabilization: a numerical analysis. Bioelectrochemistry 2004, 63(1-2):311-315.
45. Miklavčič D, Pavšelj N, Hart FX: Electric Properties of Tissues. In
Wiley Encyclopedia of Biomedical Engineering John Wiley & Sons, New York; 2006.
46. Reberšek M, Faurie C, Kandušer M, Жorović S, Teissié J, Rols MP, Mik-lavčič D: Electroporator with automatic change of electric field direction improves gene electrotransfer in vitro. Biomed Eng Online 2007, 6:25.
47. Pavlin M, M Kandušer, Reberšek M, Pucihar G, Hart FX, Magjarević R, Miklavčič D: Effect of cell electroporation on the conductivity of a cell suspension. Biophys J 2005, 88:4378-4390.
48. Pavlin M, Leben V, Miklavčič D: Electroporation in dense cell sus-pension – Theoretical and experimental analysis of ion diffu-sion and cell permeabilization. Biochim Biophys Acta 2007, 1770:12-23.
49. Davalos RV, Huang Y, Rubinsky B: Electroporation: bio-electro-chemical mass transfer at the nano scale. Microscale Thermo-phys Eng 2000, 4:147-159.
50. Davalos RV, Rubinsky B, Otten DM: A feasibility study for electri-cal impedance tomography as a means to monitor tissue electroporation for molecular medicine. IEEE Trans Biomed Eng
2002, 49(4):400-403.
51. Davalos RV, Otten DM, Mir LM, Rubinsky B: Electrical impedance tomography for imaging tissue electroporation. IEEE Trans Biomed Eng 2004, 51(5):761-767.
52. Šel D, Mazeres S, Teissie J, Miklavčič D: Finite-element modeling of needle electrodes in tissue from the perspective of fre-quent model computation. IEEE Trans Biomed Eng 2003, 50:1221-1232.
53. IGEA S.r.l [http://www.igea.it]
54. Pavlović I, Kramar P, Жorović S, Cukjati D, Miklavčič D: A web-appli-cation that extends functionality of medical device for tumor treatment by means of electrochemotherapy. Radiol Oncol
2004, 38:49-54.
55. Pavlović I, Miklavcic D: Web-based electronic data collection system to support electrochemotherapy clinical trial. IEEE Trans Inf Technol Biomed 2007, 11(2):222-230.
56. Humar I, Sinigoj A, Bešter J, Hegler MO: Integrated component web-based interactive learning systems for engeneering.