RESEARCH
Generation of an
E. coli
platform strain
for improved sucrose utilization using adaptive
laboratory evolution
Elsayed T. Mohamed
1, Hemanshu Mundhada
1, Jenny Landberg
1, Isaac Cann
2, Roderick I. Mackie
2,
Alex Toftgaard Nielsen
1, Markus J. Herrgård
1and Adam M. Feist
1,3*Abstract
Background: Sucrose is an attractive industrial carbon source due to its abundance and the fact that it can be cheaply generated from sources such as sugarcane. However, only a few characterized Escherichia coli strains are able to metabolize sucrose, and those that can are typically slow growing or pathogenic strains.
Methods: To generate a platform strain capable of efficiently utilizing sucrose with a high growth rate, adaptive labo-ratory evolution (ALE) was utilized to evolve engineered E. coli K-12 MG1655 strains containing the sucrose utilizing csc genes (cscB, cscK, cscA) alongside the native sucrose consuming E. coli W.
Results: Evolved K-12 clones displayed an increase in growth and sucrose uptake rates of 1.72- and 1.40-fold on sugarcane juice as compared to the original engineered strains, respectively, while E. coli W clones showed a 1.4-fold increase in sucrose uptake rate without a significant increase in growth rate. Whole genome sequencing of evolved clones and populations revealed that two genetic regions were frequently mutated in the K-12 strains; the global transcription regulatory genes rpoB and rpoC, and the metabolic region related to a pyrimidine biosynthetic defi-ciency in K-12 attributed to pyrE expression. These two mutated regions have been characterized to confer a similar benefit when glucose is the main carbon source, and reverse engineering revealed the same causal advantages on M9 sucrose. Additionally, the most prevalent mutation found in the evolved E. coli W lineages was the inactivation of the cscR gene, the transcriptional repression of sucrose uptake genes.
Conclusion: The generated K-12 and W platform strains, and the specific sets of mutations that enable their pheno-types, are available as valuable tools for sucrose-based industrial bioproduction in the facile E. coli chassis.
Keywords: Escherichia coli, Renewable feedstocks, Sucrose, Adaptive laboratory evolution, Platform strains
© The Author(s) 2019. This article is distributed under the terms of the Creative Commons Attribution 4.0 International License (http://creat iveco mmons .org/licen ses/by/4.0/), which permits unrestricted use, distribution, and reproduction in any medium, provided you give appropriate credit to the original author(s) and the source, provide a link to the Creative Commons license, and indicate if changes were made. The Creative Commons Public Domain Dedication waiver (http://creat iveco mmons .org/ publi cdoma in/zero/1.0/) applies to the data made available in this article, unless otherwise stated.
Introduction
There is a significant interest in the utilization of renew-able carbon feedstocks for bioprocesses due to both environmental and economic factors. Sucrose from sugarcane can serve as a renewable carbon source as it originates from a cheap abundant feedstock source which can lower carbon source costs [1, 2], and it can be readily utilized by biological systems in fermentation processes
either from the raw source as sugarcane juice [3] or from the refined byproduct of the sugar industry as molasses [4, 5].
The ability of Escherichia coli, an industrial biotech-nology workhorse [6–8], to utilize sucrose as a sole car-bon source depends on the specific E. coli strain used [9]. E. coli W is the only well-known E. coli strain gen-erally regarded as safe that can utilize sucrose as a car-bon source and can grow robustly on it when compared
to other carbon sources, such as glucose [10]. The
genetic basis and molecular control of sucrose metabo-lism in E. coli W (as well as E. coli EC3132) have been characterized [11, 12] and this knowledge is the basis
Open Access
*Correspondence: [email protected]
3 Department of Bioengineering, University of California, 9500 Gilman
Drive La Jolla, San Diego, CA 92093, USA
for constructing sucrose utilizing E. coli strains for the current study. Engineering non-native sucrose utiliza-tion into addiutiliza-tional E. coli strains has been investigated, but in all cases, the generated strains were character-ized by slow growth rates on sucrose as compared to glucose. Such low growth rates would limit productiv-ity in industrial processes, a key component for a viable bioprocess [13, 14]. Most of the previous approaches to engineer E. coli to use sucrose as a carbon source were hampered by slow growth rates and phenotypic instability due to unstable plasmid systems that may require antibiotic addition for stability [15] or due to a high burden exerted on the cell by high copy num-ber plasmids [11, 16–18]. For example, the K-12 strains generated by Tsunekawa et al. using chromosomal inte-gration grew with very slow rates on sucrose and ran-dom mutagenesis was required to improve the growth
rate modestly [19]. Another approach examined was to
chromosomally integrate sucrose utilization genes from E. coli W into an E. coli K-12 strain [20]. The K-12 strain generated was able to grow on sucrose, but the growth rate was 30% lower than that on glucose. Thus, there is still a need to efficiently engineer sucrose metabolism in multiple E. coli strains, each of which have their own strain-specific advantages for host selection for viable bioprocesses [6]. Such host selection factors to consider include product tolerance, phage resistance, the native metabolic flux distribution either towards a native or heterologous production pathway, transformation
efficiency, convenience to perform metabolic changes, and ease to scale-up [21].
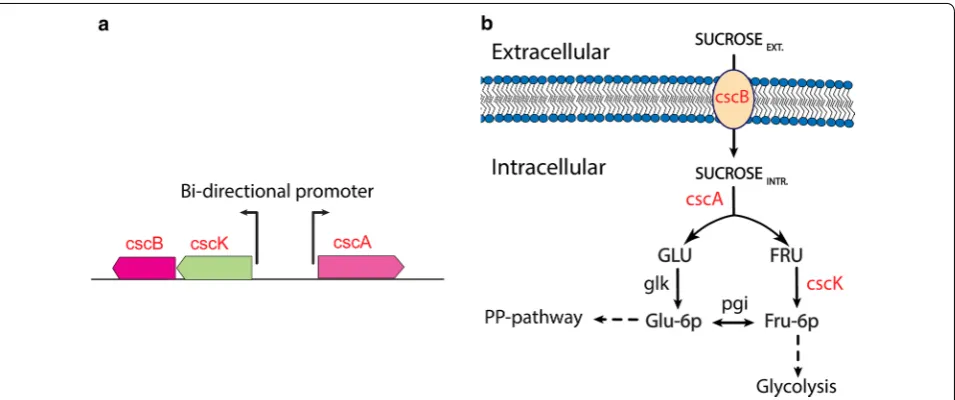
In order to demonstrate the ability to generate addi-tional E. coli strains that can efficiently consume sucrose, genetic constructs were designed based on the chromo-somally encoded sucrose catabolism operon, csc, from E. coli W and then subjected to adaptive laboratory evolu-tion (ALE). The csc gene cluster containing the cscB gene that encodes sucrose permease, cscK that encodes a
fruc-tokinases, and cscA that encodes sucrose-6-phosphate
hydrolase (invertase), was integrated into the E. coli K-12 MG1655 chromosome [11] (Fig. 1). The cscR gene that encodes for a csc-specific repressor and negatively controls the expression of the csc regulon was not inte-grated to allow constitutive expression. The engineered strain was then optimized using ALE to generate multi-ple evolved E. coli strains able to metabolize sucrose with fast growth comparable to that on glucose. Additionally, the approach to analyze multiple independent popula-tions and multiple independent isolates from each pop-ulation made it possible to effectively reveal key causal mutations by comparing the independent lineages and focusing on instances of parallel evolution. This approach also likely identified a broader landscape of mutations (e.g., multiple alleles of the same gene) as compared to sequencing a single lineage and reverse engineering all of the mutations to find causality. The ALE approach used in the current work used an automated platform with several parallel replicates as previously described [22, 23].
Overall, cells were repeatedly grown in a batch aerobic cultivation mode with passage in the exponential phase, which applies selection pressure for rapid growth rate. At the end of the evolution, populations and clones from the ALE derived endpoints were characterized in terms of their genome sequence, growth rate, carbon uptake rate, and growth yield. Furthermore, the evolved strains were characterized on sugarcane juice as a substrate dem-onstrating their ability to use this renewable feedstock efficiently.
Methods and materials
Media and reagents M9 minimal medium
M9 sucrose medium contained 20 g/L sucrose unless stated otherwise, 1× M9 salts, 2 mM MgSO4, 100 μM
CaCl2 and 1× trace elements and Wolfe’s vitamin
solution. M9 salts, trace elements and vitamins were prepared in concentrated stocks. Stock M9 salts solu-tion consisted of 10 × 68 g/L Na2HPO4 anhydrous, 30 g/L KH2PO4, 5 g/L NaCl, and 10 g/L NH4Cl dis-solved in Milli-Q filtered water. M9 trace elements stock was a 2000x solution with composition of 3.0 g/L FeSO4·7H2O, 4.5 g/L ZnSO4·7H2O, 0.3 g/L CoCl2·6H2O, 0.4 g/L Na2MoO4·2H2O, 4.5 g/L CaCl2·H2O, 0.2 g/L CuSO4·2H2O, 1.0 g/L H3BO3, 15 g/L disodium ethylene-diamine-tetra-acetate, 0.1 g/L KI, 0.7 g/L MnCl2·4H2O and concentrated HCL dissolved in Milli-Q filtered water. Vitamin mix and trace elements concentration was [1×] in the M9 medium.
Sugarcane juice medium
Raw sugarcane juice was collected from a sugar cane mill (Enterprise Factory, Patoutville, Louisiana, USA) and transported to the University of Illinois Energy Farm where it was stored at − 80 °C until required for further use. Sugarcane juice (SCJ) for the cultivation medium was prepared by centrifugation in order to remove solid particles (rpm ≥ 10,000×g for 20 min at 4 °C) then filter sterilized with 0.2 µm pore size filter. Later, Sugarcane juice (SCJ) medium was prepared by mixing clarified sugarcane juice with M9 salts (final concentration 1×), 2 mM MgSO4, 100 μM CaCl2 and 1× trace elements and Wolfe’s vitamin solution. HPLC analysis of the clarified sugar cane juice showed the following sugar composition (g/L): sucrose 231.8, glucose 3.5; fructose 3.0.
Strains constructions with cscBKA cassette using homologous recombination
General recombinant DNA techniques were applied according to standard protocols for one-step cloning and chromosomal integration of DNA (pOSIP), Additional file 2: Text file S1 [24, 25]. PCR products were purified
using plasmid miniprep kit, QIAprep Spin Miniprep Kit. Here, the integration site of csc DNA sequence was into E. coli 186 attB site using pOSIP-KO integration mod-ule. The integration site of DNA sequence into bacterial chromosomes was selected based on the available inte-gration sites. Csc gene cluster (cscK, cscB, cscA) (Fig. 1a) was amplified from donor strain, E. coli W using primers;
Forward primer 5′-ATG CAT CUG GGA TAT AGA GCT
ATC GAC AAC AACCG-3′ and Reverse primer 5′-AGA
GGG CUT TAT GTT AAC CCA GTA GCC AGA GTG CTC -3′. E. coli K-12 construct with csc cassette integrated was abbreviated to MGcscBKA. MGcscBKA derivative with
a variant SNP in cscB Q353H was abbreviated
MGcscB-KAp [16].
Adaptive laboratory evolution of developing improved fitness in start strains
Three biological replicates from each of E. coli strains; two genetic constructs of K-12 MG1655 with csc gene
cassette MGcscBKA and MGcscBKAp and E. coli W
Genome sequencing and mutation calling of the ALE derived strains
Overall, there were six endpoint populations for each of K-12 MG1655 constructs and 3 endpoints populations from E. coli W were selected along with clones derived from for whole genome re-sequenced in order to reveal their underlying genotypes. Genomic DNA was extracted from overnight cultures at the stationary phase of growth using PureLink® Genomic DNA extraction kits (Invitro-gen, CA). The quality of extracted DNA was assessed by using a Nanodrop spectrophotometer. Concentration of the extracted DNA was quantified using Qubit ds-DNA high sensitivity assay. Paired-end re-sequencing libraries were generated using a 300 cycle (150 bp × 2) kit from Illumina (San Diego, CA) with loading concentration of 1.2 pico-Molar on Illumina Nextseq sequencer (Model 550). Mutation finding was performed using a pipeline as described in Phaneuf et al. [26] based on Breseq version 0.30.1 [27] to map sequenced reads to the reference strain (NCBI accession number NC_000913.3, K-12 MG1655 and NC_017664, W). The average coverage for each of the resequenced samples was over 25x. For population samples sequenced, mutations were reported if they were over 20% frequency unless they were found in a clone isolated from a given population sample. In this case, the frequency of a clone mutation was reported, if found, in the population (see Additional file 1: Data file S1).
Validation of mutations causality in rpoB, rpoC and pyrE‑rph genes
Identified causal mutations found in the current study (see mutation analysis results) and the control reference ALE experiment by LaCroix et al. [22] on glucose (GLU-ALE) were used to check causality in the identified genes or genetic regions on either sucrose and glucose minimal media. Briefly, the identified key single point mutations
(SNPs) in open reading frames (ORF) mainly for rpoB,
rpoC genes and the unique deletion in the intergenic
region between pyrE/rph were used to check the causal-ity of mutations in these specified genetic regions with sucrose for growth increase from the two experiments. Accordingly, selected isolates from ALE derived clones on sucrose which harbor any single mutation or double mutations in these genes were selected as well. Fitnesses increase comparison relative to the starting strain were examined to investigate the effect/essentiality of the key causal mutations for fast growth on either sucrose or glucose as a sole carbon source. The same recombinant DNA technique used to generate MGcscBKA constructs with the csc regulon was applied here to generate GLU-ALE constructs with a sucrose utilization cassette (GLU-ALE_csc constructs).
Extracellular metabolites and physiological properties Cultures of the re-sequenced clones were inoculated from stationary phase overnight cultures into media M9 containing sucrose under the same conditions as the ALE experiment. Samples were aliquoted over the growth curve to measure optical density OD600nm and collect extracellular metabolites. Extracellular metabolites were collected as supernatant from each growing culture using 0.2 µm filter to remove the cells. Supernatants were
col-lected and saved at − 20 °C for subsequent
chroma-tographic analyses. Concentration of sugars (glucose, fructose and sucrose) beside other organic acids were analyzed using high performance liquid chromatography (HPLC) column (UltiMate 3000, Thermo-Fischer Scien-tific, Waltham, Massachusetts, USA). The metabolites were separated using an Aminex HPX-87H ion exclusion column (Bio-Rad, Hercules, California, USA) and were isocratically eluted at 30 °C, with a flow rate of 0.6 mL/ min, using a 5 mM sulfuric acid solution as mobile phase. The refractive index (RI) detector was selected for detec-tion. Sample concentrations were quantified by com-paring to a standard curve of known concentrations. Substrate uptake and metabolites excretion rates were calculated from multiplying the growth rate and the slope of a linear regression of gram dry cell weigh (gCDW) ver-sus the substrate or products concentration. The biomass yield at the steady state (YX/S_ss) was calculated as the quotient of the growth rate and the sucrose uptake rates during the exponential growth phase.
Results
Evolution of multiple E. coli strains to grow rapidly on sucrose minimal media
ALE was utilized to generate strains with improved fit-ness utilizing sucrose as a sole carbon source. Three dif-ferent E. coli starting strains were used; two engineered K-12 MG1655 strains with sucrose utilization enabling
csc constructs and wild-type E. coli W. The two
con-structs inserted into the K-12 MG1655 host genome dif-fered by a SNP mutation in the cscB gene, resulting in the residue change Q353H, and were labeled as
MGc-scBKA and MGcMGc-scBKAp (see Additional file 2: Text S1
for a detailed description). The Q353H derivative of cscB has been demonstrated to display an increased sucrose uptake rate in E. coli EC3132 [16], thus it was rea-soned that it may have an impact when heterologously expressed in K-12 MG1655.
the passage size. Therefore, the experiments were termi-nated when the parallel replicates showed a small to no delta change in the growth rate similar to the control ALE on glucose [22], with the passage volume equal to 1%. Each of the replicate evolutions underwent between approximately 8.65 × 10¹² to 9.87 × 10¹² cumulative cell divisions (CCD, Table 1). The use of CCD has been dem-onstrated as a useful timescale for ALE experiments as
a time coordinate as it accounts for variability due to a varying number of cells passed serially from one flask to the next [29].
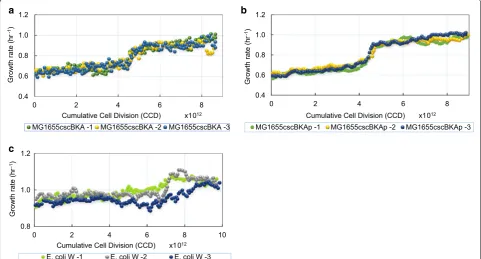
The observed growth rate trajectories during the ALE experiments for each of the evolved populations are
shown in Fig. 2 for the MGcscBAK, MGcscBKAp, and
E. coli W strains. Each population displayed an increase in growth rate over the starting strain (Table 1). The growth rate increases were 1.49 ± 0.098-, 1.75 ± < 0.01-, 1.25 ± 0.036-fold faster than the starting strains for the
MGcscBKA, MGcscBKAp and E. coli W strains,
respec-tively (standard deviation, n = 3). There was one observed fitness jump (i.e., increase in growth rate) for all the populations across all independent ALE replicates. The two similar K-12 MGcscBKA and MGcscBKAp strains evolved to relatively similar growth rates, with similar dynamics along the course of the ALE, whereas the fold increase in fitness for E. coli W was small given its initial faster wild-type growth rate.
Physiological characterization of evolved clones
Clones from the endpoint populations of each of the nine replicate ALEs were isolated and characterized in terms of growth rate and compared to the starting strains to understand the enhanced evolved phenotype. One clone isolated from each replicate endpoint population was analyzed, three clones for each of the three replicates of Table 1 Properties of the ALE experiments end point
populations
Ratios of fitness increase were determined from growth rates that were calculated based on the last three flasks during exponential growth. CCD, cumulative cell divisions
ALE experiment Strain
(population) Total CCD x10
12 Ratio of fitness
increase to start strain
K-12 MGcscBKA 1 8.65 1.72
2 8.75 1.46
3 8.94 1.61
K-12 MGcscBKAp 1 9.02 1.48
2 9.02 1.47
3 8.85 1.48
E. coli W 1 9.71 1.29
2 9.78 1.31
3 9.87 1.22
0.4 0.6 0.8 1.0 1.2
0 2 4 6 8
rh(
et
ar
ht
wor
G
-1)
Cumulative Cell Division (CCD) x1012
MG1655cscBKA -1 MG1655cscBKA -2 MG1655cscBKA -3
0.4 0.6 0.8 1.0 1.2
0 2 4 6 8
Grow
th rate (h
r
-1)
Cumulative Cell Division (CCD) x1012
MG1655cscBKAp -1 MG1655cscBKAp -2 MG1655cscBKAp -3
0.8 1.0 1.2
0 2 4 6 8 10
rh(
et
ar
ht
wor
G
-1)
Cumulative Cell Division (CCD) x1012
E. coli W -1 E. coli W -2 E. coli W -3
a
c
b
MGcscBAK, MGcscBKA, and E. coli W. The increases in growth rates on sucrose M9 were between 1.17 and 1.57-fold for MGcscBKA clones, 1.25–1.38-fold for MGcscBKAp, and 1.06–1.22-fold for E. coli W, Table 2. Surprisingly, there was one isolated clone that had the same fitness, i.e. growth rate, as the starting strain from MGcscBKA (the ‘#2’ clone) (Fig. 3). However, given that there were two additional clones from this starting strain from the additional two independent replicates with a significant improvement in fitness, additional clones were not examined.
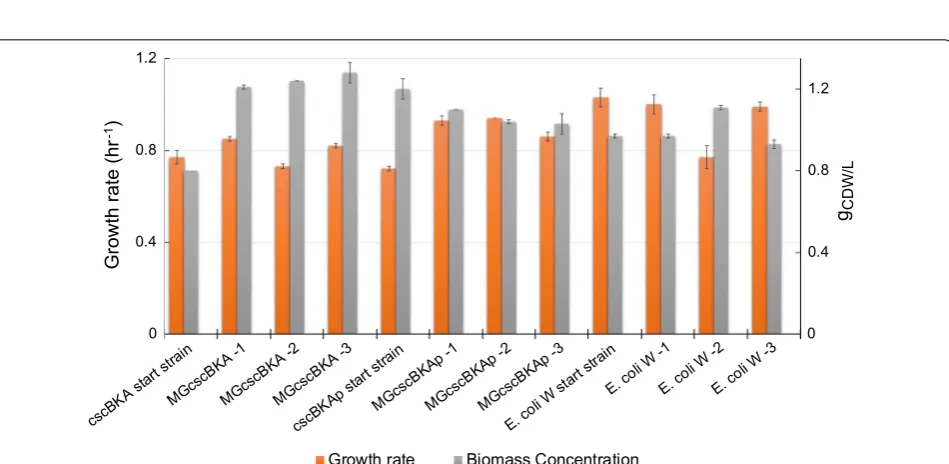
Furthermore, growth profiling of all of the sucrose-evolved endpoint clones was performed in glucose M9 media. In agreement with the observed sucrose M9 phenotypes, all clones demonstrated an increased growth rate over the start strains without any significant changes to the final cellular density (gCDW/L) (Fig. 4). One exception to this was E. coli W replicate #2 which exhibited a slightly lower growth rate than the start-ing strain. The observation that the vast majority of the sucrose-evolved strains also displayed a fast growth phe-notype on glucose is an indication that most mutations acquired during the sucrose ALE experiment were ben-eficial for growth on both sugars. Such a phenotype is advantageous for a platform strain as it could be used in multiple media conditions. All isolated clones were then sequenced to examine their genetic basis along with pop-ulation sequencing to better understand the genotypes
responsible for the observed increases in population fit-ness from all of the independent ALE experiments.
Whole genome sequencing and mutation analysis
Whole genome sequencing was used to determine the genetic basis of the improved fitness phenotypes for the evolved E. coli strains on sucrose minimal medium. The nine isolated endpoint clones were sequenced along with the corresponding populations from which they were iso-lated. Overall, there were nine genes or genetic regions identified from the K-12 strains found in clones and/or populations (frequency cutoff ≥ 0.20) that were mutated either once or several times across the parallel independ-ent replicates. This number was five for E. coli W. Addi-tionally, there was a range of 1-3 unique mutations found in all of the clones sequenced, with most clones possessing one mutation. When looking at the population data, there was a range of 0-3 mutations detected in each sample with a frequency cutoff ≥ 0.20, indicating different levels of clonal interference in different replicates. Key mutations were identified by comparing all clones and population samples sequenced and identifying open reading frames (i.e., genes), or intragenic regions that had multiple unique mutations or were mutated across independent experi-ments (Table 3). Interestingly, there were no shared key mutations found between the K-12 and E. coli W experi-ments. Full mutation lists for each sequenced sample are given in Additional file 1: Data file S1.
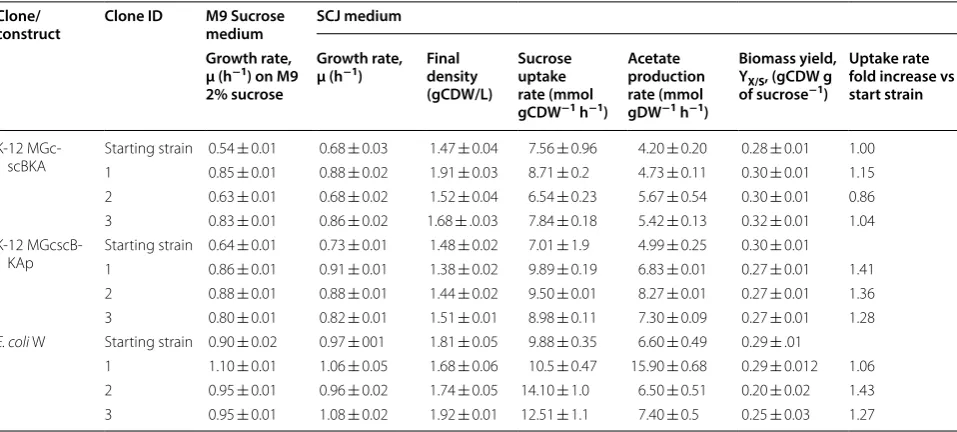
Table 2 Physiological data for the evolved isolates on sucrose M9 medium and sugarcane juice M9 minimal medium (SCJ medium)
The physiological properties of each of the clones isolated from the independent endpoint ALE experiments were compared to examine whether there were any improved phenotypic outcomes across the different experiments
Clone/
construct Clone ID M9 Sucrose medium SCJ medium Growth rate,
μ (h−1) on M9
2% sucrose
Growth rate,
μ (h−1) Final density
(gCDW/L)
Sucrose uptake rate (mmol gCDW−1 h−1)
Acetate production rate (mmol gDW−1 h−1)
Biomass yield, YX/S, (gCDW g
of sucrose−1)
Uptake rate fold increase vs start strain
K-12
MGc-scBKA Starting strain 0.54 1 0.85 ±± 0.01 0.01 0.68 0.88 ±± 0.02 0.03 1.47 1.91 ±± 0.03 0.04 8.71 7.56 ±± 0.2 0.96 4.20 4.73 ±± 0.20 0.11 0.28 0.30 ±± 0.01 0.01 1.001.15 2 0.63 ± 0.01 0.68 ± 0.02 1.52 ± 0.04 6.54 ± 0.23 5.67 ± 0.54 0.30 ± 0.01 0.86 3 0.83 ± 0.01 0.86 ± 0.02 1.68 ± .0.03 7.84 ± 0.18 5.42 ± 0.13 0.32 ± 0.01 1.04 K-12
MGcscB-KAp Starting strain 0.64 1 0.86 ±± 0.01 0.01 0.91 0.73 ±± 0.01 0.01 1.48 1.38 ±± 0.02 0.02 9.89 7.01 ±± 1.9 0.19 4.99 6.83 ±± 0.25 0.01 0.30 0.27 ±± 0.01 0.01 1.41 2 0.88 ± 0.01 0.88 ± 0.01 1.44 ± 0.02 9.50 ± 0.01 8.27 ± 0.01 0.27 ± 0.01 1.36 3 0.80 ± 0.01 0.82 ± 0.01 1.51 ± 0.01 8.98 ± 0.11 7.30 ± 0.09 0.27 ± 0.01 1.28 E. coli W Starting strain 0.90 ± 0.02 0.97 ± 001 1.81 ± 0.05 9.88 ± 0.35 6.60 ± 0.49 0.29 ± .01
The most predominantly mutated genes or intergenic regions identified across multiple independent repli-cates in the evolved K-12 strains were related to the RNA polymerase subunits rpoB and rpoC, as well as orotate
phosphoribosyltransferase, pyrE. The first key mutations were found in the β (beta) and β’ (beta prime) subunit of RNA polymerase encoded in rpoB and rpoC, respec-tively [30, 31]. The number of unique mutations for each
a
c
b
Fig. 3 Growth profiles of ALE clones isolated from the end populations of the evolution experiments versus starting strains on M9 minimal medium with 20 g/L sucrose. Error bars represent standard deviation (n = 3). MG1655 construct with csc (MGcscBKA) growth profile is represented on a, MGcscBKA derivatives with cscB SNP (MGcscBKAp) mutation on b and E. coli W strain on c. Optical density measurement at OD600 were measured
on a plate reader and the common ratio between the plate reader OD600 and a benchtop spectrophotometer with a 1 cm path length is 4.2
Fig. 4 Characterization of the isolated sucrose-evolved clones on 2 g/L glucose M9 minimal medium. Shown is a stacked histogram of growth rate (h−1, orange) of the selected clones and their corresponding final cellular density (gCDW/L, grey). The plot shows that mutations acquired during
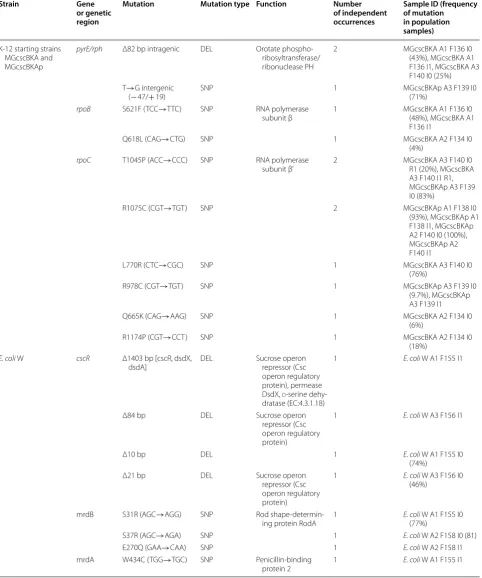
Table 3 Key mutations found after evolution of E. coli on sucrose
The sample ID has a unique identifier—(A) refers to the independent replicate, (F) refers to the flask number, and (I) to the type of the isolate: population (0) or clone (1)
Strain Gene or genetic region
Mutation Mutation type Function Number of independent occurrences
Sample ID (frequency of mutation in population samples)
K-12 starting strains MGcscBKA and MGcscBKAp
pyrE/rph Δ82 bp intragenic DEL Orotate phospho-ribosyltransferase/ ribonuclease PH
2 MGcscBKA A1 F136 I0 (43%), MGcscBKA A1 F136 I1, MGcscBKA A3 F140 I0 (25%) T→G intergenic
(− 47/+ 19) SNP 1 MGcscBKAp A3 F139 I0 (71%)
rpoB S621F (TCC→TTC) SNP RNA polymerase
subunit β 1 MGcscBKA A1 F136 I0 (48%), MGcscBKA A1 F136 I1
Q618L (CAG→CTG) SNP 1 MGcscBKA A2 F134 I0
(4%) rpoC T1045P (ACC→CCC) SNP RNA polymerase
subunit β’ 2 MGcscBKA A3 F140 I0 R1 (20%), MGcscBKA A3 F140 I1 R1, MGcscBKAp A3 F139 I0 (83%)
R1075C (CGT→TGT) SNP 2 MGcscBKAp A1 F138 I0
(93%), MGcscBKAp A1 F138 I1, MGcscBKAp A2 F140 I0 (100%), MGcscBKAp A2 F140 I1
L770R (CTC→CGC) SNP 1 MGcscBKA A3 F140 I0
(76%)
R978C (CGT→TGT) SNP 1 MGcscBKAp A3 F139 I0
(9.7%), MGcscBKAp A3 F139 I1
Q665K (CAG→AAG) SNP 1 MGcscBKA A2 F134 I0
(6%)
R1174P (CGT→CCT) SNP 1 MGcscBKA A2 F134 I0
(18%) E. coli W cscR Δ1403 bp [cscR, dsdX,
dsdA] DEL Sucrose operon repressor (Csc operon regulatory protein), permease DsdX, d-serine
dehy-dratase (EC:4.3.1.18)
1 E. coli W A1 F155 I1
Δ84 bp DEL Sucrose operon repressor (Csc operon regulatory protein)
1 E. coli W A3 F156 I1
Δ10 bp DEL 1 E. coli W A1 F155 I0
(74%) Δ21 bp DEL Sucrose operon
repressor (Csc operon regulatory protein)
1 E. coli W A3 F156 I0 (46%)
mrdB S31R (AGC→AGG) SNP Rod
shape-determin-ing protein RodA 1 E. coli(77%) W A1 F155 I0
S37R (AGC→AGA) SNP 1 E. coli W A2 F158 I0 (81)
E270Q (GAA→CAA) SNP 1 E. coli W A2 F158 I1
mrdA W434C (TGG→TGC) SNP Penicillin-binding
of rpoB and rpoC found across parallel populations and clones was 2 and 6 unique SNPs, respectively. Both rpoB mutations occurred in one region between amino acids
residues (AAR) 618 and 621, whereas the rpoC
muta-tions occurred closer to the carboxyl terminus (AAR total 1342) of the beta prime subunit at AAR between 665 and 1174, Table 3. There was one co-occurrence of
a rpoC mutation, T1045P (ACC→CCC), which was
observed in experiments starting from both K-12 strains. Interestingly, mutations in rpoB and rpoC genes have previously been found repeatedly across all different K-12 ALE experiments, indicating a very high level of parallel evolution [22, 32, 33]. It is also interesting to note that no clone contained mutations in both genes, but there were often multiple mutations in these genes found in popu-lation samples (never adding up to more than approxi-mately 1 in mutation frequency). Specific mutations in these two subunits of the RNA polymerase, i.e. the beta and the beta prime, were found to carry beneficial growth
advantages when E. coli grows on minimal medium with
a range of different carbon sources [22, 32–36]. The sec-ond key mutated region observed in K-12 strains were related to pyrE expression. K-12 strains are known to possess a frame shift in rph which leads to pyrimidine starvation on minimal media and can be alleviated by mutations [37]. Similar mutations were reported in dif-ferent ALE studies on difdif-ferent carbon sources [32, 34]. Mutations in this genetic region were found to improve fitness on minimal media with an increase in growth rate of 17% over the starting strain on glucose [22].
Strain-specific adaptive mutations in E. coli W clones were predominantly affecting a metabolic regulation pathway targeting the csc operon and cell wall biosyn-thesis through rod shape determining proteins. Many of the mutations found related to the csc operon were in the cscR gene, which encodes a transcriptional repressor regulator for csc operon (cscB, cscA, cscK genes) in low concentrations of sucrose [11, 16]. A cscR mutation was observed in two endpoint clones (out of three) and a total of four mutations relating to this gene were found over-all when considering population sequencing. The clonal cscR mutations were an intragenic in-frame Δ84 bp dele-tion and an Δ1403 bp deledele-tion which also included the dsdX and dsdA genes located next to cscR on the chromo-some. Both mutations are likely a disruption of the cscR gene with potentially a loss of function. The two genes
dsdX and dsdA are pseudogenes coding for a d-serine
transporter and d-serine ammonia-lyase, respectively, as part of serine degradation pathway [38, 39]. Deletions of
cscR were previously demonstrated to improve growth
and yield for chemical bioproduction [12, 40]. Another pair of genes that were mutated several times along
parallel experiments is mrdB (three times) and mrdA (one time). MrdB is annotated as rod shape-determining protein RodA [41, 42] and the related mrdA is annotated as penicillin-binding protein 2 [43]. All of the mutations
found in the mrdB and mrdA genes were SNPs
chang-ing the properties of the protein through schang-ingle amino acid changes (see Table 3). The impact of each SNP on the protein functionality or activity was not immediately clear based on the known structural data for these genes. Mutations in the mrdA and mrdB genes were reported in a previous temperature tolerance ALE experiment [44]. Mutations in mrd loci encoding the elongasome such as mrdA and mrdB have been shown to increase the levels of the growth-rate-regulating molecule (p)ppGpp, which potentially can lead to carbon metabolism modulation [45]. Additionally, a causal mutation in the cell shape determining gene mrdA was identified in ALE for devel-oping osmotolerant E. coli strains [46].
Validation of mutational causality by reverse engineering
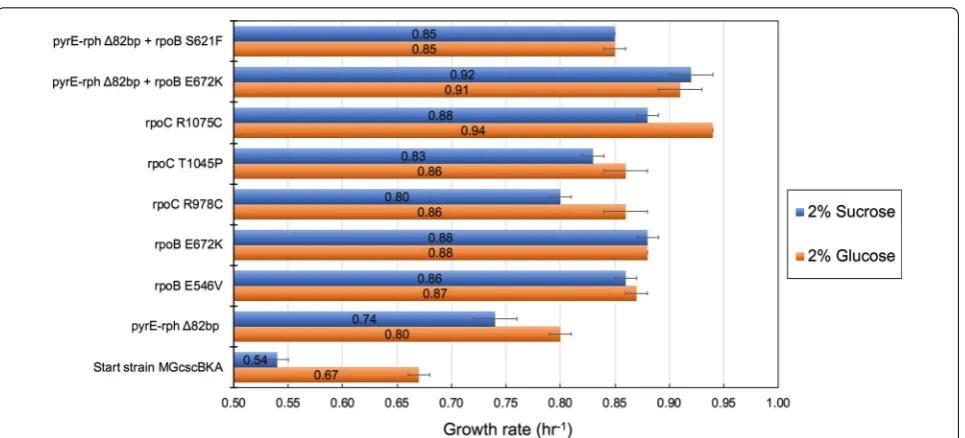
To examine the causality of key mutations identified in this study, growth screens were performed for relevant single and double mutant strains of K-12 MG1655. Such mutant strains (see methods, validation of mutation causality) were either isolated directly from the current study (i.e., endpoint clones containing the csc construct and mutations) or generated from previously constructed mutant strains [22] which were subsequently engineered to also contain the csc gene cassette (see Table 4). Growth screens were performed side by side on M9 medium sup-plemented with either sucrose or glucose (20 g/L). Genes investigated for potential causality for improved fitness, i.e., higher growth rate, were rpoC, rpoB and the inter-genic deletion ∆82 bp between pyrE/rph. To put these results in context, ALE-derived mutations in these exact genes were validated previously to confer fitness advan-tages in various substrate environments, and in particu-lar when grown on glucose [22, 32, 33]. Figure 5 provides comparative fitness levels for each adaptive mutation on either sucrose or glucose.
mutation affecting nucleotide biosynthesis (pyrE). Fur-thermore, analysis showed that when multiple mutations were present in a strain, such double mutant strains con-ferred a higher fitness advantage over single mutants with the identical mutations. Specifically, a strain with a muta-tion in the intragenic region between pyrE/rph genes and in rpoB (E672K) had higher fitness than strains with either single mutations. This pattern of co-occurrence was observed when evolving K-12 MG1655 on either glu-cose [22] or sucrose (endpoint isolate derived from MGc-scBKA ALE#1 population from the current study).
Benchmarking of evolved strains performance on sugarcane juice
To further evaluate the ALE-derived clones for sucrose utilization, each endpoint clone was characterized on a raw feedstock, sugarcane juice (SCJ) medium. A M9 medium base was utilized with SCJ to test both evolved and starting strains (Table 2 and Additional file 2: Figs. S1–S3). Raw SCJ mainly consists of three carbon sources; sucrose with the highest fraction, and glucose and fruc-tose in small fractions [47]. The sucrose uptake rates (SURs) and acetate production rates (APRs) for all of the Table 4 Source of key mutations validated for causality in isolated strains from the current study or constructed previously from Lacroix et al. [22]
Genetic region Mutation Source
K-12 MG1655 N/A N/A
pyrE-rph Δ82 bp deletion LaCroix et al. [22]
rpoB E672K (GAA→AAA) LaCroix et al. [22]
rpoC R1075C (CGT→TGT) MGcscBKAp A1 F138 I1
MGcscBKAp A2 F140 I1
R978C (CGT→TGT) MGcscBKAp A3 F139 I1
T1045P (ACC→CCC) MGcscBKA A3 F140 I1 with additional mutations of (tdcG, baeS)
pyrE-rph+rpoB Δ82 bp + E672K (GAA→AAA) LaCroix et al. [22] pyrE-rph+rpoB Δ82 bp + S621F (TCC→TTC) MGcscBKA A1 F136 I1
isolated clones were compared to each of the starting strains. Overall, there was an increase in the SUR for the
K-12 MG1655 and E. coli W endpoint clones. The
aver-age increase in SUR was 1.10- ± 0.05- and 1.35 ± 0.05-fold increase for MGcscBKA and MGcscBKAp isolates, respectively, and a round 1.2 ± 0.2-fold increase for E. coli W isolates. Analysis of the MGcscBKAp starting strain showed a slightly lower SUR than that of the MGcscBKA starting strain. This finding was in contrast to the obser-vation that such a mutation in cscB leads to a two-fold increase in sucrose uptake rate in a different E. coli strain
[16]. However, the evolved MGcscBKAp clones
demon-strated higher uptake rates than the MGcscBKA evolved clones (Table 2). Thus, it appears that there was an impact from this mutation at faster growth rates displayed by the evolved clones, but not the starting strains. However, reverse engineering of this mutation in the mutated end-point strains of the MGcscBKA evolved clones would be needed to show this definitively.
As a general observation on the growth profiles of the evolved isolates, the initial amounts of glucose and fruc-tose (approximately, 1–2 mM) were first depleted fol-lowed by the consumption of sucrose (Additional file 2: Figs. S1–S3). Interestingly, during the exponential growth phase, fructose and glucose accumulated in the cul-ture broth in some replicates (e.g., E. coli W endpoint
replicate #1, Additional file 2: Fig. S1) and was then con-sumed near the end of the aerobic cultivation. It was also observed that acetate was produced and accumulated during the course of the cultivation for all the tested clones except for the E. coli W clones (Additional file 2: Figs. S1–S3). In the evolved W clones, acetate accumu-lated up until approximately 10 h after inoculation, and then it was consumed as the sucrose, glucose, and fruc-tose were depleted.
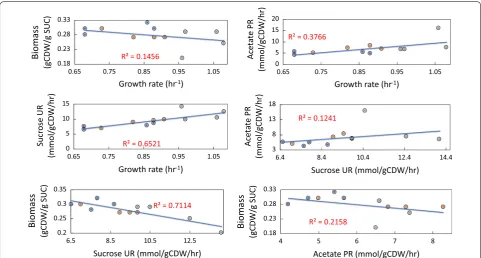
The physiological profiling of selected endpoint iso-late on SCJ were compared to examine whether there were any correlations or observed trends across the dif-ferent evolved replicate experiments. Although the evolved clones isolated from the endpoints of the ALE experiments mostly showed a similar increase in fit-ness, the SUR and biomass yields varied more signifi-cantly (Table 2). However, the SURs and APRs were most often higher in endpoint clones compared to the start-ing strains (the exceptions bestart-ing one clone, MGcscBKA isolate #2, in which SUR was not significant). There was a weak correlation (r2= 0.12) between the increase
observed in both SUR and APR, Fig. 6. Alternatively,
there was a stronger correlation between the increase in SURs and APRs and the increased growth rate with cor-relations of (r2= 0.65) and (r2= 0.37), respectively. For the characterized clones, a trade-off between the SURs
and biomass yield at the steady state (YX/S) was observed where higher SURs led to lower biomass yields, i.e. an inverse correlation with an r2= 0.71. The results implied that there were multiple mutational mechanisms through which a similar increase in the growth rate could be achieved (i.e., alternative optimal solution). The observed variations in SURs, APRs, and biomass yields further showed that under the selection pressure applied via ALE, the populations adapted through different trajec-tories in order to reach an apparent optimum metabolic state enabling a fast growth phenotype on sugarcane juice.
Discussion
Platform strains that are able to exploit sucrose as abun-dant cheap carbon source from raw materials sources such as molasses and sugarcane juice can contribute to the increased economic and environmental sustain-ability of bio-based chemical production. Most of previ-ous attempts to engineer a fast-growing K-12 strain on sucrose, to the same rate as growth on glucose, have not been successful. Thus, the scope of the current study was to generate a platform strains able to utilize sucrose as a carbon source and grow rapidly using adaptive laboratory evolution. Accordingly, the main findings from the cur-rent work are: (1) it was possible to effectively generate platform strains with elevated growth rates in a sucrose feedstock environment, which includes validation on raw material sugarcane juice. Moreover, the developed plat-form strains are suitable as fermentation chassis with an extended capability to also rapidly utilize glucose to the same level as strains evolved to grow solely on glucose [22]; (2) this study establishes a transferable sucrose uti-lization cassette for use in K-12 strains where sucrose utilization is not native; and (3) the identification of key reproducibly-occurring mutations using multiple parallel replicate ALE experiments. These mutations were vali-dated using knock-in strains and can be used as cell engi-neering parts in additional strains of interest.
The ALE approach utilized in this work was success-ful in generating strains with improved fitness over their respective starting strains after approximately 40 days of continuous passaging in the exponential growth phase. The selected clones derived from the evolved populations for the K-12 strains exhibited increased carbon uptake rates for both sucrose and glu-cose, making them suitable for both carbon sources. Furthermore, the approach utilized in this work to chromosomally integrate the csc cassette was successful in generating a genetically stable strain (see Additional
file 2: Text), as demonstrated throughout the extent
of work in the study. This is in contrast to previously
published plasmid expressions that have been shown to lead to complications in industrial production due to requirements for the addition of antibiotics and the burden of maintaining high-copy numbers plasmids [15, 48].
The key mutations identified in this study can be used as engineering parts for strain engineering. Given that a similar set of mutations enables enhanced growth on both glucose and sucrose, it is reasonable to expect that such mutations and strains have growth benefits on similar substrates, or mixes of such substrates, and this represents an avenue forward for generating a more universally applicable platform strain [34, 36, 49]. Previ-ously, the key mutations identified in the RNA polymer-ase subunits (RNAP) rpoB and rpoC were found to have large-scale systematic transcriptional changes that influ-ence specific cellular processes and to be responsible for fast growth [34, 36] on minimal medium. The benefits of such mutations in bioprocessing have been demonstrated and establish how strains with such mutations can serve as platform strains for enhanced production phenotypes [50]. Consequently, it appears that the fast-growing phe-notype of K-12 on sucrose is more likely more due to a systems level regulatory change rather than changes spe-cific to sucrose utilization.
There are a number of avenues to explore to build off of the results from this study. Such work could include an effort to study the impact of the key mutations individu-ally, or in combination, on the fast growth phenotype. One interesting feature to pursue was that the evolved K-12 strains demonstrated lower SURs on sucrose than the W strain and this could be further examined. It has been shown that E. coli W maintains a highly oxidative metabolic state either on glucose or sucrose with low accumulation of overflow metabolites such as acetate [51]. The two E. coli strains possess significantly different genome sizes (4.90 Mbp for W vs 4.64 Mbp for K-12) with different numbers of genes, pseudogenes, and mobile
elements [10], therefore a comparative genomic study
to associate this particular feature was not apparent. A potentially fruitful approach to address this observed dif-ference would likely include growth of the evolved and unevolved E. coli W and K-12 strains along with multiple omics assays to better understand the underlying mecha-nisms, as performed previously [36], in a sucrose utiliz-ing context. Further, such an analysis with an engineered production pathway would also place the evolved pheno-types in a relevant production context.
the underlying causal mutations of the evolved strains. Thus, the ALE derived clones and the beneficial mutations represent a promising platform for developing a sucrose-based bioproduction chassis and can provide a good start-ing point to develop sucrose utilization in other industrially relevant E. coli strains.
Additional files
Additional file 1: Data file S1. All mutation list of ALE resequenced clones and populations.
Additional file 2: Text file S1. Full strains design description and different genetic manipulation methods.
Abbreviations
ALE: adaptive laboratory evolution; SUC: sucrose; SUR: sucrose uptake rate; APR: acetate production rate; GLUALE: glucose adaptive laboratory evolution; RNAP: RNA polymerase; AAR : amino acids residues.
Acknowledgements
We would like to thank Mohammad Radi, Patrick Phaneuf and Anna Koza for their help in the project. Funding for the project was provided by The Novo Nordisk Foundation Grant Numbers NNF14OC0011269 and NNF10CC1016517. We greatly appreciate the help of Tim Mies (Energy Bio-sciences Institute, University of Illinois for collecting and storing the cane juice utilized in this study. This part of the research was supported by the Energy Biosciences Institute (project OO2J14).
Authors’ contributions
Conceived and designed the experiments: ETM, AMF. Performed most of the experiments; ETM. JL constructed the pOSIP-csc plasmids and JL, ETM used it for chromosomal integration of the csc cassette. Contributed materials, i.e. Sugarcane Juice: IC and RIM. Wrote the paper: ETM and AMF. HM, JL, MJH, ATN, IC and RIM; reviewed manuscript and helped in discussing the results. All authors read and approved the final manuscript.
Funding
Funding for the project was provided by The Novo Nordisk Foundation Grant Numbers NNF14OC0011269 and NNF10CC1016517.
Availability of data and materials
All data generated or analyzed during this study are included in this published article [and its additional files].
Ethics approval and consent to participate
Not applicable.
Consent of publication
Not applicable.
Competing interests
The authors declare that they have no competing interests.
Author details
1 Novo Nordisk Foundation Center for Biosustainability, Technical
Univer-sity of Denmark, Building 220, Kemitorvet, Lyngby 2800 Kgs, Denmark.
2 Department of Animal Sciences, Institute for Genomic Biology and Energy
Biosciences Institute, University of Illinois, Urbana, IL 61801, USA. 3 Department
of Bioengineering, University of California, 9500 Gilman Drive La Jolla, San Diego, CA 92093, USA.
Received: 3 March 2019 Accepted: 22 June 2019
References
1. Bevan MW, Franssen MCR. Investing in green and white biotech. Nat Biotechnol. 2006;24:765. https ://doi.org/10.1038/nbt07 06-765. 2. Koutinas AA, Wang R, Webb C. Evaluation of wheat as generic feedstock
for chemical production. Ind Crops Prod. 2004;20:75–88.
3. Renouf MAA, Wegener MKK, Nielsen LKK. An environmental life cycle assessment comparing Australian sugarcane with US corn and UK sugar beet as producers of sugars for fermentation. Biomass Bioenerg. 2008;32:1144–55.
4. Fadel M, Keera AA, Mouafi FE, Kahil T. High level ethanol from sugar cane molasses by a new thermotolerant Saccharomyces cerevisiae strain in industrial scale. Biotechnol Res Int. 2013;2013:253286.
5. Jung MY, Jung HM, Lee J, Oh MK. Alleviation of carbon catabolite repres-sion in Enterobacter aerogenes for efficient utilization of sugarcane molas-ses for 2,3-butanediol production. Biotechnol Biofuels. 2015;8:106. 6. Monk JMM, Koza A, Campodonico MAA, Machado D, Seoane JMM,
Palsson BOO, et al. Multi-omics quantification of species variation of
Escherichia coli links molecular features with strain phenotypes. Cell Syst.
2016;3(238–251):e12.
7. Baeshen MN, Al-Hejin AM, Bora RS, Ahmed MMM, Ramadan HAI, Saini KS, et al. Production of biopharmaceuticals in E. coli: current scenario and future perspectives. J Microbiol Biotechnol. 2015;25:953–62.
8. Idalia V-MN, Bernardo F. Escherichia coli as a model organism and its appli-cation in biotechnology. Recent Adv Physiol Pathog Biotechnol Appl. 2017. https ://doi.org/10.5772/67306 .
9. Bergey DH, David H, Holt JG. Bergey’s manual of determinative bacteriol-ogy. Medical; 1994. https ://books .googl e.se/books /about /Berge y_s_ Manua l_of_Deter minat ive_Bacte ri.html?id=jtMLz aa5ON cC&redir _esc=y. Accessed 4 Jun 2019.
10. Archer CT, Kim JF, Jeong H, Park JH, Vickers CE, Lee SY, et al. The genome sequence of E. coli W (ATCC 9637): comparative genome analysis and an improved genome-scale reconstruction of E. coli. BMC Genomics. 2011;12:9. https ://doi.org/10.1186/1471-2164-12-9.
11. Bockmann J, Heuel H, Lengeler JW. Characterization of a chromosomally encoded, non-PTS metabolic pathway for sucrose utilization in
Escheri-chia coli EC3132. Mol Gen Genet. 1992;235:22–32.
12. Sabri S, Nielsen LK, Vickers CE. Molecular control of sucrose utilization in Escherichia coli W, an efficient sucrose-utilizing strain. Appl Environ Microbiol. 2013;79:478–87.
13. Cheng L-CC, Hor L-II, Wu J-YY, Chen T-LL. Effect of specific growth rate on the production of a recombinant nuclease by Escherichia coli. Biochem Eng J. 2003;14:101–7.
14. Zawada J, Swartz J. Maintaining rapid growth in moderate-density
Escherichia coli fermentations. Biotechnol Bioeng. 2005;89:407–15. https
://doi.org/10.1002/bit.20369 .
15. Diaz Ricci JC, Hernández ME. Plasmid effects on Escherichia coli metabo-lism. Crit Rev Biotechnol. 2000. https ://doi.org/10.1080/07388 55000 89841 67.
16. Jahreis K, Bentler L, Bockmann J, Hans S, Meyer A, Siepelmeyer J, et al. Adaptation of sucrose metabolism in the Escherichia coli wild-type strain EC3132. J Bacteriol. 2002;184:5307–16.
17. Lee JW, Choi S, Park JH, Vickers CE, Nielsen LK, Lee SY. Develop-ment of sucrose-utilizing Escherichia coli K-12 strain by cloning β-fructofuranosidases and its application for l-threonine production. Appl Microbiol Biotechnol. 2010;88:905–13.
18. Shukla VB, Zhou S, Yomano LP, Shanmugam KT, Preston JF, Ingram LO. Production of l(−)-lactate from sucrose and molasses. Biotechnol Lett. 2004;26:689–93. https ://doi.org/10.1023/B:BILE.00000 24088 .36803 .4e. 19. Tsunekawa H, Azuma S, Okabe M, Okamoto R, Aiba S. Acquisition of
a sucrose utilization system in Escherichia coli K-12 derivatives and its application to industry. Appl Environ Microbiol. 1992;58:2081–8. 20. Bruschi M, Boyes SJ, Sugiarto H, Nielsen LK, Vickers CE. A transferable
sucrose utilization approach for non-sucrose-utilizing Escherichia coli
strains. Biotechnol Adv. 2012;30:1001–10.
21. Lee SY, Kim HU. Systems strategies for developing industrial microbial strains. Nat Biotechnol. 2015;33:1061–72.
•fast, convenient online submission
•
thorough peer review by experienced researchers in your field
• rapid publication on acceptance
• support for research data, including large and complex data types
•
gold Open Access which fosters wider collaboration and increased citations maximum visibility for your research: over 100M website views per year
•
At BMC, research is always in progress.
Learn more biomedcentral.com/submissions
Ready to submit your research? Choose BMC and benefit from:
23. Sandberg TE, Pedersen M, LaCroix RA, Ebrahim A, Bonde M, Herrgard MJ, et al. Evolution of Escherichia coli to 42 C and subsequent genetic engineering reveals adaptive mechanisms and novel mutations. Mol Biol Evol. 2014;31:2647–62.
24. St-Pierre F, Cui L, Priest DG, Endy D, Dodd IB, Shearwin KE. One-step clon-ing and chromosomal integration of DNA. ACS Synth Biol. 2013;2:537–41.
https ://doi.org/10.1021/sb400 021j.
25. Cui L, Shearwin KE. Clonetegration using OSIP plasmids: one-step DNA assembly and site-specific genomic integration in bacteria. 2017. p. 139–55. https ://doi.org/10.1007/978-1-4939-6343-0_11.
26. Phaneuf PV, Gosting D, Palsson BO, Feist AM. ALEdb 1.0: a database of mutations from adaptive laboratory evolution. bioRxiv. 2018;320747.
https ://doi.org/10.1101/32074 7v1.full.
27. Deatherage DE, Barrick JE. Identification of mutations in laboratory-evolved microbes from next-generation sequencing data using breseq. Methods Mol Biol. 2014;1151:165–88.
28. LaCroix RA, Palsson BO, Feist AM. A model for designing adaptive labora-tory evolution experiments. Appl Environ Microbiol. 2017. https ://doi. org/10.1128/aem.03115 -16.
29. Lee DH, Feist AM, Barrett CL, Palsson B. Cumulative number of cell divi-sions as a meaningful timescale for adaptive laboratory evolution of
Escherichia coli. PLoS ONE. 2011;6:e26172. https ://doi.org/10.1371/journ
al.pone.00261 72.
30. Ross W, Gosink K, Salomon J, Igarashi K, Zou C, Ishihama A, et al. A third recognition element in bacterial promoters: DNA binding by the subunit of RNA polymerase. Science. 1993;262:1407–13.
31. Simpson RB. The molecular topography of rna polymerase-promoter interaction. Cell. 1979;18:277–85.
32. Sandberg TE, Lloyd CJ, Palsson BO, Feist AM. Laboratory evolution to alternating substrate environments yields distinct phenotypic and genetic adaptive strategies. Appl Environ Microbiol. 2017. https ://doi. org/10.1128/aem.00410 -17.
33. Long CP, Gonzalez JE, Feist AM, Palsson BO, Antoniewicz MR. Fast growth phenotype of E. coli K-12 from adaptive laboratory evolution does not require intracellular flux rewiring. Metab Eng. 2017;44:100–7. https ://doi. org/10.1016/j.ymben .2017.09.012.
34. Conrad TM, Frazier M, Joyce AR, Cho B-K, Knight EM, Lewis NE, et al. RNA polymerase mutants found through adaptive evolution reprogram
Escherichia coli for optimal growth in minimal media. Proc Natl Acad Sci
USA. 2010;107:20500–5.
35. Mohamed ET, Wang S, Lennen RM, Herrgård MJ, Simmons BA, Singer SW, et al. Generation of a platform strain for ionic liquid tolerance using adaptive laboratory evolution. Microb Cell Fact. 2017;16:1–15. https ://doi. org/10.1186/s1293 4-017-0819-1.
36. Utrilla J, O’Brien EJ, Chen K, McCloskey D, Cheung J, Wang H, et al. Global rebalancing of cellular resources by pleiotropic point mutations illustrates a multi-scale mechanism of adaptive evolution. Cell Syst. 2016;2:260–71.
https ://doi.org/10.1016/j.cels.2016.04.003.
37. Jensen KF. The Escherichia coli K-12 “wild types” W3110 and MG1655 have an rph frameshift mutation that leads to pyrimidine starvation due to low pyrE expression levels. J Bacteriol. 1993;175:3401–7.
38. Norregaard-Madsen M, McFall E, Valentin-Hansen P. Organization and transcriptional regulation of the Escherichia coli K-12 d-serine tolerance locus. J Bacteriol. 1995;177:6456–61.
39. Finn RD, Coggill P, Eberhardt RY, Eddy SR, Mistry J, Mitchell AL, et al. The Pfam protein families database: towards a more sustainable future. Nucleic Acids Res. 2016;44:D279–85.
40. Arifin Y, Sabri S, Sugiarto H, Krömer JO, Vickers CE, Nielsen LK. Deletion of cscR in Escherichia coli W improves growth and poly-3-hydroxybutyrate (PHB) production from sucrose in fed batch culture. J Biotechnol. 2011;156:275–8.
41. Meeske AJ, Riley EP, Robins WP, Uehara T, Mekalanos JJ, Kahne D, et al. SEDS proteins are a widespread family of bacterial cell wall polymerases. Nature. 2016;537:634–8.
42. Cho H, Wivagg CN, Kapoor M, Barry Z, Rohs PDA, Suh H, et al. Bacterial cell wall biogenesis is mediated by SEDS and PBP polymerase families functioning semi-autonomously. Nat Microbiol. 2016;1:16172. 43. Ishino F, Park W, Tomioka S, Tamaki S, Takase I, Kunugita K, et al.
Pepti-doglycan synthetic activities in membranes of Escherichia coli caused by overproduction of penicillin-binding protein 2 and RodA protein. J Biol Chem. 1986;261:7024–31.
44. Deatherage DE, Kepner JL, Bennett AF, Lenski RE, Barrick JE. Specificity of genome evolution in experimental populations of Escherichia coli
evolved at different temperatures. Proc Natl Acad Sci. 2017;114:E1904–12. 45. Sperber AM, Herman JK. Metabolism shapes the cell. J Bacteriol.
2017;199:1–14.
46. Winkler JD, Garcia C, Olson M, Callaway E, Kao KC. Evolved osmotolerant escherichia coli mutants frequently exhibit defective N -acetylglucosa-mine catabolism and point mutations in cell shape-regulating protein MreB. Appl Environ Microbiol. 2014;80:3729–40.
47. Godshall MA, Legendre BL. SUGAR|Sugarcane. Encycl Food Sci Nutr. 2003;56:45–51.
48. Wang Z, Xiang L, Shao J, Wegrzyn A, Wegrzyn G. Effects of the presence of CoIE1 plasmid DNA in Escherichia coli on the host cell metabolism. Microb Cell Fact. 2006;5:1–18.
49. Conrad TM, Joyce AR, Applebee MK, Barrett CL, Xie B, Gao Y, et al. Whole-genome resequencing of Escherichia coli K-12 MG1655 undergoing short-term laboratory evolution in lactate minimal media reveals flexible selection of adaptive mutations. Genome Biol. 2009;10:R118.
50. Rugbjerg P, Feist AM, Sommer MOA. Enhanced metabolite productivity
of Escherichia coli adapted to glucose m9 minimal medium. Front Bioeng
Biotechnol. 2018;6:166. https ://doi.org/10.3389/fbioe .2018.00166 /full. 51. Arifin Y, Archer C, Lim SA, Quek LEE, Sugiarto H, Marcellin E, et al.
Escherichia coli W shows fast, highly oxidative sucrose metabolism and
low acetate formation. Appl Microbiol. 2014;98:9033–44. https ://doi. org/10.1007/s0025 3-014-5956-4.
Publisher’s Note