R E S E A R C H
Open Access
Epigenetic down-regulation of the
HIST1
locus predicts better prognosis in acute
myeloid leukemia with
NPM1
mutation
Sylvain Garciaz
1, Lia N
’
guyen Dasi
1, Pascal Finetti
2, Christine Chevalier
1,3, Julien Vernerey
1, Mathilde Poplineau
1,
Nadine Platet
1, Stéphane Audebert
4, Matthieu Pophillat
4, Luc Camoin
4, François Bertucci
2, Boris Calmels
1,5,
Christian Récher
6, Daniel Birnbaum
2, Christian Chabannon
1,5, Norbert Vey
7and Estelle Duprez
1*Abstract
Background:The epigenetic machinery is frequently altered in acute myeloid leukemia. Focusing on cytogenetically normal (CN) AML, we previously described an abnormal H3K27me3 enrichment covering 70 kb on theHIST1 cluster (6.p22) in CN-AML patient blasts. Here, we further investigate the molecular, functional, and prognosis significance of this epigenetic alteration named H3K27me3HIST1inNPM1-mutated (NPM1mut) CN-AML.
Results:We found that three quarter of theNPM1mut CN-AML patients were H3K27me3HIST1high. H3K27me3 HIST1high
group of patients was associated with a favorable outcome independently of known molecular risk factors. In gene expression profiling, the H3K27me3HIST1highmark was associated with lower expression of the histone genes HIST1H1D, HIST1H2BG, HIST1H2AE, and HIST1H3F and an upregulation of genes involved in myelomonocytic differentiation. Mass spectrometry analyses confirmed that the linker histone protein H1d, but not the other histone H1 subtypes, was downregulated in the H3K27me3HIST1high group of patients. H1d knockdown primed ATRA-mediated differentiation of OCI-AML3 and U937 AML cell lines, as assessed on CD11b/CD11c markers, morphological and gene expression analyses.
Conclusions:Our data suggest thatNPM1mut AML prognosis depends on the epigenetic silencing of theHIST1cluster and that, among the H3K27me3 silenced histone genes,HIST1H1Dplays a role in AML blast differentiation.
Keywords:Epigenetics, H3K27me3, Acute myeloid leukemia,HIST1,NPM1
Background
Acute myeloid leukemias (AMLs) are a heterogeneous group of severe hematological malignancies that arise through the acquisition of oncogenic mutations by hematopoietic progenitor cells. Patient prognosis mainly relies on the given treatment, the outcome of which de-pends on cytogenetics and molecular alterations. Cytoge-netically normal (CN) AML patients are usually assigned to an intermediate prognosis group that can be further subdivided through the detection of mutations in a growing number of genes [1]. Mutations in the nucleo-phosmin 1 (NPM1) gene are the commonest molecular
lesions occurring in ≥50% of cases with cytogenetically normal acute myeloid leukemia (CN-AML). NPM1 mutations result in the generation of a nuclear export signal causing the delocalization of the protein from the nucleoli to the cytoplasm [2]. Analyses of large numbers of patients have shown that NPM1 mutations are associated with a relatively favorable prognosis, which can be mitigated by internal tandem duplications (ITD) of the tyrosine kinase receptor Fms-like tyrosine kinase 3 (FLT3) and mutations in DNA-methyl transferase 3A (DNMT3A). Indeed, inNPM1mut CN-AML,FLT3ITD mutation, and/ or mutation in DNMT3A predict an increased risk of relapse and poorer outcome [3], [4]. Recent reports shed light on the importance of epigenetic deregulations that affect the epigenome and gene transcription in AML pathogenesis [5]. These deregulations are the
© The Author(s). 2019Open AccessThis article is distributed under the terms of the Creative Commons Attribution 4.0 International License (http://creativecommons.org/licenses/by/4.0/), which permits unrestricted use, distribution, and reproduction in any medium, provided you give appropriate credit to the original author(s) and the source, provide a link to the Creative Commons license, and indicate if changes were made. The Creative Commons Public Domain Dedication waiver (http://creativecommons.org/publicdomain/zero/1.0/) applies to the data made available in this article, unless otherwise stated.
* Correspondence:estelle.duprez@inserm.fr
1Epigenetic Factors in Normal and Malignant Hematopoiesis Team, Aix
Marseille University, CNRS, Inserm, Institut Paoli-Calmettes, CRCM, 27 Boulevard Lei Roure, 13273 Marseille Cedex 09, France
consequence of numerous alterations found in genes en-coding multiple classes of epigenetic proteins as DNA methylation and histone modification enzymes [6].
In addition to these mutations, recent reports under-lined the importance of histone genes themselves in can-cer onset. For example, the major histone cluster 1 (HIST1), encoding the vast majority of the redundant core and linker histones [7], has been found partially deleted in ALL [8] and deregulation of its expression is associated with breast cancer invasiveness [9]. Moreover, we previ-ously described a new alteration that affects the HIST1 cluster in AML. This alteration consists in a marked his-tone H3 lysine 27 tri-methylation (H3K27me3) enrich-ment encompassing 70 kb of theHIST1cluster, affecting histone genes and associates with the NPM1 mutation and a better leukemia-free survival [10]. In this study, we reported the clinical importance of this newly identified epigenetic alteration, called the H3K27me3 HIST1mark, in relation to other known mutations and its functional consequences on the biology of CN-AML leukemic cells. We revealed that H3K27me3 HIST1 status and histone mRNA and protein levels define clinically and biologically different subgroups of NPM1mut CN-AML suggesting their importance in AML pathogenesis.
Results
H3K27me3 level onHIST1locus is associated with better survival
To characterize the H3K27me3HIST1mark, we performed H3K27me3 ChIP-qPCR on samples obtained from 46 de novo CN-AML patients included in GOELAMS multicenter clinical trials LAM2006IR (NCT00860639) or LAM2007SA (NCT00590837). H3K27me3 level was determined at five
HIST1 genomic locations that are representative of the H3K27me3 HIST1 signature, as described previously [10]. Heatmap showing H3K27me3HIST1gene enrichment con-firmed the variation of H3K27me3HIST1level among CN-AML patients (Fig.1a). The average of the five normalized H3K27me3 HIST1 values was calculated and this index showed a clear segregation of the H3K27me3HIST1lowand H3K27me3 HIST1highpatients. With a cut-off value at 15, approximately 55% of CN-AML samples displayed an H3K27me3HIST1enrichment mark (Fig.1b).
There was no association of H3K27me3HIST1status with age, gender,FLT3ITD,DNMT3A,IDH1, or CCAAT/enhan-cer-binding protein alpha (CEBPA) mutations (Fig. 1a and Additional file 1: Table S1). However, we noted that 25/33 (75.7%) of the NPM1mut samples were also H3K27me3
HIST1high
(Fig.1a and Additional file1: Table S1) confirming our first observation [10]. In addition, we observed a signifi-cant association between H3K27me3 HIST1high and the presence of IDH2R140 mutation (36% vs. 4.7%, P= .01) (Fig.1a and Additional file1: Table S1).
H3K27me3HIST1highpatients had a better overall sur-vival (OS) and event-free sursur-vival (EFS) than H3K27me3
HIST1lowpatients, with a median OS of 50.9 months ver-sus 14.6 months (HR, 2.5 [1.5–5.5];P= .02) and a median EFS of 37 months versus 9 months (HR, 2.7 [1.3–5.8];
P= .008) (Fig. 1c). The survival gain was independent in multivariate analyses taking age and NPM1wt/FLT3ITD status into account (Additional file1: Table S2). These ob-servations confirmed in an independent cohort the previ-ously reported association of H3K27me3HIST1highwith a better prognosis [10].
H3K27me3 level onHIST1locus is an independent biomarker predicting survival of NPM1mut CN-AML NPM1-mutated AMLs represent a distinct clinical and bio-logical entity in the World Health Organization (WHO) clas-sification, commonly associated with a better prognosis [3]. We used the biological material obtained from 25NPM1mut samples previously analyzed [10], and 78 samples either pro-vided by the GOELAMSTHEQUE (n= 33), or the IPC/ CRCM tumor bank (n= 45) (Fig. 2a). H3K27me3 status of the 78 new samples was analyzed (Additional file 2: Figure S1) and revealed that 75% of NPM1mut CN-AMLs were H3K27me3HIST1high. TheNPM1mut H3K27me3HIST1high subgroup of patients was not enriched with DNMT3A or
FLT3ITD mutations, the most frequently NPM1mut co-occurring alterations [11] (Table1and Additional file2: Fig-ure S1), but IDH2R140 was significantly overrepresented in this subgroup in comparison with the NPM1mut H3K27me3 HIST1low group (27.6% vs. 7.6%,P= .05). Inter-estingly, H3K27me3 HIST1highleukemic cells had a signifi-cantly lower CD34 expression than their H3K27me3
HIST1low
counterparts (CD34 mean expression, 10.3% vs. 35%,P= 0.005) (Table1). To further explore a potential as-sociation between CD34 expression and the presence of H3K27me3 HIST1 mark, we selected four patient samples (two in each H3K27me3 HIST1 group), containing both CD34low and CD34high blast populations. We next ana-lyzed the H3K27me3 HIST1 level in CD34low and CD34high fluorescence-activated cell sorted (FACS) blasts. As shown in Fig. 2b and Additional file 2: Figure S2, H3K27me3HIST1status (high or low), in both CD34lowand CD34highblast fractions, was similar to the bulk population, indicating that H3K27me3 HIST1high occurs independently of CD34 level of expression.
Next, we analyzed the prognosis impact of the H3K27me3
HIST1alteration.NPM1mut H3K27me3HIST1highpatients had a better OS and EFS thanNPM1mut H3K27me3
significance of the H3K27me3HIST1signature is independ-ent of other known molecular alterations (Table2).
Finally, we studied the impact of H3K27me3HIST1mark in theNPM1mut/FLT3wt subgroup, which is classically as-sociated with a favorable prognosis [12]. H3K27me3
HIST1high
patients (n= 36) displayed better OS and EFS than H3K27me HIST1low patients (n= 17), (median OS, 111.6 months vs. 23.2 months; P= .03; median EFS, 44.1 months vs. 13.9 months; P= .01, for H3K27me3
HIST1high
and H3K27me3HIST1low, respectively) (Fig.2d). Our results suggest that H3K27me3HIST1status is an independent epigenetic marker that identifies patients with a poor outcome within theNPM1/FLT3wt group of patients.
Histone mRNA expression is anti-correlated to H3K27me3
HIST1level and predictsNPM1mut CN-AML patient
outcome
To analyze the anti-correlation of histone mRNA level and the presence of the repressive H3K27me3 mark, we selected three histone genes; HIST1H1D, HIST1H2BG and HIST1H2BH, spread over the H3K27me3 HIST1 islet and associated with clinical outcome in public data (see below), and measured their mRNA levels. Expres-sion of these three genes was lower in H3K27me3
HIST1high
patients (n= 34) than in H3K27me3HIST1low patients (n= 13) (Fig.3a).
We next asked whether expression of these genes, as a consequence of H3K27me3 mark, was associated with patient survival. Given the small size of our cohort, we analyzed HIST1 gene expression in two published co-horts with publicly accessible clinical and mRNA expres-sion data: TCGA [13] and Metzeler [14].NPM1mut CN-AML patients, within these two cohorts, were identified by using a published gene expression signature that pre-dicts the NPM1 mutational status [15] (see Add-itional file 3: Supplemental methods). Association of histone expression with survival was first tested for each of the 11 histone genes covered by the H3K27me3
HIST1 mark. This highlighted three histone genes,
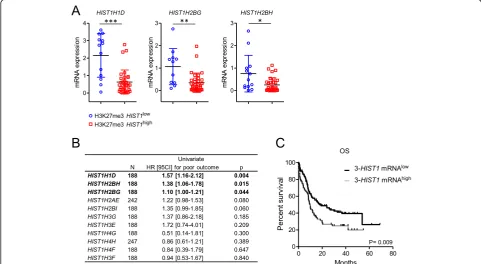
HIST1H1D, HIST1H2BG, and HIST1H2BH, for which a high level of expression was associated with a poor outcome (P= .004, .015 and .044 respectively, Fig. 3b). Then, we tested this 3-HIST1-mRNA signature in univariate analysis; 3-HIST1-mRNAlow patients had a favorable OS with a median OS of 17.7 months ver-sus 9.6 months (HR = 1.66, range, 1.13–2.42, P= .009) (Fig.3c). Multivariate analyses showed that the 3-HIST1 -mRNAlow status was associated with a better prognosis (HR = 1.60, range 1.60–2.31, P= .01), independently of
Fig. 1Analysis of H3K27me3HIST1level in CN-AML patients.aHeatmap of normalized H3K27me3 enrichment value obtained by H3K27me3 ChIP-qPCR on the indicatedHIST1genes. Enrichment was calculated as the percentage of bound/input and double normalized withHOXD4and
GAPDH. Each column represents a patient sample (n= 46) sorted by unsupervised hierarchical clustering. The separation between H3K27me3
HIST1lowand H3K27me3HIST1highgroups is indicated by a dotted lane. Yellow square: mutation for the indicated gene.bBimodal distribution of
the patients according to H3K27me3HIST1mean level, obtained from the H3K27me3 enrichment values of the 5HIST1regions analyzed. In blue, patients with an H3K27me3HIST1mean value below 15 (H3K27me3HIST1low,n= 21), in red, patients with a mean value above 15 (H3K27me3
other prognosis markers including age, FAB classification andFLT3status (Additional file1: Table S3).
These results show that H3K27me3HIST1highis asso-ciated with a lower expression of histone genes, and that 3-HIST1-mRNAlow signature defines a NPM1mut AML patient group with a better outcome.
Gene expression profiling associated with H3K27me3
HIST1high
identifies a“mature like”phenotype
We next characterized the gene expression profile (GEP) of H3K27me3 HIST1high samples (n= 16) in comparison
to H3K27me3HIST1lowsamples (n= 11) from the IPC co-hort (see Additional File 1: Table S4 for patient clinical characteristics). Eighty-one genes were differentially expressed (p< .05, fold-change > 1.5) between the two groups, 58 being up- and 23 being downregulated in the H3K27me HIST1highgroup (Fig.4a and Additional file4: Table S5). Analysis of enhancer of zeste homolog 2 (EZH2) and suppressor of zeste 12 (SUZ12) expres-sion revealed that the two groups, H3K27me3
HIST1high
and H3K27me3 HIST1low, equally expressed PRC2 components (Fig. 4b). GSEA
Table 1Clinical and molecular characteristics according to H3K27me3HIST1level in theNPM1mut AML cohort
Characteristics All patients (n= 103) H3K27me3HIST1low(n= 28) H3K27me3HIST1high(n= 75) P
Age, years 0.42
Median 61 62 60
Range 22–76 37–76 22–76
Sex, % 1.0
Male 43 42.8 44
WBC, × 10e9/L 67 87.9 55.6 0.57
Median 67 87.9 55.6
Range 10–352 10–352 11–230
Complete response, % 94 88.4 96.0 0.18 Allo-HSCT in 1st CR, % 23 32.1 20.0 0.2
FAB classification,% 1.0
0–2 51.8 50.0 52.6
4–5 48.2 50.0 47.4
CD34 expressiona 0.005
Mean 15.3 35.0 10.3
Range 0–99 12–99 0–93 Molecular alterations, %
FLT3ITD 47.0 37.0 50.6 0.36
DNMT3Ab 50.5 57.6 43.1 0.25
FLT3ITD/DNMT3Ab 23.1 23.1 23.1 1.0
IDH2(R140)b 21.9 7.6 27.6 0.05
IDH1(R132)b 12.1 15.3 10.7 0.72
CEBPAb 5.4 7.6 4.6 0.62
ASXL1b 3.2 3.8 3.1 1.0
Allo HSCTallogenic stem-cell transplantation,CRcomplete response,WBCwhite blood cell aN
= 72 bN
= 91
(See figure on previous page.)
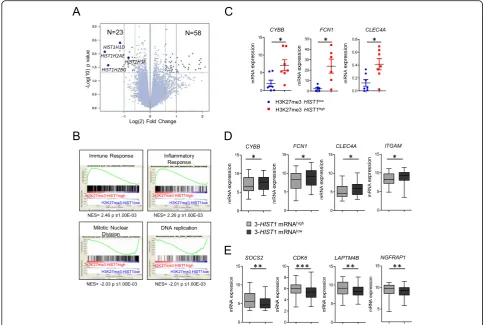
identified, in H3K27me3 HIST1high patients, genes associated with myelomonocytic differentiation such as immune or inflammatory responses (Fig. 4c and Additional file 4: Table S5). Downregulated genes in these patients belong to cell cycle and chromatin regulation categories, including histone genes from the HIST1 cluster (Fig. 4c and Additional file 4: Table S5). Using qPCR, we confirmed higher expres-sion of three genes involved, in mature granulocyte functions, CYBB, FCN1, and CLEC4A [16], [17], [18] in H3K27me3 HIST1high patients (Fig. 4d). H3K27me3 level at the promoter of these genes was
identical between H3K27me3 HIST1low and H3K27me3 HIST1high patients (Additional file 2: Fig-ure S3) suggesting that the variation of expression was indirectly affected by H3K27me3 HIST1high.
To further validate the relation between low mRNA level of HIST1 genes and the expression of granulocytic markers, we tested mRNA expression of myelomonocy-tic maturation genes (CYBB, FCN1, CLEC4, and
ITGAM) in the TCGA and Metzeler cohorts of patients stratified with the previously defined 3-HIST1-mRNA signature. The 3-HIST1-mRNAlowpatient group overex-pressed the differentiation genes in comparison to the
3-HIST1-mRNAhigh one (Fig. 4e), thus corroborating our previous observation (Fig. 4d). Reciprocally, genes such as SOCS2, CDK6, LAPTM4B, and NGFRAP1, which were described as associated with a leukemic stem cell signature [19], were less expressed in the 3-HIST1 -mRNAlowpatient group (Fig.4f).
Taken together, these results suggest that HIST1 mRNA downregulation by the H3K27me3 HIST1high mark is associated with a more differentiated phenotype related to a committed state of leukemic cells.
Table 2Multivariate analyses for H3K27me3HIST1status
Event-free survival Multivariate analysis
Variables HR 95% CI P H3K27me3HIST1high 1.76 1.04–2.99 0.036
Age > 60 years 0.60 0.36–0.99 0.044
FLT3ITD/DNMT3mut 0.48 0.27–0.83 0.009
Fig. 3Gene expression from theHIST1cluster impacts on survival inNPM1mut CN-AML.amRNA analyses ofHIST1genes in the IPC cohort of
NPM1mut CN-AML patients.HIST1H1D(n= 46),HIST1H2BH(n= 45), andHIST1H2BG(n= 47) mRNA levels were determined by Taqman, according to H3K27me3HIST1status. Gene expression was normalized on the average of two housekeeping genes (PGK1andPPIA). Statistical significance was estimated using Mann Whitney test *p< 0.05; **p< 0.005 ***p< 0.0001.bInfluence of histone gene expression on OS by univariate analysis. Only histone genes covered by the H3K27me3HIST1mark described in [10] were analyzed.cSurvival analyzed according to the expression of
The histone linker H1-3 is poorly expressed in H3K27me3
HIST1high
CN-AML patients
To study the role of histones on AML clinical and bio-logical features, we looked at the effect of H3K27me3
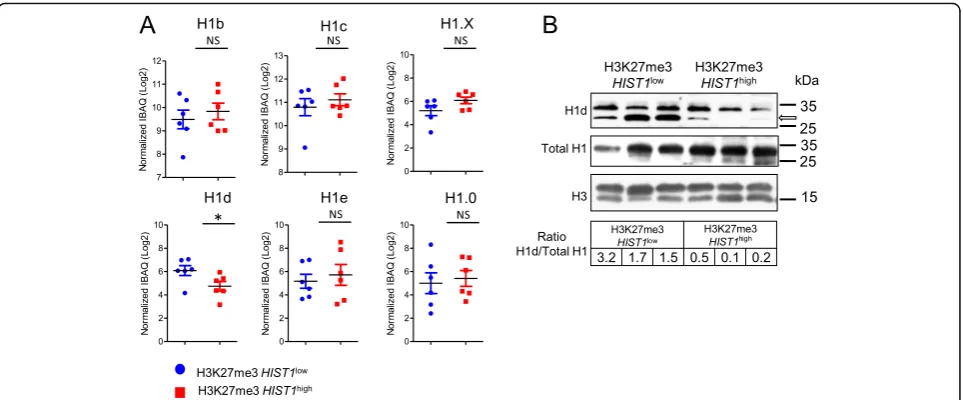
HIST1 epigenetic silencing on histone protein level. First, we looked at the proportions of total histones and of each histone subtype (Additional file 2: Figure S4) in chromatin-bound fractions extracted from a series of 12 patient samples (six in each group) using intensity-based absolute quantification (iBAQ) approach. Normalized quantities of total linker histone H1 and core histones H2A, H2B, H3, and H4 were similar in both H3K27me3
HIST1high
and H3K27me3HIST1lowpatients (Additional file 2: Figure S5), suggesting that H3K27me3 HIST1high status did not globally modify histone protein abun-dance. Then, we decided to analyze specifically the his-tone linker H1-3, encoded by HIST1H1D, because its
mRNA level is affected by H3K27me3 HIST1 status (Fig. 3a) and it is the leading gene for the mRNA signa-ture (Fig. 3b). In addition, contrary to other histone subtypes (i.e., H2A, H2B, H3, and H4), H1 histone subtypes are heterogeneous in amino acid compos-ition [20], which probably reflects a subtype-specific function. Indeed, when looking at the H1 subtype abundance, we observed that the H1-3 subtype was decreased in the H3K27me3 HIST1high group (nor-malized iBAQ value (Log2) = 6.09 vs 4.74; P= .04), whereas the other H1 subtypes, H1-5, H1-2, H1-4, H1-F0, and H1-FX, were unaffected (Fig. 5a). These results are consistent with the specific HIST1H1D mRNA expression decrease observed in AML samples harboring the H3K27me3 HIST1 mark. We confirmed the lower expression of H1-3 observed in H3K27me3
HIST1high
group in comparison to H3K27me3
Fig. 4H3K27me3HIST1highis associated with a myelomonocytic Gene Expression Profile.aVolcano plot displaying differentially expressed genes
between H3K27me3HIST1high(n= 16) and H3K27me3HIST1lowpatients (n= 11). The blue dots represent the histone genes covered by the
H3K27me3 mark.bEZH2andSUZ12levels of expression obtained from our micro array data were analyzed in H3K27me3HIST1low(n= 11) and
H3K27me3HIST1high(n= 16) patients.cGSEA (gene set enrichment analysis) of H3K27me3HIST1highsamples.dExpression of three genes
associated with granulocytic functions according to H3K27me3HIST1status.CYBB(cytochrome B-245 beta chain);FCN1(Ficolin 1);CLEC4A(C-type lectin domain family 4 member A). Data are represented in relative expression toHPRT.e–fPatients from TGCA and GSE 61804 cohorts were separated according to the 3-HIST1mRNA signature in mRNAlow(n= 114) and mRNAhigh(n= 79) patients.eMyelomonocyticCYBB,FCN1,CLEC4A,
HIST1low
group of patients by Western blot using pan H1 and specific H1-3 antibodies (Fig. 5b).
In conclusion, as a consequence of the presence of an H3K27me3 islet, NPM1mut CN-AML H3K27me3
HIST1high
patients express low level of H1-3.
H1-3 knockdown confers a more mature phenotype in AML cell lines
We hypothesized that the better prognosis of H1-3 low AML may be related to a gain of differentiation and a loss of stem cell features of the AML blasts. Thus, we tested the consequences of H1-3 knockdown (KD) on differentiation potential of the NPM1-mutated OCI-AML3 cell line, which also harbor the DNMT3AR882C mutation [21]. Efficiency and specificity of our KD were assessed by testing mRNA levels of the different H1 sub-types (Fig.6a and Additional file2: Figure S6a and S6b) and by measuring H1-3 protein level, after H1-3 KD in-duction (Fig. 6b and Additional file 2: Figure S6c and S6d). Consequences of H1-3 KD on differentiation were evaluated upon all-trans retinoic acid (ATRA)-treatment. Albeit no increase in CD11b was observed upon H1-3 KD alone, addition of ATRA (0.5 μM and 1 μM) in-duced a significant increase in CD11b expression, with a marked increase at 0.5 μM (22.6 ± 2.5% vs. 41 ± 4.3%;
P= .008) (Fig. 6c and Additional file 2: Figure S7a and S7b) and a significant increase in the proportion of the double positive CD11b/CD11c population (29.8 ± 1.3% vs. 42.5 ± 2.1%; P= .003) (Fig.6d). In addition, morpho-logical and quantification analyses showed that cytoplas-mic granules, which reflect the beginning of a maturation process appeared upon H1-3 KD after 96 h
of ATRA-treatment (0.5 μM), (Fig. 6e, f and Additional file2: Figure S8). Finally, mRNA expression levels of two ATRA-induced genes,CYBBand ITGAM, were tested in H1-3 KD condition under ATRA-treatment; H1-3 downregulation increased the amplitude of ATRA-induced upregulation of these two genes (Fig. 6g). To test whether this ATRA-sensitization was dependent of the presence of NPM1mut or DNMT3AR882C, we per-formed H1-3 KD in theNPM1wt andDNMT3Awt mye-loid U937 cell line. Interestingly, H1-3 KD increased the proportion of the double positive CD11b/CD11c in 0.1 μM ATRA-treated U937 cells and induced morpho-logical changes (Fig. 6h). Altogether, these results sug-gest that downregulation of histone H1-3 induces ATRA-sensitization independently of NPM1 and
DNMT3Amutations.
Discussion
Aberrant epigenetic patterns in leukemia have been de-scribed but determination of their importance in leukemia onset and progression is still lacking [22]. We have studied here the clinical and biological conse-quences of an epigenetic alteration of the HIST1 locus, the H3K27me3 HIST1 signature, which we previously described in CN-AML [10]. We first confirmed the pres-ence of H3K27me3 HIST1high on 55% of CN-AML and 75% of NPM1mut AML in an independent CN-AML cohort. H3K27me3 HIST1high impacts on the survival of CN-AML and NPM1mut CN-AML patients, and confers a better survival independently of other mo-lecular markers. While H3K27me3 HIST1high is not as-sociated with FLT3ITD or DNMT3A mutations,
Fig. 5H1-3 protein expression is lower in H3K27me3HIST1highpatients.aAbundance of histone H1 subtypes. Results of each H1 subtype are
IDH2R140Q is overrepresented in H3K27me3HIST1high patients (28% vs 7.6%); this is consistent with data highlighting the functional relationship between
IDH2R140Q mutant expression and histone hyperme-thylation [23]. Although we do not know the mecha-nisms underlying the H3K27me3 HIST1high signature, this focal high level of H3K27me3 may reflect a main-tained activity of EZH2 previously shown to be associ-ated with favorable outcome in AML [24]. Our data provide the first evidence that detecting an aberrant epi-genetic pattern in addition to gene mutations has clinical interest and could guide therapeutic choices.
Detection of our epigenetic biomarker in AML dem-onstrates that H3K27me3 HIST1high status is invariably associated with a favorable outcome and may reveal a less aggressive disease. The less aggressive form of AML associated with H3K27me3HIST1highis supported by its anti-correlated stem cell signature, shown to be associ-ated with an adverse prognosis [19]. It is also supported by its inflammatory and immune function signature, which has been associated with a better clinical response to dexamethasone in NPM1 CN-AML [25]. However, al-though CD34low AMLs, characterized by a leukemic stem cell arrested at a precursor-like stage [26], are enriched in the H3K27me3 HIST1high group, we could not find H3K27me3 HIST1high exclusively on CD34low blasts. This suggests that H3K27me3HIST1highmarks a more mature leukemia independently of the level of CD34 expression.
The main consequence of the H3K27me3 accumula-tion at the HIST1 locus may be the downregulation of the histone genes affected by the repressive epigenetic mark. Levels of replication-dependent histone gene ex-pression may reflect aggressiveness of the disease and may have a survival impact. Indeed, the major histone gene cluster has been described as one of the most upregulated across breast cancer progression [9]. Our
study highlighted a peculiar pattern of a lower histone gene expression and defined a three-HIST1 mRNA sig-nature, containing three histone genes (HIST1H1D,
HIST1H2BH, andHIST1H2BG) that are directly affected by the H3K27me3 enrichment and can predict survival on CN-AML patients. Interestingly, one of the most af-fected histone genes in our AML data encodes the his-tone linker H1-3. High level of H1.3 has been previously linked to cancer aggressiveness, as its overexpression is associated with malignant ovarian adenocarcinoma [27] and with a poor pancreatic ductal adenocarcinoma sur-vival [28]. Given its tight link with differentiation block-age in cancer cells [29] and given that H1 subtype individual KDs induce changes, notably in genes in-volved in cell cycle and chromatin regulation [30], dim-inution of H1.3 level appears to be a valid effector of the less aggressive H3K27me3 HIST1highAML phenotype. If histone linker H1 subtypes have a well-described redun-dant roles in maintaining nucleosome architecture and regulating transcription [31], it becomes evident that H1 subtypes have also subtype-specific functions reflected by selective genomic binding and regulation of chroma-tin organization [20, 32]. H1 subtypes would influence chromatin compaction at definite loci affecting specific gene expression in a tissue specific manner. Thus, it is tempting to speculate that in our H3K27me3 HIST1high model, low H1-3 level would influence the differenti-ation state of the cells due to a specific change in chromatin targeting. In our cellular models, KD of H1-3 does not induce differentiation but sensitizes the cells to ATRA-treatment. Interestingly, this sensitivity is inde-pendent of DNMT3A activity, as the two cell line models (OCI-AML3 DNMT3Amut and U937 DNMT3Awt) are both sensitive to ATRA-treatment after H1-3 KD. In the light of previous reports, which documented an interaction between H1 proteins and DNMT3B [33,34], one possibility is that DNMT3B, although not found mutated in AML,
(See figure on previous page.)
may be an influential epigenetic partner in AML and in ATRA sensitivity together with H1-3.
ATRA is successfully used for the treatment of acute promyelocytic leukemia (APL) by inducing terminal granulocytic differentiation of APL blasts [35]. To a lesser extent, ATRA can also induce differentiation in non-APL cells, in particular in AML with IDH1/IDH2 mutations [36] or induce cell death in NPM1mut AML when used in combination with Arsenic trioxide [37], [38]. Interestingly, ATRA sensitization of non-APL cells has been induced by targeting epigenetic enzymes: inhib-ition of histone deacetylase (HDAC) with valproic acid [39] or inhibition of the histone demethylase LSD1/ KDM1A [40] or by targeting SUMOylation [41]. In the same line, our study suggests that epigenetic modifica-tions induced by H1-3 targeting could prime AML cells toward differentiation, revealed by ATRA-sensitivity, which may explains the more mature phenotype found in H3K27me3 HIST1high leukemia and suggests that ATRA could be an efficient differentiating agent in AML with low H1-3 expression.
Conclusions
We showed that epigenetic silencing of a part of the
HIST1locus by the H3K27me3 mark is associated with a better outcome and a mature gene expression profile in
NPM1mut CN-AML and we observed an important role of histone linker H1-3 expression in AML blast cell dif-ferentiation. Our study pinpoints the H3K27me3HIST1 mark andHIST1H1Dgene as two biomarkers potentially useful to stratify patient prognosis and defines targets that can be considered when developing epidrugs.
Methods Patient samples
Blast cells were separated from blood or marrow sam-ples through density-gradient (ficoll) separation, and stored in liquid nitrogen. Cryopreserved samples, with at least 70% of blasts, were collected from AML samples stored at Institut Paoli-Calmettes (IPC) Tumor Bank or at the Groupe Ouest Est d’Etude des Leucémies Aiguës et autres Maladies du Sang repository (GOELAMSTHE-QUE). GOELAMS samples were extracted from multi-center clinical trials LAM2006IR (NCT00860639) or LAM2007SA (NCT00590837). All patients received con-ventional induction chemotherapy consisting in daunor-ubicine (DNR) and aracytine (ARAC) with or without Mylotarg in the LAM2006IR trial for patients < 60 years [42] and idarubicine (IDA) and ARAC with or without lomustine in the LAM2007SA trial for patients≥60 years [43]. Informed consent was provided by all patients ac-cording to the Declaration of Helsinki and subjected to ethical institutional review board approval.
ChIP-qPCR
Chromatin immunoprecipitation (ChIP) was performed as previously described [10]. Briefly, frozen samples were thawed, washed twice in phosphate-buffered saline (PBS), and chromatin was extracted with TRIS buffer pH 8, 0.25% Triton. Samples were sonicated to obtain DNA fragments of 300–600 base pair (Bioruptor PICO) and chromatin was immunoprecipated with an anti-H3K27me3 antibody (Abcam #6002). After immunopre-cipitation, DNA was purified with the I-Pure kit (Diage-node). Quantification of ChIPed DNA was performed by real-time PCR using the SsoADV Univer SYBR Green Supermix (Bio-Rad) and detected with a CFX96 Real-Time PCR Detection System (Bio-Rad). IgG control
“cycle over the threshold” Ct values were subtracted to input or IP Ct values and converted into bound value by 2(−(IP Ct or input Ct- IgG IP Ct)). Data are expressed as per-cent of bound/input. For eachHIST1region, H3K27me3 ChIP signal was double normalized with ChIP signal ob-tained at a genomic location invariably enriched with H3K27me3 (HOXD4) and a genomic region depleted of H3K27me3 (GAPDH). Heatmaps were performed with gene-e software (Broad institute). Hierarchical clustering was done using Euclidian distance.
Histone gene nomenclature
The large HIST1 gene cluster on human chromosome region 6p22 is 2.1 Mb which contains 55 histone genes. Five genes (HIST1H1A-E) encode the canonical somatic histone linkers H1 (H1-1, H1-5, H1-2, H1-3, H1-4 re-spectively) while sets of 10–20 genes encode each of the core histone proteins (H2A, H2B, H3, and H4). Each of these genes is translated into a unique mRNA with dis-tinct 5′ and 3′ extremities, as well as slight nucleotide changes in the coding region.
RT-qPCR analysis
Hs00271187_s1; HIST1H2BG: Hs00374317_s1; HIST1
H2BH: Hs00374322_s1; PGK1: Hs00943178_g1; PPIA: Hs04194521_s1 (Thermo Fisher). Relative expression levels were determined by the delta Ct method, taking the mean expression level of PKG1 and PPIA for normalization [44].
Gene expression profiling
RNA expression profiling of NPM1mut CN-AML was done with Affymetrix Human gene ST 2.0 and Human Genome U133 Plus 2.0 DNA microarrays (see Supple-mental data). Microarray data are accessible under the accession number E-MTAB-6997.
Protein analysis
Cellular fractionation was done with the subcellular pro-tein fractionation kit (Thermofisher). Mass spectrometry procedures are explained in supplemental data. Immu-noblots were done as previously described [45]. Anti-bodies used were anti-Histone H1.3 (Abcam, ab24174, 1/750), anti-H1 (Active Motif, #39707, 1/2000), and anti-H3 (Active Motif, #39163, 1/10000).
Flow cytometry
Flow cytometry analyses were done using a BD-LSRII cytometer and analyzed using BD-DIVA Version 6.1.2 software (BD Biosciences). Antibodies used were PE (Mac-1), 3:100, Beckman Coulter; CD11B-APC (M1/70), 1:500, eBioscience; CD11C-PeCy7 (BU-15), 3:100, Beckman Coulter; DRAQ7™, 1:400; Biostatus, CD34-PeCy7 (#343516) 1:33, Biolegend.
Cell culture, shRNA lentiviral infection, stable H1-3 knockdown, and treatments
The OCI-AML3 and U937 cells were grown in minimum essential medium alpha (MEMα) supplemented with 20% fetal bovine serum or Roswell Park Memorial Institute (RPMI) medium supplemented with 10% fetal bovine serum respectively. H1-3 knockdown (KD) was achieved using doxycycline-induced Dharmacon™SMARTvector™ short hairpin RNA (V3SH7669-229784413, shRNA-1 and V3SH7669-228676834, shRNA-2). A non-silencing shRNA (piSMART VSC10730) was used as a control (shCtrl). Cells containing the SMARTvector™were sorted using an ARIAIII cytometer based on red fluorescent protein (RFP) expression and selected on puromycin (2μg/mL). KD of H1-3 was ob-tained by the addition of doxycycline (2 μg/mL) during 5– 7 days. All-trans-retinoic acid (ATRA; Sigma) was dissolved in dimethylsulfoxyde (DMSO) at 10 mM.
Statistical analyses
Statistical analyses were done using R software (ver-sion 2.15.2) (The Comprehensive R Archive Network.
http://www.cran.r-project.org/) and Graph Pad Prism
(Graph Pad Software, San Diego, CA, USA) and the significance of the differences between groups was de-termined via unpaired T test, Mann–Whitney test, or exact Fisher test. Data were presented as the me-dian ± SEM. Overall survival (OS) and event-free sur-vival (EFS) were calculated from the date of diagnosis to the date of death or to the date of relapse, death or the time to no response to intensive induction, re-spectively. Follow-up was measured from the date of diagnosis to the date of last news for living patients. Survivals were calculated using the Kaplan–Meier method and were compared with the log-rank test. Uni- and multivariate survival analyses were done using Cox regression analysis (Wald test). Variables with a p value < 0.05 were tested in multivariate ana-lysis. All statistical tests were two-sided at the 5% level of significance, except when indicated otherwise.
Supplementary information
The online version of this article (https://doi.org/10.1186/s13148-019-0738-6) contains supplementary material, which is available to authorized users.
Additional file 1.Table S1. Clinical and molecular characteristics in the GOELAMS Cohort (n= 46) according to H3K27me3HIST1status. Table S2. Multivariate analyses in the validation CN-AML cohort (n = 46). Table S3. Univariate and Multivariate Analyses for 3-HIST1-mRNA signature in TCGA and Metzeler cohorts. Table S4. Clinical characteristics ofNPM1mut pa-tients selected for transcriptomic analysis.
Additional file 2.Figure S1. Related to Fig.2: Heatmap of the H3K27me3 level in a new cohort of 78NPM1mut CN-AML patients. Figure S2. Related to Fig.2: Analysis of H3K27me3HIST1status in CD34low and CD34high sorted blasts. Figure S3 Related to Fig.4. Representative Inte-grative Genomics Viewer (IGV) tracks of H3K27me3 signal obtained from ChIP-chip data published in Tiberiet al., 2015 Figure S4. Related to Fig.5: Histone protein extraction inNPM1mut patients. Figure S5. Related to Fig.
5:Total protein abundance of each histone types determined by IBAQ label-free quantification method. Figure S6 related to Fig.6. Effect of H1-3 KD on histone H1 subtype mRNA and protein expression. Figure S7 re-lated to Fig.6. Effect of H1d KD on CD11b expression in shRNA1 (clones KD#2 and KD#3) and in shRNA2 conditions. Figure S7 related to Figure 6. Effect of H1d KD on CD11b expression in shRNA1 (clones KD#2 and KD#3) and in shRNA2 conditions
Additional file 3.Supplemental Methods
Additional file 4.Table S5. GES 81 g, LAM HIST1 16‘high (1)’vs. 11‘low (0)’
Abbreviations
APL:Acute promyelocytic leukemia; ARAC: Aracytine; ATRA: All-trans retinoic acid; CEBPA: CCAAT/enhancer-binding protein alpha; ChIP: Chromatin immunoprecipitation; CN-AML: Cytogenetically normal acute myeloid leukemia; DMSO: Dimethylsulfoxyde; DNMT3A: DNA-methyl transferase 3A; DNR: Daunorubicine; EFS: Event-free survival; EZH2: Enhancer of zeste homolog 2; FACS: Fluorescence Activated Cell Sorting; FLT3: Fms-like tyrosine kinase 3; H3K27me3: Histone H3 Lysine 27 tri-methylation; HIST1: Histone cluster 1; HR: Hazard ratio; IDA: Idarubicine; IDH: Isocitrate dehydrogenase; ITD: Internal tandem duplications; KD: Knock down; KDM1/LSD1: Lysine specific demethylase 1; MEMα: Minimum essential medium alpha;
NPM1: Nucleophosmin 1; OS: Overall survival; PBS: Phosphate-buffered saline; RFP: Red fluorescent protein; RPMI: Roswell Park Memorial Institute medium; SUZ12: Suppressor of zeste 12
Acknowledgments
data, the Biopathology Department at IPC for support with MGG coloration, and the TrGET platform for cell culture advices. The authors are grateful to Jihane Pakradouni Demestre for helping with collecting patient data.
Availability of the data and materials
The datasets generated and analyzed during the current study are available on reasonable request. In addition, the Microarray data are accessible under the accession number E-MTAB-6997.
Authors’contributions
SG and LN designed and performed the research and analyzed the data; PF, BC, DB, and FB provided and analyzed microarray data; CC and JV performed the research and analyzed the data; MP and NP contributed to experimental data. SA and MP performed and analyzed proteomic data. CR characterized and provided patient samples. DB contributed to the design and analysis of the study. CC and NV provided clinical data, and reviewed the manuscript. ED supervised the study, contributed to the design, and analysis of the study. SG and ED wrote the manuscript. All authors read and approved the final manuscript.
Funding
This study was supported by the Institut National de la Santé et de la Recherche Médicale, the Centre National de la Recherche Scientifique, Inserm-Transfert to E.D. and J.V., Institut Thématique Multi-Organisme-cancer (P036560) to E.D. and L.NG., l’Institut National du Cancer (20141PLBIO06–1 to E.D. and M.Popl.), SIRIC grant INCa-DGOS-Inserm 6038 to N.V., E.D. and C.Che) and Groupement des Entreprises Françaises dans la Lutte contre le Cancer (GEFLUC) to E.D. S.G. was supported by the Fondation pour la Recherche Médicale (FFDM20160640830).
Ethics approval and consent to participate
Informed consent was provided by all patients according to the Declaration of Helsinki and subjected to ethical institutional review board approval.
Consent for publication Not applicable.
Competing interests
The authors declare that they have no competing interests.
Author details
1
Epigenetic Factors in Normal and Malignant Hematopoiesis Team, Aix Marseille University, CNRS, Inserm, Institut Paoli-Calmettes, CRCM, 27 Boulevard Lei Roure, 13273 Marseille Cedex 09, France.2Predictive Oncology Laboratory, CRCM, Inserm, U1068, CNRS UMR7258, Institut Paoli-Calmettes, Aix-Marseille University, Marseille, France.3Institut Pasteur, G5 Chromatin and Infection, Paris, France.4Aix-Marseille University, Inserm, CNRS, Institut
Paoli-Calmettes, CRCM, Marseille Protéomique, Marseille, France.
5Aix-Marseille University, Inserm, CNRS, Institut Paoli-Calmettes, CRCM, Centre
d’Investigations Cliniques en Biothérapies, Marseille, France.6Service d’Hématologie, Centre Hospitalier Universitaire de Toulouse, Institut Universitaire du Cancer de Toulouse Oncopole, Toulouse, France Université Toulouse III Paul Sabatier, Cancer Research Center of Toulouse,
UMR1037-INSERM, ERL5294 CNRS, Toulouse, France.7Aix-Marseille University, Inserm, CNRS, Institut Paoli-Calmettes, CRCM, Marseille, France.
Received: 23 July 2019 Accepted: 5 September 2019
References
1. Grimwade D, Ivey A, Huntly BJ. Molecular landscape of acute myeloid leukemia in younger adults and its clinical relevance. Blood. 2016;127:29–41. 2. Falini B, Mecucci C, Tiacci E, et al. Cytoplasmic nucleophosmin in acute
myelogenous leukemia with a normal karyotype. N Engl J Med. 2005;352:254–66. 3. Heath EM, Chan SM, Minden MD, et al. Biological and clinical consequences
of NPM1 mutations in AML. Leukemia. 2017;31:798–807.
4. Papaemmanuil E, Gerstung M, Bullinger L, et al. Genomic classification and prognosis in acute myeloid leukemia. N Engl J Med. 2016;374:2209–21. 5. Wouters BJ, Delwel R. Epigenetics and approaches to targeted epigenetic
therapy in acute myeloid leukemia. Blood. 2016;127:42–52.
6. Pfister SX, Ashworth A. Marked for death: targeting epigenetic changes in cancer. Nat Rev Drug Discov. 2017;16:241–63.
7. Marzluff WF, Gongidi P, Woods KR, et al. The human and mouse replication-dependent histone genes. Genomics. 2002;80:487–98.
8. Holmfeldt L, Wei L, Diaz-Flores E, et al. The genomic landscape of hypodiploid acute lymphoblastic leukemia. Nat Genet. 2013;45:242–52. 9. Fritz AJ, Ghule PN, Boyd JR, et al. Intranuclear and higher-order chromatin
organization of the major histone gene cluster in breast cancer. J Cell Physiol. 2018;233:1278–90.
10. Tiberi G, Pekowska A, Oudin C, et al. PcG methylation of the HIST1 cluster defines an epigenetic marker of acute myeloid leukemia. Leukemia. 2015;29:1202–6. 11. Schlenk RF, Dohner K, Krauter J, et al. Mutations and treatment outcome in
cytogenetically normal acute myeloid leukemia. N Engl J Med. 2008;358:1909–18.
12. Dohner H, Estey E, Grimwade D, et al. Diagnosis and management of AML in adults: 2017 ELN recommendations from an international expert panel. Blood. 2017;129:424–47.
13. Cancer Genome Atlas Research Network. Genomic and epigenomic landscapes of adult de novo acute myeloid leukemia. N Engl J Med. 2013; 368:2059–74. Ley TJ, Miller C et al
14. Metzeler KH, Hummel M, Bloomfield CD, et al. An 86-probe-set gene-expression signature predicts survival in cytogenetically normal acute myeloid leukemia. Blood. 2008;112:4193–201.
15. Kohlmann A, Bullinger L, Thiede C, et al. Gene expression profiling in AML with normal karyotype can predict mutations for molecular markers and allows novel insights into perturbed biological pathways. Leukemia. 2010;24:1216–20.
16. Bei L, Lu Y, Eklund EA. HOXA9 activates transcription of the gene encoding gp91Phox during myeloid differentiation. J Biol Chem. 2005;280:12359–70.
17. Richard M, Veilleux P, Rouleau M, et al. The expression pattern of the ITIM-bearing lectin CLECSF6 in neutrophils suggests a key role in the control of inflammation. J Leukoc Biol. 2002;71:871–80.
18. Bagger FO, Sasivarevic D, Sohi SH, et al. BloodSpot: a database of gene expression profiles and transcriptional programs for healthy and malignant haematopoiesis. Nucleic Acids Res. 2016;44:D917–24.
19. Ng SW, Mitchell A, Kennedy JA, et al. A 17-gene stemness score for rapid determination of risk in acute leukaemia. Nature. 2016;540:433–7. 20. Hergeth SP, Schneider R. The H1 linker histones: multifunctional
proteins beyond the nucleosomal core particle. EMBO Rep. 2015;16:1439–53.
21. Quentmeier H, Martelli MP, Dirks WG, et al. Cell line OCI/AML3 bears exon-12 NPM gene mutation-A and cytoplasmic expression of nucleophosmin. Leukemia. 2005;19:1760–7.
22. Chatterjee A, Rodger EJ, Eccles MR. Epigenetic drivers of tumourigenesis and cancer metastasis. Semin Cancer Biol. 2018;51:149–59.
23. Kernytsky A, Wang F, Hansen E, et al. IDH2 mutation-induced histone and DNA hypermethylation is progressively reversed by small-molecule inhibition. Blood. 2015;125:296–303.
24. Gollner S, Oellerich T, Agrawal-Singh S, et al. Loss of the histone methyltransferase EZH2 induces resistance to multiple drugs in acute myeloid leukemia. Nat Med. 2017;23:69–78.
25. Bertoli S, Picard M, Berard E, et al. Dexamethasone in hyperleukocytic acute myeloid leukemia. Haematologica. 2018;103:988–98.
26. Quek L, Otto GW, Garnett C, et al. Genetically distinct leukemic stem cells in human CD34- acute myeloid leukemia are arrested at a hemopoietic precursor-like stage. J Exp Med. 2016;213:1513–35.
27. Medrzycki M, Zhang Y, McDonald JF, et al. Profiling of linker histone variants in ovarian cancer. Front Biosci (Landmark Ed). 2012;17:396–406.
28. Bauden M, Kristl T, Sasor A, et al. Histone profiling reveals the H1.3 histone variant as a prognostic biomarker for pancreatic ductal adenocarcinoma. BMC Cancer. 2017;17:810.
29. Medrzycki M, Zhang Y, Zhang W, et al. Histone h1.3 suppresses h19 noncoding RNA expression and cell growth of ovarian cancer cells. Cancer Res. 2014;74:6463–73.
30. Sancho M, Diani E, Beato M, et al. Depletion of human histone H1 variants uncovers specific roles in gene expression and cell growth. PLoS Genet. 2008;4:e1000227.
32. Millan-Arino L, Islam AB, Izquierdo-Bouldstridge A, et al. Mapping of six somatic linker histone H1 variants in human breast cancer cells uncovers specific features of H1.2. Nucleic Acids Res. 2014;42:4474–93.
33. Yang SM, Kim BJ, Norwood Toro L, et al. H1 linker histone promotes epigenetic silencing by regulating both DNA methylation and histone H3 methylation. Proc Natl Acad Sci U S A. 2013;110:1708–13.
34. Li H, Kaminski MS, Li Y, et al. Mutations in linker histone genes HIST1H1 B, C, D, and E; OCT2 (POU2F2); IRF8; and ARID1A underlying the pathogenesis of follicular lymphoma. Blood. 2014;123:1487–98.
35. Warrell RP Jr, Frankel SR, Miller WH Jr, et al. Differentiation therapy of acute promyelocytic leukemia with tretinoin (all-trans-retinoic acid). N Engl J Med. 1991;324:1385–93.
36. Boutzen H, Saland E, Larrue C, et al. Isocitrate dehydrogenase 1 mutations prime the all-trans retinoic acid myeloid differentiation pathway in acute myeloid leukemia. J Exp Med. 2016;213:483–97.
37. El Hajj H, Dassouki Z, Berthier C, et al. Retinoic acid and arsenic trioxide trigger degradation of mutated NPM1, resulting in apoptosis of AML cells. Blood. 2015;125:3447–54.
38. Martelli MP, Gionfriddo I, Mezzasoma F, et al. Arsenic trioxide and all-trans retinoic acid target NPM1 mutant oncoprotein levels and induce apoptosis in NPM1-mutated AML cells. Blood. 2015;125:3455–65.
39. Tassara M, Dohner K, Brossart P, et al. Valproic acid in combination with all-trans retinoic acid and intensive therapy for acute myeloid leukemia in older patients. Blood. 2014;123:4027–36.
40. Schenk T, Chen WC, Gollner S, et al. Inhibition of the LSD1 (KDM1A) demethylase reactivates the all-trans-retinoic acid differentiation pathway in acute myeloid leukemia. Nat Med. 2012;18:605–11.
41. Baik H, Boulanger M, Hosseini M, et al. Targeting the SUMO pathway primes all-trans retinoic acid-induced differentiation of nonpromyelocytic acute myeloid leukemias. Cancer Res. 2018;78:2601–13.
42. Delaunay J, Recher C, Pigneux A, et al. Addition of Gemtuzumab Ozogamycin to chemotherapy improves event-free survival but not overall survival of AML patients with intermediate cytogenetics not eligible for allogeneic transplantation. Results of the GOELAMS AML 2006 IR study. Blood. 2011;118:79.
43. Pigneux A, Bene MC, Salmi LR, et al. Improved survival by adding Lomustine to conventional chemotherapy for elderly patients with AML without unfavorable cytogenetics: results of the LAM-SA 2007 FILO trial. J Clin Oncol. 2018;36:3203–10.
44. Handschuh L, Kazmierczak M, Milewski MC, et al. Gene expression profiling of acute myeloid leukemia samples from adult patients with AML-M1 and -M2 through boutique microarrays, real-time PCR and droplet digital PCR. Int J Oncol. 2018;52:656–78.
45. Koubi M, Poplineau M, Vernerey J, et al. Regulation of the positive transcriptional effect of PLZF through a non-canonical EZH2 activity. Nucleic Acids Res. 2018;46:3339–50.
Publisher’s Note


![Bis(cucurbit[6]uril) bis(hexane 1,6 diyldipyridinium) tetrabromide tridecahydrate](data:image/gif;base64,R0lGODlhAQABAIAAAP///wAAACH5BAEAAAAALAAAAAABAAEAAAICRAEAOw==)