https://doi.org/10.5194/gmd-10-2971-2017 © Author(s) 2017. This work is distributed under the Creative Commons Attribution 3.0 License.
Enviro-HIRLAM online integrated meteorology–chemistry
modelling system: strategy, methodology, developments and
applications (v7.2)
Alexander Baklanov1,a, Ulrik Smith Korsholm1, Roman Nuterman2, Alexander Mahura1,b, Kristian Pagh Nielsen1, Bent Hansen Sass1, Alix Rasmussen1, Ashraf Zakey1,c, Eigil Kaas2, Alexander Kurganskiy2,3, Brian Sørensen2, and Iratxe González-Aparicio4
1Danish Meteorological Institute (DMI), Copenhagen, Denmark 2Niels Bohr Institute, University of Copenhagen, Copenhagen, Denmark 3Russian State Hydrometeorological University, St. Petersburg, Russia
4European Commission, DG – Joint Research Centre, Institute for Energy and Transport, Petten, the Netherlands anow at: World Meteorological Organization (WMO), Geneva, Switzerland
bnow at: University of Helsinki, Helsinki, Finland
cnow at: The Egyptian Meteorological Authority, Cairo, Egypt
Correspondence to:Alexander Baklanov ([email protected], [email protected]) Received: 27 December 2016 – Discussion started: 4 January 2017
Revised: 1 June 2017 – Accepted: 8 June 2017 – Published: 8 August 2017
Abstract.The Environment – High Resolution Limited Area Model (Enviro-HIRLAM) is developed as a fully online inte-grated numerical weather prediction (NWP) and atmospheric chemical transport (ACT) model for research and forecast-ing of joint meteorological, chemical and biological weather. The integrated modelling system is developed by the Dan-ish Meteorological Institute (DMI) in collaboration with sev-eral European universities. It is the baseline system in the HIRLAM Chemical Branch and used in several countries and different applications. The development was initiated at DMI more than 15 years ago. The model is based on the HIRLAM NWP model with online integrated pollutant transport and dispersion, chemistry, aerosol dynamics, deposition and at-mospheric composition feedbacks. To make the model suit-able for chemical weather forecasting in urban areas, the me-teorological part was improved by implementation of urban parameterisations. The dynamical core was improved by im-plementing a locally mass-conserving semi-Lagrangian nu-merical advection scheme, which improves forecast accuracy and model performance. The current version (7.2), in com-parison with previous versions, has a more advanced and cost-efficient chemistry, aerosol multi-compound approach,
aerosol feedbacks (direct and semi-direct) on radiation and (first and second indirect effects) on cloud microphysics. Since 2004, the Enviro-HIRLAM has been used for differ-ent studies, including operational pollen forecasting for Den-mark since 2009 and operational forecasting atmospheric composition with downscaling for China since 2017. Fol-lowing the main research and development strategy, further model developments will be extended towards the new NWP platform – HARMONIE. Different aspects of online cou-pling methodology, research strategy and possible applica-tions of the modelling system, and “fit-for-purpose” model configurations for the meteorological and air quality com-munities are discussed.
1 Introduction
trans-port (ACT) models with operational numerical weather pre-diction (NWP) data as a driver (Lawrence at al., 2005). A new concept and methodology considering the “chemical weather” as two-way interacting nonlinear meteorological and chemical/aerosol dynamics processes of the atmosphere have been recently suggested (Grell et al., 2005; Baklanov and Korsholm, 2008; Baklanov, 2010; Grell and Baklanov, 2011). First attempts at building online coupled meteorol-ogy and air pollution models for environmental applications were done in the 1980s; see Baklanov (1988), Schlünzen and Pahl (1992), Jacobson (1994). For climate applications, the first coupled chemistry-climate models were developed and used in the 1990s; cf. Jacobson (1999, 2002), de Grandpré et al. (2000), Steil et al. (2003), Austin and Butchart (2003). A more detailed overview of the history and current experience in the online integrated meteorology–chemistry modelling, the importance of different chains of feedback mechanisms for meteorological and atmospheric composition processes are discussed for US (Zhang, 2008) and European (Baklanov et al., 2014) models. Klein et al. (2012) extended applica-tions of coupled models for “biological weather”, defined as “the short-term state and variation of concentrations of bioaerosols”, in particular for pollen modelling and forecast-ing.
The online integration of meso-meteorological models (MetM) and atmospheric aerosols and ACT models gives a possibility to utilise all meteorological 3-D fields in the ACT model at each time step and to consider nonlinear feed-backs of air pollution (e.g. atmospheric aerosols) on mete-orological processes/climate forcing and then on the chem-ical composition of the atmosphere. This very promising way for future atmospheric modelling systems (as a part of, and a step toward, the Earth system modelling, ESM) will lead to a new generation of seamless coupled models for meteorological, chemical and biochemical weather forecast-ing. A seamless approach for “one atmosphere” integrated meteorology–chemistry/aerosol forecasting systems is anal-ysed by the COST Action ES1004 EuMetChem (see, e.g. Baklanov et al., 2015), and an overview of the current state of online coupled chemistry-meteorology models and needs for further developments were published in Zhang (2008), WMO (2016), Baklanov et al. (2017) and Sokhi et al. (2017). The methodology on how to realise the suggested inte-grated concept was demonstrated on a European example of the Enviro-HIRLAM (Environment – High Resolution Lim-ited Area Model) integrated modelling system (Baklanov et al., 2008a; Korsholm, 2009). Experience from first HIRLAM community attempts to include pollutants into the NWP model (Ekman, 2000) and from pioneering online coupled meteorology–pollution model developments of the Novosi-birsk science school (Marchuk, 1986; Penenko and Aloyan, 1985; Baklanov, 1988) was actively used for developments of the Enviro-HIRLAM modelling system.
The Enviro-HIRLAM is developed as a fully online in-tegrated NWP and ACT modelling system for research
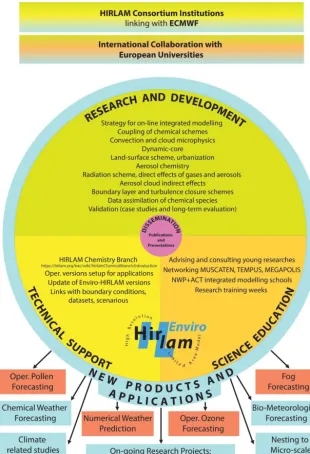
and forecasting of meteorological, chemical and biological weather. The integrated modelling system is developed by the Danish Meteorological Institute (DMI) and other col-laborators (Chenevez et al., 2004; Baklanov et al., 2008a, 2011b; Korsholm et al., 2008, 2009; Korsholm, 2009) and included as the baseline system of the chemical branch of the HIRLAM consortium (Fig. 1).
The model development was initiated at DMI more than 15 years ago and it is used now in several countries. The mod-elling system is being used for different completed and on-going research projects (FP6 FUMAPEX; FP7 MEGAPOLI, PEGASOS, MACC, TRANSPHORM, MarcoPolo; Nord-Forsk NetFAM, MUSCATEN, CarboNord, CRAICC-PEEX, CRUCIAL; COST Actions – 728, 732, ES0602 ENCWF, ES1004 EuMetChem) and has been used for operational pollen forecasting in Denmark since 2009 (Rasmussen et al., 2006; Mahura et al., 2006b) and operational atmospheric composition (with a focus on aerosols) for China since November 2016 (Mahura et al., 2016, 2017). Following the main strategic plans (Baklanov, 2008; Baklanov et al., 2011a) within HIRLAM-B and -C projects, further developments of the modelling system will be shifting to a new NWP platform (from HIRLAM to HARMONIE), and a close collabora-tion with the ALADIN (Aire Limitée Adaptacollabora-tion dynamique Développement InterNational) community was initiated in 2014.
In this paper, an overall description of the current version of the Enviro-HIRLAM coupled modelling system with im-proved parameterisations of meteorology–composition two-way interactions, the main steps in its development and ex-amples in different application areas for air quality, weather and pollen forecasting are considered for the first time. Section 2 provides a detailed description of the Enviro-HIRLAM modelling system and its key developments in the meteorological core, chemistry and aerosol dynamics parts, aerosol–meteorology interactions, models urbanisation and improvements of numerical algorithms. Section 3 describes a few types of Enviro-HIRLAM applications for meteoro-logical and environmental forecasting and assessment stud-ies. Sections 4 and 5 continue discussions and summarise the model applicability and provide recommendations for fu-ture research. Appendix A includes brief information about the Enviro-HIRLAM model development history. A list of acronyms is provided in Appendix B.
2 Enviro-HIRLAM modelling system description 2.1 Modelling system structure
Figure 1.General scheme of international collaboration, research and development, technical support and science education for the online integrated Enviro-HIRLAM: “Environment – High Resolution Limited Area Model”.
now it is included by the European HIRLAM consortium as a baseline system in the HIRLAM Chemical Branch (http: //hirlam.org/index.php/documentation/chemistry-branch). It was the first mesoscale online coupled model in Europe that considered two-way indirect feedbacks between meteorol-ogy and chemistry/aerosols (WMO-COST, 2008).
The main steps of the model development were realised, including (i) model nesting for high resolutions, (ii) im-proved resolving planetary boundary layer (PBL) and sur-face layer structure, (iii) urbanisation of the NWP model, (iv) improvement of advection schemes, (v) emission
inven-tories and models, (vi) implementation of gas-phase chem-istry mechanisms, (vii) implementation of aerosol dynamics, (viii) realisation of aerosol feedback mechanisms.
Figure 2.Schematics of the Enviro-HIRLAM modelling system.
sublayer parameterisations (Baklanov et al., 2008b; Mahura et al., 2008a; González-Aparicio et al., 2013). The model’s dynamic core was improved by adding a locally mass-conserving semi-Lagrangian numerical advection scheme (Kaas, 2008; Sørensen, 2012; Sørensen et al., 2013), which improves forecast accuracy and enables performing longer runs. More details of the system development history are pre-sented in Appendix A.
The current version of Enviro-HIRLAM (Nuterman et al., 2013, 2015) is based on the Reference-HIRLAM v7.2 with a more advanced and effective chemistry scheme, multi-compound modal approach aerosol dynamics modules, aerosol feedbacks on radiation (direct and semi-direct ef-fects) and on cloud microphysics (first and second indirect effects). This version is continuously under development and evaluation for various weather and air-quality-related appli-cations (in particular, within the COST Action ES1004 where
the above-mentioned effects were extensively discussed; see, e.g. Baklanov et al., 2014).
Vertical and horizontal resolutions of the model are flex-ible. Limitations, e.g. due to the hydrostatic approximation, are provided (minimum 1.5 km of the horizontal resolution for flat terrains, e.g. for Copenhagen).
2.2 Meteorological core of the system
atmospheric chemical and biological aerosols driven by me-teorology from the NWP block.
HIRLAM is a hydrostatic NWP model which is used for both research and operational purposes. The model pro-vides a forecast of the main meteorological fields, includ-ing air temperature and specific humidity, atmospheric pres-sure, wind speed and direction, cloud cover and turbulent ki-netic energy (TKE) based on forward-in-time integration of the primitive equations (dynamical core) (Holton, 2004) and physical processes such as radiation, vertical diffusion, con-vection, condensation, etc. (physical core).
The detailed NWP HIRLAM description can be found in the HIRLAM reference guide scientific documentation (Undén et al., 2002) and its following upgrades and modi-fications (for more details, see http://www.hirlam.org).
The hydrostatic approximation of the model can be a lim-itation for increasing the resolution for urban simulations. However, sensitivity tests for a medium-size city demon-strated that 2.5 km was the optimal resolution, allowing at the same time to obtain satisfactory reproducibility of the large-scale processes and to explore the urban effects at local large-scale (González-Aparicio et al., 2013). For other metropolitan ar-eas, such as Paris, Rotterdam, St. Petersburg and Shanghai, a similar resolution was chosen, whereas for Copenhagen (with its flat terrain) the highest suitable resolution tested was 1.5 km and provided reasonable verification results (Mahura et al., 2006a, 2008b, c, 2016). Within a selected metropoli-tan area, there could be only a few grid cells having 100 % representation of the urban fraction, but taking into account all urban grid cells, the boundaries of the cities (number of cells) could be substantially larger. Moreover, most of the existing parameterisations in the physics core of any NWP model might need a revision when resolutions of 1 km and finer are used.
Following the main strategic development within HIRLAM (HIRLAM-B and -C projects), there are plans for further developments of Enviro-HIRLAM shifting to a new non-hydrostatic NWP platform (e.g. HARMONIE model) and incorporating chemistry modules and aerosol– radiation–cloud interactions into the future integrated system (Baklanov, 2008; Baklanov et al., 2011a).
The new non-hydrostatic version under HARMONIE is under development and only some elements are realised so far. The non-hydrostatic HARMONIE-AROME model in-cludes only some aerosol effects. The physics included in this version of HARMONIE has recently been detailed by Bengtsson et al. (2017). HARMONIE-AROME is based partly on Meso-NH (mesoscale non-hydrostatic atmospheric model), which is a cloud-resolving model that includes state-of-the-art chemistry and aerosol interactions (e.g. Berger et al., 2016). However, Meso-NH cannot be run as a near-real-time NWP model, as is possible with Enviro-HIRLAM.
2.3 Atmospheric chemistry 2.3.1 Tropospheric sulfur cycle
The simple tropospheric sulfur cycle chemistry module in Enviro-HIRLAM, used for long-term runs (up to 1 year), is based on the sulfur cycle mechanism developed by Feichter et al. (1996) treating three prognostic species: dimethyl sul-fide (DMS), sulfur dioxide (SO2)and sulfate (SO24−). The mechanism includes DMS and SO2 oxidation by hydroxyl (OH) and DMS reactions with nitrate radicals (NO3)in the gas-phase part. The heterogeneous aqueous phase chemistry is comprised of SO2 oxidation reactions by H2O2 and O3. Accounting for dissolution effects of SO2 in the aqueous phase is performed according to Henry’s law. An output of the global chemistry transport model MOZART (Horowitz et al., 2003) is used to prescribe three-dimensional oxidant fields of OH, H2O2, NO2and O3.
The sulfate produced in the gas phase is referred to the gases and can be condensed on pre-existing aerosols or to nucleate by the aerosol microphysics M7 module (see Sect. 2.4). Moreover, in-cloud produced sulfate is accu-mulated on the pre-existing accumulation and coarse-mode aerosols.
The tropospheric sulfur cycle chemistry is used together with the M7 aerosol microphysics module because of its relative simplicity and low computational cost. The Carbon Bond Mechanism version Z (CBM-Z) gas-phase chemistry (see the next section) is not interfaced with the M7 aerosol module because of several reasons: (1) the aerosol micro-physics module does not include secondary organic aerosols; therefore, there is no need for a complex gas-phase mecha-nism with volatile-organic-compound-related reactions, and (2) it is too computationally expensive to use CBM-Z to-gether with M7 for both weather and atmospheric compo-sition prediction.
2.3.2 Gas-phase chemistry
eval-uations but with expansions to include reactions that are im-portant in the remote troposphere. It also uses the most gen-eral organic category (PAR for paraffin) to represent miscel-laneous carbon content so that carbon mass is conserved.
Six environmental/smog chamber experiments were used to validate the gas-phase schemes as box models and within a regional climate model (Shalaby, 2012; Shalaby et al., 2012). The Tennessee Valley Authority (TVA) and the EPA cham-ber experiments were used to evaluate the different gas-phase schemes and different chemical solvers. Namely, TVA005 and TVA006 are designed to test the simple system of NOx; TVA068 is designed to test a simple mixture of volatile or-ganic compounds (VOCs) with very high NOx. EPA069A, EPA073A and EPA150A are used to validate the schemes with low NOxconcentration and high VOC concentration. 2.3.3 Chemical solvers
Calculating the time evolution of gas-phase chemistry re-quires a numerical integration of a set of stiff ordinary dif-ferential equations (ODEs) and is among the most compu-tationally expensive operations performed in a photochemi-cal grid model. The equations for photochemiphotochemi-cal production and loss are computationally expensive because they form a stiff numerical system. The photochemical mechanisms de-scribed above were implemented using two different chemi-cal solvers to solve the tendency equation for photochemichemi-cal production and loss: (1) the Rosenbrock (ROS) solver (Sandu et al., 1997; Hairer and Wanner, 1996) as implemented by the Kinetic PreProcessor (KPP) (Sandu and Sander, 2006) and (2) the computationally rapid radical balance method (RBM) of Sillman (1991). RBM utilises the fact that much of the complexity of tropospheric chemistry stems from the HOx radical family (OH, HO2and RO2), which has a limited set of sources and sinks. The method solves reverse Euler equa-tions for OH and HO2based on the balance between sources, sinks and (if applicable) prior concentrations at the start of the time step. Reverse Euler equations for other species are solved in a reactant-to-product order, in some cases involving pairs of rapidly interacting species, and with some modifi-cations to increase accuracy in exponential decay situations. The procedure is equivalent to a reverse Euler solution using sparse-matrix techniques but with the matrix inversion linked specifically to the behaviour of OH and other species in the troposphere. Prior work tested several atmospheric chemistry mechanisms in the model by taking into account different chemical solvers. We select the photochemical mechanism CBM-Z because it affords a reasonable trade-off between ac-curacy and computational efficiency. During the prior work, including the validation stages of the gas-phase schemes (re-sults not shown), we used KPP to generate the Fortran code of three different gas-phase schemes: CBM-Z (Zaveri and Peters, 1999), GEOS-CHEM (Evans et al., 2003) and the Re-gional Atmospheric Chemistry Model (RACM; Stockwell et al., 1997). In order to fit within our main aim of the
chemi-cal weather predication, we did not use both GEOS-CHEM and RACM because they are very computationally expen-sive schemes due to their extenexpen-sive number of chemical re-actions. The KPP provides a flexible tool to generate a well-coded chemical mechanism according to the user choice of a given ODE solver. We use KPP tools to create the gas-phase chemical mechanisms including the solvers for three chem-ical mechanisms. Usually, the Rosenbrock solver is selected for most of simulations due to its ability to be a fast compu-tational solver (Sandu et al., 1997).
2.3.4 Photolysis rates
Photolysis rates are determined as a function of various me-teorological and conditional inputs. Rates for specific condi-tions are determined by interpolating from an array of pre-determined values. The latter is based on the Tropospheric Ultraviolet-Visible (TUV) model developed by Madronich and Flocke (1999), using a pseudo-spherical discrete ordi-nate method (Stamnes et al., 1988) with eight streams. The eight-stream TUV is the most accurate method for determin-ing photolysis rates but is computationally too expensive for use in 3-D models. Photolysis rate constants are calculated using the Fast-J radiative transfer model (Wild et al., 2000) with O(1D) quantum yields updated to JPL2003 (Sander et al., 2003).
For simplicity, photolysis rates are estimated as the fol-lowing. At first, for the simple reactions, the photolysis rates are estimated as a function of the number of parameters such as meteorological and chemical inputs including alti-tude, solar zenith angle, overhead column densities for O3, SO2and NO2, surface albedo, aerosol optical depth, aerosol single scattering albedo, cloud optical depth and cloud alti-tude. Then, for the complex reactions, the photolysis rates are estimated as a lookup table using the TUV model. TUV is run offline and used to calculate a lookup table of the pho-tolysis rates, and then this lookup table is implemented under different weather conditions inside the model.
pho-tolysis calculations, thereby directly coupling the phopho-tolysis rates and chemical reactions to meteorological conditions at each model time step.
2.3.5 Heterogeneous chemistry
Many gas-phase species are water soluble, and sulfate and ammonia together with water take part in binary/ternary nucleation. In order to consider these processes, a simpli-fied liquid-phase equilibrium mechanism with the most ba-sic equilibria is included in Chem-Liquid. The NWP-Chem-Liquid is a thermodynamic equilibrium model, de-scribed in Korsholm et al. (2008). This equilibrium module is solved using the analytical equilibrium iteration method (Ja-cobson, 1999). The reactions are summarised in Korsholm (2009) and the module will be updated to include the im-pact of organic compounds from anthropogenic and biogenic sources.
2.4 Aerosol formation, dynamics and deposition 2.4.1 Aerosol dynamics module
The first aerosol module in Enviro-HIRLAM was based on the CAC (chemistry–aerosol–cloud) model with the modal approach for description of aerosol size distribution (Bak-lanov, 2003; Gross and Bak(Bak-lanov, 2004) and considered only sulfur-type aerosols (Korsholm, 2009).
The current version of the Enviro-HIRLAM model has an M7 aerosol microphysics module (Vignati et al., 2004) together with aerosol removal processes ported from the ECHAM5-HAM climate model (Stier et al., 2005). There are two types of particles considered: insoluble and mixed (water-soluble) particles. The particles are split into seven classes depending on particle size and solubility by means of the “pseudo-modal” approach. Four classes are used to rep-resent mixed particles, i.e. nucleation, Aitken, accumulation and coarse modes, and another three classes are for the in-soluble (Aitken, accumulation and coarse modes). Four pre-dominant aerosol types are included – black carbon (BC) and primary organic carbon (OC), sulfate, mineral dust and sea salt. The M7 aerosol dynamics includes nucleation, coagu-lation and sulfuric acid condensation processes. Coagucoagu-lation and condensation will lead to formation of mixed particles from the insoluble ones. Different aerosol types mentioned above (as well as others, e.g. pollen particles) are provided as separate species in the model outputs along with lumped PM10and PM2.5.
2.4.2 Dry deposition and sedimentation
The dry deposition fluxes of gases and aerosols (for both number and mass concentrations) are calculated from the aerodynamic, quasi-laminar boundary layer as the product of the surface layer concentration and the dry deposition ve-locity (Stier et al., 2005). The fluxes are used as the lower
boundary condition in the semi-implicit vertical diffusion TKE-CBR scheme (Cuxart et al., 2000). The calculation of the dry deposition velocities is performed by means of the serial resistance approach. The “big-leaf” method is used to calculate surface resistance (Ganzeveld and Lelieveld, 1995; Ganzeveld et al., 1998) per each grid cell for the snow/ice, water, bare soil, low-vegetation and forest surface types. The SO2soil resistance is a function of soil pH, relative humid-ity, surface temperature and the canopy resistance, while sur-face resistances for other gases are prescribed. The canopy resistance is computed from stomatal resistance and monthly mean leaf area index (LAI) values from the Enviro-HIRLAM interaction soil–biosphere–atmosphere scheme (Noilhan and Planton, 1989).
The sedimentation of the aerosol particles is calculated throughout the atmospheric column. The calculation of the sedimentation velocity is based on the Stokes velocity with the Cunningham slip-flow correction factor accounting for non-continuum effects (Seinfeld and Pandis, 2006). In or-der to satisfy the Courant–Friedrichs–Lewy stability crite-rion, the sedimentation velocity is limited by the ratio of the model layer thickness and the time step.
2.4.3 Wet deposition
There are several options for the wet deposition in the model. The first version used the aerosol-size-dependent parameter-isation of Baklanov and Sørensen (2001). In the latest ver-sion, fixed size- and composition-dependent scavenging pa-rameters are also applied for wet deposition calculation and are different for stratiform and convective clouds (Stier et al., 2005). They were derived from measurements of inter-stitial and in-cloud aerosol contents. These scavenging coef-ficients depend on the aerosol modes, total cloud water and fraction (liquid and ice) and the conversion rates of cloud liquid water and cloud ice to precipitation through autocon-version, aggregation and accretion processes. The precip-itation re-evaporation before it reaches the ground is also included. The Soft TRAnsition COndensation (STRACO) cloud scheme (Sass, 2002) provides water and ice precipita-tion fluxes, normalised by the precipitaprecipita-tion rates, to the wet-deposition scheme, which uses prescribed size-dependent collection efficiencies for rain and snow (Seinfeld and Pan-dis, 1998).
2.5 Emission modules and preprocessor
emis-sion inventory developed by the Netherlands Organisation for Applied Scientific Research (TNO) (Kuenen et al., 2014). Linked to the model is a dataset of yearly accumulated fluxes of gases, such as CO, CH4, NOx, SO2, NH3, non-methane volatile organic compounds (NMVOCs) and particulate mat-ter (PM) in two size bins (2.5 and 10 µm) which are attributed to 10 source sectors, including energy industries, residen-tial combustion, industry, etc., denoted by SNAP (Selected Nomenclature for sources of Air Pollution) codes. The inven-tory has a resolution of 0.06◦×0.12◦and covers the entirety of Europe, the European part of Russia, north of the Sahara and a part of the Middle East. Total NMVOC emissions are split into 25 VOC compound groups by source sectors by country (Kuenen et al., 2010). The PM2.5 and PM10 emis-sions, split into six aerosol species (BC, OC, Na, SO4, other coarse primary and other fine primary particles), are applied following TNO recommendation (Kuenen et al., 2010). Be-cause the dataset contains accumulated surface fluxes, one needs to redistribute them in order to reproduce diurnal, weekly and monthly emissions variability. The emissions can also occur at different heights; e.g. emissions from power plants are elevated and those from traffic are at the surface, and thus vertical redistribution is applied within the first eight model hybrid levels. Therefore, temporal and vertical pro-files developed by TNO for different gaseous and aerosol species and SNAP codes are used in the emission prepro-cessor. The global biomass burning (wildfire) emission in-ventory (IS4FIRES; Sofiev et al., 2012), developed by the Finnish Meteorological Institute (FMI), has similar structure except for the number and kinds of available gaseous and aerosol species as well as the resolution. The inventory data are the total PM flux. The flux is split into PM2.5and coarse PM consisting of ash. The PM2.5 primarily consists of or-ganic and black carbon (OC and BC) and a remainder of organic matter that is not carbon; for details, see Andreae and Merlet (2001). The biomass burning emissions typically show a diurnal cycle variability, and therefore corresponding coefficients are applied (Giglio, 2007). The wildfire emis-sions are also redistributed vertically with different propor-tions – the lowest at 200 m and the highest up to 1 km over the ground.
The natural emissions of gases and aerosols are fully inter-active and calculated online. There is dimethyl sulfide (DMS; Nightingale et al., 2000) emission from oceans, which de-pends on the wind speed and seasonal variability of DMS solution in the water. Soluble sea-salt aerosol emissions (Za-key et al., 2008) are driven by wind speed and temperature, and insoluble mineral dust aerosol emissions (Zakey et al., 2006) also depend on meteorology as well as hydrological parameters. Both sea-salt and dust aerosols are emitted in ac-cumulation and coarse modes.
2.6 Aerosol feedback mechanisms 2.6.1 Direct and semi-direct effects
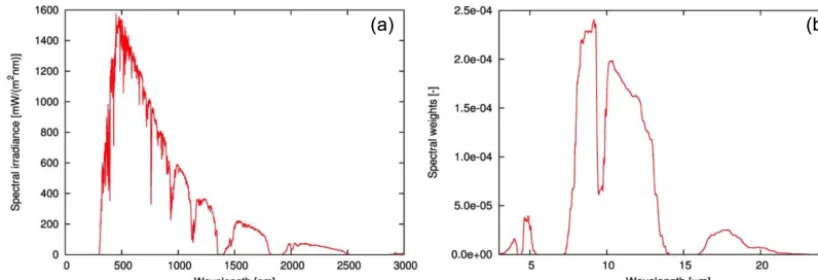
Enviro-HIRLAM contains parameterisations of the direct and semi-direct effects of aerosols. Direct and semi-direct effects are realised by modification of the Savijärvi radia-tion scheme (Savijärvi, 1990; Wyser et al., 1999) with im-plementation of new fast analytical short-wave (SW) and long-wave (LW) aerosol transmittances, reflectances and absorptances. The two-stream approximation equations for anisotropic non-conservative scattering described by Thomas and Stamnes (2002) are used for these calculations. The Global Aerosol Data Set/Optical Properties of Aerosols and Clouds (GADS/OPAC) aerosols of Köpke et al. (1997) are used as input to the routine. The species include BC (soot), minerals (nucleus, accumulation, coarse and transported modes), sulfuric acid, sea salt (accumulation and coarse modes), “water soluble” and “water insoluble” aerosols. In addition to the more standard nucleation, accumulation and coarse aerosol size modes, we consider, according to Köpke et al. (1997), the transported size mode to describe aerosols that have been transported over a long distance, for instance, Saharan aerosols that have been blown to the Atlantic Ocean. In order to make the calculations fast, optical properties that are spectrally averaged over the entire SW and LW spectra are used. The spectra used are shown in Fig. 3. The short-wave spectrum is a clear-sky spectrum from 2 km height in a standard atmosphere (Anderson et al., 1986) calculated with the DISORT algorithm (Stamnes et al., 1988) run in the Li-bRadtran framework (Mayer and Kylling, 2005). The long-wave spectrum is calculated similarly and is based on the overall atmospheric LW transmittance of a standard atmo-sphere.
2.6.2 First and second indirect effects
For aerosol–cloud interactions, a modified version of the STRACO cloud scheme (Sass, 2002) is used in Enviro-HIRLAM. This scheme developed for operational NWP has recently been upgraded using new efficient methods to ac-count for aerosol effects on cloud formation and micro-physics. The scheme is able to account for convective trans-ports of new variables. The prognostic aerosol fields are cou-pled directly to the cloud physical and microphysical prop-erties. Liquid cloud droplet number is calculated based on aerosol size, number and solubility, and the STRACO sub-grid supersaturation field is used as the basis for the droplet nucleation calculation. This ensures consistency with the cloud water mass.
Figure 3. (a) The typical SW spectrum used for calculating average SW aerosol optical properties. (b) The spectral weights used for calculating average LW aerosol optical properties.
the shape parameter is calculated online using Geoffroy et al. (2010). Several schemes have been implemented for nu-cleation, including Twomey (1959), Cohard et al. (1998, 2000), Abdul-Razzak et al. (1998) and Abdul-Razzak and Ghan (2000). Self-collection is the process whereby droplets collide and stick together but do not become raindrops. The parameterisation of self-collection processes follows Seifert and Beheng (2006). Sedimentation is calculated to be consis-tent with the mass of rainwater in a given model time step un-der the basic assumption that the largest droplets are removed first from the cloud. Similarly, evaporation of a droplet below activation radius is calculated to be consistent with the total evaporated cloud water under the assumption that the small-est droplets evaporate first.
The cloud droplet effective radius controls the liquid phase absorptivity and transmissivity and is calculated from liquid water mass and droplet number. Here, it is also dependent on the shape of the droplet distribution which evolves in time. Autoconversion follows Rasch and Kristjansson (1998) and is directly dependent on the calculated droplet number.
Abdul-Razzak and Ghan (2000) parameterisation for aerosol activation has been extensively tested in many on-line coupled weather and climate models. However, the STRACO cloud microphysics scheme with parameterisa-tions of aerosol activation, cloud droplet nucleation, sedi-mentation, evaporation and self-collection has been evalu-ated only with 1-D column HIRLAM, so it needs to be fur-ther thoroughly evaluated.
2.6.3 Urban parameterisations and models urbanisation
The representation of urban areas in Enviro-HIRLAM con-tains the following aspects and processes (Baklanov et al., 2005):
i. model down-scaling, including increasing vertical and horizontal resolution and nesting techniques;
ii. modified high-resolution urban land-use classifications, parameterisations and algorithms for roughness param-eters in urban areas based on the morphologic method; iii. specific parameterisation of the urban fluxes in the
mesoscale model;
iv. modelling/parameterisation of meteorological fields in the urban sublayer; and
v. calculation of the urban mixing height based on prog-nostic approaches.
The nesting technics and downscaling methods are actively and successfully used for urban areas to reach the necessary resolution for resolving or parameterisation of urban features and effects. The details of this approach with the Enviro-HIRLAM model were described, e.g. in Baklanov and Nuter-man (2009). With respect to metropolitan areas, the down-scaling for finer resolution allows to reproduce smaller-scale meteorological patterns, and then these patterns are further modified through running urban parameterisation modules only for grid cells where the cities are presented.
mod-els and is not very effective if the first model level is higher than 30 m. Therefore, the increasing of the vertical resolu-tion of current NWP models is required. The third module – Soil Model for Submesoscales, Urbanized (SM2-U) ver-sion (Dupont and Mestayer, 2006; Dupont et al., 2006) – is considerably more expensive computationally than the first two modules (Mahura et al., 2005a; Baklanov et al., 2008b). However, the third one provides the possibility to accurately study the urban soil and canopy energy exchange includ-ing the water budget. Therefore, the BEP scheme is consid-ered as the baseline option and third SM2-U module is rec-ommended only for use in advanced urban-scale NWP and meso-meteorological research models. The details of imple-mentations of different urban modules, own developments and comparisons of different approaches and modules were published in previous papers (Mahura et al., 2005a, b, 2006a, 2008a, b, c, 2010b; Baklanov et al., 2005, 2008b). The main approach includes an integration of the urban modules into the ISBA (interaction soil–biosphere–atmosphere) land sur-face scheme of the NWP/HIRLAM model. The urban mod-ules are activated only on those grid cells of the model do-main where the urban fraction is presented.
The urban boundary layer is very inhomogeneous and plays an important role in forming urban meteorological fields and especially in dispersion of atmospheric pollutants. Therefore, for calculation of the urban mixing height, in addition to the common diagnostic approaches, prognostic equations were used according to Zilitinkevich et al. (2002) and Zilitinkevich and Baklanov (2002).
2.7 Transport schemes
Until 2012, there were basically two options for trans-port schemes in Enviro-HIRLAM (Chenevez et al., 2004): (a) the traditional non-conserving but highly efficient semi-Lagrangian (SL) scheme (Robert, 1981) in HIRLAM and (b) the much less efficient flux-based and positive defi-nite fidefi-nite volume scheme by Bott (1989) with updates by Easter (1993). In 2012, the default transport scheme was updated to a new monotonic version of the locally mass-conserving semi-Lagrangian (LMCSL) scheme (Kaas, 2008; Sørensen et al., 2013). This scheme, used in the present ver-sion of Enviro-HIRLAM, to be described briefly below, is almost as efficient as the traditional SL scheme but now has the attractive properties of inherent mass conservation, and it is monotonic and positive definite.
In HIRLAM and former versions of Enviro-HIRLAM, a traditional SL scheme is used for advecting the specific con-centration of water constituents or the mixing ratioqiof any traceri. Considering mixing ratio, this means that when ig-noring any sources/sinks and turbulent mixing the prognostic transport equation to be solved is simply
dqi
dt =0. (1)
The traditional SL numerical integration of Eq. (1) reads
(qi)nk+1=(qi)n∗k, (2)
where subscriptkis the grid point/cell index and superscripts
n and n+1 represent two consecutive time steps, respec-tively. The subscript∗kindicates the tri-cubic interpolation to the location of the departure point of the upstream trajec-tory, which arrives in grid pointk at time leveln+1. The tri-cubic interpolation in Eq. (2) can also be represented as a sum of interpolation weights involving 64 grid points sur-rounding the departure point. Formally, this can be expressed as
(qi)nk+1= K X
l=1
wk,l(qi)nl, (3)
whereK is the total number of grid points in the entire in-tegration domain. Note that for eachkonly 64wk,l weights are different from zero. When converting mixing ratio into volume density, i.e. (ρi)nk+1=(ρd)kn+1(qi)nk+1, and subse-quently summing over the integration area, the traditional SL scheme is not mass conserving. Therefore, in LMCSL (Kaas, 2008), a different approach is followed, namely, as in most other mass-conserving transport schemes, to solve the com-plete continuity equation:
∂ρi
∂t = −∇ ·(ρiu) or
dρi
dt = −ρi∇ ·u, (4)
still omitting sources/sinks and turbulent mix-ing and then evaluating the mixing ratio from
(qi)nk+1=(ρi)nk+1 .
(qd)nk+1. In LMCSL, Eq. (4) is solved in a rather unusual way by modifying the interpo-lation weights in Eq. (3) in such a way that the sum of mass given off at time stepnby a Eulerian grid celllto all departure points that it influences is exactly equal to its own mass. In other words, LMCSL is based on simple partition of unity. The modified weights become
ˆ
wk,l=
Vl
Vk
wk,l PK
m=1wm,l
, (5)
whereVk is the volume of Eulerian grid cellk. Using the modified weights the basic LMCSL forecast reads as follows:
(ρi)nk+1= K X
l=1 ˆ
wk,l(ρi)nl. (6)
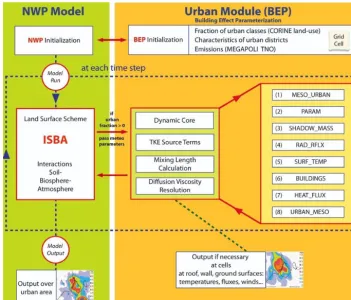
Figure 4.General scheme of the building effect parameterisation (BEP) module for the Enviro-HIRLAM model urbanisation with a structure of the sub-routine conception (adapted from Mahura et al., 2010b).
The ILMC filter designed to be as local as possible since non-local filters will generate non-physical chemical reactions. This is ensured by an iterative approach where the mass dis-crepancy is redistributed among the neighbouring cells in the first iteration, and the distribution radius is increased, in the case that there is remaining mass discrepancy, for the next iteration(s). In general, one or two iteration(s) are sufficient.
The LMCSL transport scheme in combination with the ILMC produces accurate monotonic and positive definite forecasts for water vapour, liquid/ice water and chemical constituents. As an example, the simulated PM2.5 concentra-tion on 17 July 2010 with horizontal resoluconcentra-tion of approxi-mately 16 km is shown in Fig. 5. It can be seen that the model is able to reproduce, e.g. sharp transitions related to fronts over the North Atlantic. A more in-depth analysis of the abil-ity of ILMC to reproduce sharp gradients can be found in Sørensen et al. (2013), in particular Fig. 3 and the accompa-nying discussion in that paper.
It should be noted that the dynamical core in Enviro-HIRLAM is identical to that of Enviro-HIRLAM. Thus, the dry-air density for dynamics is calculated using a traditional SL ap-proximation to Eq. (4), i.e. not the LMCSL. Therefore, the Enviro-HIRLAM is not formally wind-mass consistent re-garding tracer transport. However, the large-scale
precipita-tion fields in the tradiprecipita-tional HIRLAM and Enviro-HIRLAM are very similar (see, e.g. Fig. 4 in Sørensen et al., 2013), which suggests that wind-mass inconsistency is of minor im-portance. In principle, no monotonic transport schemes can be wind-mass consistent since the monotonic limiters for-mally destroy the consistency (see discussions on the issue of wind-mass inconsistency in atmospheric models in Jöckel et al., 2001).
3 Modelling system applications
Figure 5.Example of the simulated PM2.5concentration over Eu-rope on 17 July 2010 with horizontal resolution of 16 km.
forecasting and assessment studies are highlighted in Fig. 1 and will be demonstrated below.
3.1 Applications for numerical weather prediction Several Enviro-HIRLAM sensitivity and validation studies of aerosol feedbacks on meteorological processes were done previously (see, e.g. Korsholm, 2009; Korsholm et al., 2010; Baklanov et al., 2011a, b; Sokhi et al., 2016). For exam-ple, the effects of urban aerosols on the urban boundary layer height, can be comparable to the effects of the ur-ban heat island (1his up to 100–200 m for stable boundary layer) (Baklanov et al., 2008a). Further studies (Korsholm et al., 2010) of megacity effects on the meteorology/climate and atmospheric composition showed that aerosol feedbacks through the first and second indirect effects induce consid-erable changes in meteorological fields and large changes in chemical composition (see Sect. 3.4) in the case of con-vective clouds and little precipitation. The monthly aver-aged changes in surface temperature due to aerosol indi-rect effects of primary aerosol emissions in western Europe were analysed and validated versus measurement data. It was found that a monthly averaged signal (difference between runs with and without the indirect effects) in surface temper-ature can reach 0.5◦C (Fig. 2.2b in Korsholm et al., 2010).
Korsholm (2009) studied the impact of aerosol indirect ef-fects on surface temperatures and air pollutant concentrations for a 24 h simulation over a domain in northern France, in-cluding Paris, in a convective case with low precipitation. He found a marginally improved agreement with observed 2 m temperatures and a marked redistribution of NO2in the do-main, primarily as a result of the second indirect effect.
To perform analysis of atmospheric aerosol effects on clouds and precipitation, the year 2010 was selected for Enviro-HIRLAM simulations. That year, especially summer, was characterised by severe weather events such as floods, heat waves and droughts across the Middle East, most of Eu-rope and EuEu-ropean Russia. The model was forced by bound-ary and initial conditions produced by the ECMWF IFS (IFS-CY40r1) and MOZART (Horowitz et al., 2003) models for meteorology and atmospheric composition, respectively. The Enviro-HIRLAM modelling domain with horizontal resolu-tion of 0.15◦×0.15◦, 310×310 grid cells and 40 vertical hybrid sigma levels extending to pressures less than 10 hPa covers Europe, north of the Sahara and European Russia. The modelling domain was partitioned into 120 CPU cores and the model was run with a time step of 300 s. The model in-cludes emissions from anthropogenic sources developed by TNO and from wildfires produced by FMI as well as in-teractive DMS, sea salt and dust emissions (for details, see Sect. 2.5).
For aerosol–cloud interactions, these were estimated also for July 2010 by means of delta functions, i.e. the difference between outputs of models: Enviro-HIRLAM with aerosol– cloud interactions (ENV) and Reference-HIRLAM (REF). Figure 6a shows deltas (ENV–REF) of total cloud cover over model domain, which is mainly increased (with local max-ima up to 90 %) except several inland areas, such as Finland, the borders of Germany, Poland and Austria, where cloud cover decreased by almost 10-fold. The ENV runs revealed the increase of average cloud top height by approximately 2 %. The delta function of cloud water content at average cloud base shows (Fig. 6b) its increase compared to REF and local maxima over the North Atlantic, North Sea, Sweden, Switzerland and Austria. These areas are occupied by pre-cipitating clouds as seen in Fig. 7.
The absolute frequencies of stratiform and convective pre-cipitation over computational domain are decreased com-pared to the REF model, while the amount of convective precipitation during heavy precipitation events is increased. Hence, the wet deposition of particles decreases in summer because it rather depends on precipitation frequency than on its amount. The REF model run tends to overpredict both frequency and amount of precipitation. But the inclusion of aerosol–cloud interactions can improve general model per-formance; i.e. the ENV run bias for precipitation with respect to its frequency and amount has been decreased compared to the REF model run (Fig. 8).
Figure 6.Delta (Enviro-HIRLAM – Reference-HIRLAM) of(a)vertically integrated total cloud cover (%) and(b)cloud water content (kg kg−1) at average cloud base (667 m) on 17 July 2010 at 18:00 UTC.
Figure 7.Accumulated (3 h) precipitation patterns from Reference-HIRLAM (REF) and Enviro-HIRLAM with aerosol–cloud interactions (ENV) on 17 July 2010 at 18:00 UTC: stratiform precipitation:(a)REF,(b)ENV.
The model formulations have only been tested on a case basis, and although strong signals have been found, this does not imply improved meteorological performance of the model. In particular, testing over longer periods including all seasons was not conducted that time. Furthermore, the inter-actions between aerosols and the cloud ice phase are not in a state where improvements would be expected. Therefore, it is necessary to mention that it is too early to make conclusions about the improvement of precipitation forecasting by im-plementation of the indirect aerosol effects, because of large uncertainties in parameterisation of the aerosol–cloud micro-physics processes (especially for ice nucleation) and due to adjustments of such effects indirectly in NWP model param-eters and constants (retuning of them after implementation of the aerosol feedbacks is needed). More investigations, fur-ther improvements and evaluations are needed for aerosol
in-direct effects and aerosol–cloud microphysics schemes in the model. Recently such evaluation studies are realised within the CarboNord project for monthly and annual validation studies and will be published separately.
3.2 Urban meteorology and environment prediction and assessments
estima-Figure 8.Precipitation amount (12 h accumulated) of Reference-HIRLAM(a)and Enviro-HIRLAM with aerosol–cloud interactions(b) versus surface synoptic observations at WMO station 6670 in Zurich, Switzerland (lat: 47.47; long: 8.53), during July 2010.
tion of urban heat island (UHI) development over selected urban areas and surroundings were done.
The Enviro-HIRLAM simulations were performed for nested domains with horizontal resolutions of 15, 5 and 2.5 km and for selected periods in July 2009. The meteoro-logical boundary conditions were provided by the European Centre for Medium-Range Weather Forecasts (ECMWF) ev-ery 3 h. The model was employed in two modes. The first mode is the control (CTRL) run. The second mode is the urban (URB) run – e.g. coupled with the BEP (Martilli et al., 2002) module and anthropogenic heat fluxes (AHFs) from the Large scale Urban Consumption of energY (LUCY) model (Allen et al., 2010). Extracted AHFs were 60 and 40 W m−2 for the Paris and Bilbao metropolitan areas, re-spectively. For the URB run at the finest resolution, the Paris and Bilbao urban areas were represented by 220 and 16 urban cells, respectively (Fig. 9; adapted from González-Aparicio et al., 2010). In each grid cell, BEP parameterises the flux exchange between the urban surface and the atmosphere de-pending on combination of different urban districts, e.g. res-idential, low and high buildings, industrial and commercial.
The statistical analysis showed that the urban simulation had a reduced bias with respect to observations than the con-trol simulations. For Paris, on a monthly basis, the corre-lations for air temperature were higher for the URB com-pared to CTRL run, and results improved up to 10 % on a diurnal cycle (with a maximum of 0.83 at 08:00 UTC). The correlations were slightly lower (down to 0.5) at early morning hours and slightly higher (up to 0.8) during after-noon and nighttime. Moreover, correlations at suburban and urban stations were similar to correlations at rural stations (see Fig. 10a). Analysis for Bilbao (González-Aparicio et al., 2013) showed similar performance of the model for both runs: with correlation for air temperature about 0.85 and 0.88 for summer and winter, respectively. For the specific
humid-ity, it was 0.75 and 0.92. For the wind speed, the highest value (0.8) is in summer, and during winter it decreased to 0.6 (0.4) near the coast (inland) stations.
The results of simulations for two selected cities showed that the model reproduced well the mesoscale processes at the regional scale for inland winds over Paris and land– sea breeze interactions over Bilbao. For selected locations (e.g. coastal versus inland sites), the bias between the obser-vations and simulations was higher over Bilbao (maritime) than over Paris (continental). Although hydrostaticity of the model over a complex terrain is a limitation, but a sensitivity test over Bilbao showed that at 2.5 km optimal resolution it is possible at the same time to obtain satisfactory reproducibil-ity of the large-scale processes and to explore the urban ef-fects at finer scales.
Figure 9.Urban district classification based on urban zoning data for the(a)Bilbao and(b)Paris metropolitan areas, including the resi-dential area (ReD), low and high building districts (LBDs and HBDs, respectively) and industrial and commercial districts (ICDs). Spatial distribution of urban districts (HBDs – high buildings, RDs – residential, ICDs – industrial commercial and CCs – city centre districts) for the Paris metropolitan area within the P01 modelling domain (partly adopted from González-Aparicio et al., 2014) is shown.
For Bilbao, the model showed that for breezes from north-ern directions, the impact of urban area on local flow dy-namics is inhibited; however, for breezes from southern di-rections, the urban effect had appeared. For example, on 15 July 2009, the UHI was developed during night–morning hours (e.g. 23:00–09:00 UTC) with a maximum up to 1◦C, and the heat island expanded covering area of about 130 km2. In addition, González-Aparicio et al. (2013) showed that the UHI intensity is lower in winter compared with summer; un-derlying that dominating factor is the surface heating during daytime, which is higher in summer than in winter.
As medium-size cities are under continuous development, future impacts of urbanisation are expected to become more significant. Several different scenarios of urban development were tested for Bilbao (González-Aparicio et al., 2014). Enviro-HIRLAM model runs showed that under calm con-ditions during summer and winter, the UHI could reach up to 2.2◦C, covering an area of about 400 km2when the city is doubled in size or doubled in AHF. When the city is tripled in size, the UHI could reach up to 3◦C with urban island ex-pansion up to 550 km2(Fig. 10c). Analysis of UHI for Bilbao (e.g. triple-size city scenario) versus current UHI over Paris showed similar intensity of up to 3◦C, and UHI boundaries were different; e.g. for Paris, they were was 4 times larger. Such differences can be explained by different cities’ sizes, morphologies and characteristic AHFs.
3.3 Pollen forecasting
Among air-pollinated allergens, birch pollen is one of the most important for the population group suffering allergic diseases. The number of allergic patients sensitive to birch pollen is assessed as 20 % of European population (WHO, 2003; Linneberg, 2011) and this number is constantly in-creasing. In particular, in Denmark, the number of allergic patients has increased twice over the past few decades
(Lin-neberg, 2011). These facts demonstrate the importance of operational birch pollen forecasting for the European pop-ulation especially during the spring season. Currently, birch pollen is presented as a biological air pollutant in different NWP and ACT models such as SILAM (Finland), COSMO-ART (Germany, Switzerland, Austria), CHIMERE (France), Enviro-HIRLAM, DEHM (Denmark) and others. The pollen emissions are strongly dependent on meteorology, so it is ad-vantageous to simulate and forecast pollen pollution episodes by online coupled meteorology–air pollution models since all necessary meteorological fields are available at each model time step.
Original developments of the dynamical Enviro-HIRLAM-based operational modelling system for the birch pollen forecasting in Denmark (called Env-POLL) were started in 2006 (Rasmussen et al., 2006; Mahura et al., 2006b) including previously developed statistical methods (Rasmussen, 2002), modelling of elevated concentrations episodes, analysis of spatiotemporal and diurnal cycle variabilities, contribution of remote source regions into pollen levels, improvements in emissions and parameter-isations, etc. (Mahura et al., 2007b, 2009, 2010a). The most recent developments are shown in Kurganskiy et al. (2015) with a revised general scheme of input and output of the Enviro-HIRLAM birch pollen forecasting system presented in Fig. 11. The input includes the meteorological initial/boundary conditions (IC/BC) obtained from the IFS model system, birch forest fraction map, phenological data, i.e. temperature sum thresholds for the start of flowering (Sofiev et al., 2013), and the accumulated total number of birch pollen particles emitted from a unit area during the pollinating season.
Figure 10.Difference plots for the air temperature at 2 m between outputs of the URB (urbanised BEP plus AHF) and CTRL (non-urbanised) Enviro-HIRLAM model under calm conditions during summer 2009 for the(a)Paris metropolitan area and for the Bilbao metropolitan area (b)in its current size of the city and(c)under a scenario tripling the size of the city.
Figure 11.General scheme of Enviro-HIRLAM birch pollen forecasting.
wet deposition, i.e. scavenging by precipitation. Birch pollen emissions are fully dependent on temporal and spatial vari-ability of meteorological conditions. The emission module (Sofiev et al., 2013) includes the following parameters af-fecting the pollen release: 2 m air temperature and relative humidity, 10 m wind speed and accumulated precipitation. The atmospheric transport is handled in the same way as for
out-put in terms of birch pollen forecasting, for analysis, contains 2-D fields of the birch pollen concentration at the lowest ver-tical model level. The modelling domain has 15 km horizon-tal resolution with 154 and 148 grid points along longitude and latitude, correspondingly. The domain covers the main European part and is centred around Denmark.
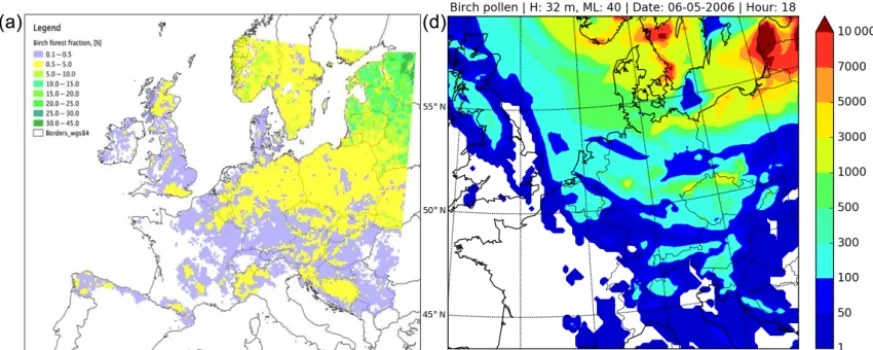
The birch forest habitat map has been derived by GIS (Geographic Information System) analysis (http://www. spatialanalysisonline.com) for the selected modelling do-main. The map (Fig. 12a) shows birch forest fraction in each model grid cell. Three GIS-based databases were used in the derivation procedure: (1) global land cover characterisa-tion (GLCC; http://landcover.usgs.gov/glcc/), (2) European Forest Institute (EFI; Päivinen et al., 2001) and (3) the tree species inventory (TSI; Skjøth et al., 2008). Both GLCC and EFI have 1 km horizontal resolution, whereas TSI has 50 km resolution.
As examples for the birch pollen season of 2006, the model results were compared with observations for two Dan-ish sites: Copenhagen and Viborg (Fig. 13). This year was dominated by a relatively cold spring over large areas of Eu-rope followed by rapid warming and little/no rain. It caused a short but intensive birch pollen season with long-range trans-port episodes before the local flowering start and thereby emissions. The evaluation for both modelled and observed birch pollen concentrations showed extremely high values (daily averages about and even more than 1000 grains m−3)
during the 5–10 May 2006 episode for Copenhagen and 5–8 May 2006 episode for Viborg. The extremely high birch pollen concentrations over Denmark are also visible in Fig. 12b.
According to Sofiev et al. (2011) and Siljamo et al. (2013) the following criteria can be used for assessment of birch pollen concentration forecasting: model accuracy (MA), hit rate (HR), false alarm ratio (FAR), probability of false de-tection (POFD) and odds ratio (OR). All of the criteria are calculated using four parameters obtained by assessment of the number of low and high modelled versus observed birch pollen concentrations (C) relative to a threshold value
Nth=50 grains m−3(i.e.C≥Nthfor high-concentration and C < Nthfor low-concentration days). The threshold has been chosen since most of the pollen-allergy-sensitive population might start suffering from allergic reactions when daily mean birch pollen concentrationC is greater than or equal toNth in the air (Jantunen et al., 2012).
The results of statistical analysis showed high MA for both Danish stations (0.95 for Copenhagen and 0.84 for Viborg, 0.9 on average). Prediction of elevated/top concentrations (HR values) by the model was assessed as 0.93 for Copen-hagen and 0.58 for Viborg. The FAR values indicated that the probability to get an incorrect top model concentration was 0.07 and 0.42 for Copenhagen and Viborg, respectively. The POFD criterion showed low probability to get high modelled concentrations for observed low-concentration days (0.02 for Copenhagen and 0.18 for Viborg). Finally, the OR indicated
that the likelihood of getting “high” day concentration in-stead of a “low” (if the model prediction is “high”) was 42 and 3.26 times higher for Copenhagen and Viborg, respec-tively. In other words, the OR values show the ratio between HR and POFD. As it is seen from the OR values provided above, a fraction of the correct forecasts is prevailing for both Danish stations in this study.
It was found that, compared to observations, the modelled results reflected the general shape of changes in pollen con-centration during the episode studied for both Danish sta-tions: Copenhagen and Viborg. As it is also seen in Fig. 13 that the model reproduces the magnitude of birch pollen con-centrations for the peak period of the season in compari-son with observations. However, some overestimation of the modelled concentration is visible for both stations at the end of the season. It can be explained by contribution due to long-range atmospheric transport of pollen from other remote re-gions, presumably from those located more northerly than Denmark and where the pollen season starts and ends later relative to the Danish sites.
3.4 Chemical weather forecasting and air pollution applications
Validation and sensitivity tests (on examples of case stud-ies and short time episodes) of the online versus offline inte-grated versions of Enviro-HIRLAM (Korsholm et al., 2008) showed that the online coupling improved the results. Dif-ferent parts of the model were evaluated versus the ETEX-1 experiment, the Chernobyl accident and Paris MEGAPOLI campaigns (summer 2009) datasets and showed that the model had performed reasonably well (Korsholm, 2009; Ko-rsholm et al., 2009, 2010; Sokhi et al., 2017).
Online versus offline coupled simulations for the ETEX-1 release showed that the offline coupling interval increase leads to considerable error and a false peak (not found in the observations), which almost disappears in the online ver-sion that resolves mesoscale influences during atmospheric transport and plume development (Korsholm et al., 2009). Further studies (Korsholm et al., 2010) of urban aerosol ef-fects on the atmospheric composition showed that aerosol feedbacks through the first and second indirect effects induce large changes in chemical composition, in particular nitrogen dioxide, in the case of convective clouds and little precipita-tion. For the Paris campaign, on diurnal cycle variability, the ozone concentration patterns showed dependencies on me-teorological parameters and especially at urban scale runs (Mahura et al., 2010b).
Figure 12. (a)Birch forest fraction map;(b)example of the simulated birch pollen concentration in the modelling domain on 6 May 2006 at 18:00 UTC.
Figure 13.Birch pollen concentrations observed (red) versus modelled (green) at Danish sites: Copenhagen(a)and Viborg(b).
and Spain (see Fig. 14a). The model runs were performed for the entire month of July 2010 with a 7-day spin-up in June. Figure 14b shows correlation coefficients on a diurnal cycle for PM2.5 concentrations at selected measurement sites. In general, it shows fairly good positive correlations (more than +0.3), except for several Spanish stations (such as ES1938A at daytime and ES1974A at nighttime).
On the monthly-based evaluation, the model predicts well PM2.5 day-to-day variability but always has negative bias (Fig. 15). This underprediction is due to several reasons: (i) aerosol microphysics without secondary organic aerosols; (ii) lack of partitioning of ammonium nitrate; (iii) rough model resolution, which still cannot capture small-scale ef-fects like complex orography and urbanised regions (in par-ticular, due to lack of fine-resolution emissions from anthro-pogenic sources, like urban traffic). For instance, the model shows a negative bias of PM2.5during daytime at the Dan-ish urban station (Fig. 15a). It is apparently due to rough model resolution in the considered runs. It was also found
that PM2.5 values are very influenced by changes in atmo-spheric stability conditions, which are difficult to predict ac-curately in many NWP models. This can be observed from correlation coefficient decrease at stations during nighttime (at 03:00 UTC) or from underestimation of elevated concen-trations. In spite of these issues, the model can well repro-duce the diurnal cycle of aerosols at different sites, e.g. ur-ban (Fig. 15a), coastal and rural (Fig. 15b), and shows good overall performance.
Figure 14. (a) Map of selected AirBase air quality monitoring stations (http://acm.eionet.europa.eu/databases/airbase/) across Europe; (b)PM2.5correlation coefficients on a diurnal cycle for selected AirBase observation stations.
Figure 15.Error-bar concentrations (µg m−3?) on the diurnal cycle for AirBase observations versus Enviro-HIRLAM modelling results: (a)Danish urban station and(b)German rural station. The top right corner indicates maximum and average correlation coefficients for the station as well as total number of analysed observation samples. Green numbers along thexaxis indicate number of observation samples per time slice.
CarboNord with a focus on evaluation of black carbon as well as higher-resolution modelling over the European domain in a short-term mode with a focus on feedback mechanism eval-uation (Nuterman et al., 2015; Kurganskiy et al., 2016).
4 Further discussions
Several types of the above-described and previously pub-lished applications of the Enviro-HIRLAM for meteorolog-ical, environmental and climate forecasting, and assessment studies were tested and demonstrated. Different applications of Enviro-HIRLAM (with downscaling from hemispheric –
regional – subregional – urban scales) were realised for dif-ferent geographical regions and countries including Euro-pean countries such as Denmark, Lithuania, France, Spain, Ukraine, Russia, the Netherlands and Turkey, as well as for others (Kazakhstan, China and Arctic regions).
It is clear that the seamless/online integrated modelling approach realised in Enviro-HIRLAM is a perspective and state-of-the-art way for future single-atmosphere modelling systems, providing advantages for all three communities: meteorological modelling including NWP, air quality (AQ) modelling including CWF, and climate modelling.
communities, and that should be further investigated with practical needs for area applications, approaches to coupling and computing resource usage. In particular, based on previ-ous studies and above-shown examples, the following could be recommended for the considered applications:
– For AQ, online coupling improves air quality forecasts, especially with full chemistry and aerosol feedbacks ef-fects included.
– For NWP, gas chemistry is not critical and can be sim-plified (or omitted), but aerosol feedbacks are important for radiation and precipitation and especially for heavy polluted episodes and in urban areas.
– For pollen forecast, online coupling improves pollen emission parameterisation and correspondingly mod-elling of concentration and deposition; however, the feedbacks are not so important. The chemistry is not considered yet, but interaction with allergens would be interesting to study in future (this has not been done yet).
– For climate studies, it is suitable only for understanding the feedback mechanisms but too expensive computa-tionally for climate timescale runs (the model had been used usually for 1-year runs); chemistry is important, as there is a need for it to be optimised and simplified. It should also be mentioned that the considered evaluations of Enviro-HIRLAM were done only for some elements (e.g. the coupling interval) in the previous analysis and main conclu-sions about the improvements were provided just for these. Other feedback mechanisms, especially for aerosol–cloud interactions, were analysed mostly as sensitivity studies or evaluated for short-term episodes. In particular, the STRACO cloud scheme contains fairly simplified cloud microphysics (heavily parameterised). Hence, tuning is essential for the overall performance of the model when it comes to precip-itation and cloud physical properties.
5 Conclusions
In this paper, we have provided a comprehensive descrip-tion of the Environment – High Resoludescrip-tion Limited Area Model (Enviro-HIRLAM), which is developed as a fully on-line coupled/integrated numerical weather prediction and at-mospheric chemical transport modelling system for research and forecasting of joint meteorological, chemical and biolog-ical weather.
Possible applications of the modelling system can include chemical weather forecasting, air quality and chemical com-position for short- and long-term impact assessments on pop-ulation and environment, multiscale weather forecasting (e.g. on regional and subregional scales, in urban areas and se-vere weather events), pollen and road weather condition
fore-casting, climate change forcing modelling, studies of cli-mate change effects on atmospheric pollution on different scales, weather modification and geoengineering methods, forest fires and volcano eruptions, dust storms, nuclear explo-sion consequences and other emergency preparedness mod-elling.
Comprehensive online modelling systems, like Enviro-HIRLAM, built originally for research purposes and includ-ing all important mechanisms of interactions, will help to un-derstand the importance of different physical–chemical pro-cesses and interactions as well as to create specific model configurations that are tailored for their respective purposes. Multiple-episode studies with the Enviro-HIRLAM model demonstrated the importance of including the meteorology and chemistry (especially aerosol) interactions in online cou-pled models. However, there is no unique integrated online modelling system configuration which is best suited for all communities.
Highlighting a number of previous investigations, we show that Enviro-HIRLAM has already been used for a host of different applications ranging from pollen forecasting to numerical weather prediction.
It should be stressed that there are still main gaps re-maining in the understanding of several processes such as (i) aerosol–cloud interactions (still poorly represented); (ii) data assimilation in online models (still to be developed to avoid overspecification and opposite cancelling effects); and (iii) model evaluation for online models (which needs more process data and long-term measurements, and a test bed).
Appendix A: Enviro-HIRLAM model development history
1999: The beginning at DMI as an unfunded initiative (A. Baklanov et al.)
2000: Utilisation of previous experience from the Novosibirsk scientific school (A. Baklanov) and SMHI (A. Ekman PhD)
2001: Online passive pollutant transport and deposition in HIRLAM-Tracer (J. Chenevez, A. Baklanov, J. H. Sørensen) 2003: Aerosol dynamics model developed and tested first as a 0-D module in offline CAC (A. Baklanov, A. Gross) 2004: Test of different formulations for advection of tracers including cloud water (K. Lindberg)
2005: Urbanisation of the model (funded by FP5 FUMAPEX) (A. Baklanov, A. Mahura, C. Peterson)
2005: COGCI grant for PhD study of aerosol feedbacks in Enviro-HIRLAM (U. Korsholm, supervised by A. Baklanov, E. Kaas)
2006: Test of CISL scheme in Enviro-HIRLAM (P. Lauritzen, K. Lindberg)
2007: First version of Enviro-HIRLAM for pollen studies (A. Mahura, U. Korsholm, A. Rasmussen, A. Baklanov) 2008: New economical chemical solver NWP-Chem (A. Gross)
2008: First version of Enviro-HIRLAM with indirect aerosol feedbacks (U. Korsholm PhD)
2008: Testing new advection schemes in Enviro-HIRLAM (UC: E. Kaas, A. Christensen, B. Sørensen, J. R. Nielsen) 2008: Decision to build HIRLAM Chemical Branch (HCB) with Enviro-HIRLAM as baseline system; Enviro-HIRLAM
becomes an international project
2008: First International Young Scientist Summer School (YSSS) on “Integrated Modelling of Meteorological and Chem-ical Transport Processes” (based on Enviro-HIRLAM) in St. Petersburg, Russia: http://netfam.fmi.fi/YSSS08/ 2009: Integrated version of Enviro-HIRLAM based on reference version 7.2 and the start of HCB
2011: New chemistry (A. Zakey), direct and semi-direct aerosol effect (K. P. Nielsen) schemes
2011: Second International YSSS (based on Enviro-HIRLAM/HARMONIE) in Odessa, Ukraine: http://www.ysss.osenu. org.ua/
2012: New effective aerosol scheme for multi-compound aerosols (R. Nuterman)
2012: New mass-conserving and monotonic semi-Lagrangian transport (B. Sørensen et al., 2013) 2013: New STRACO scheme with aerosol–cloud interaction (U. Korsholm and B. Sass) 2013: Model evaluation study within the AQMEII phase 2 exercise (R. Nuterman)
2014: Moving to the HARMONIE platform and building a joint strategy with ALADIN community
2014: Third International YSSS (based on five online coupled models including Enviro-HIRLAM/HARMONIE) in Aveiro, Portugal: http://aveirosummerschool2014.web.ua.pt/
2014–2016: Enviro-HIRLAM birch pollen forecasting system (A. Kurganskiy et al.)
Appendix B: Abbreviations and acronyms used in this article
ACT Atmospheric chemical transport
AHF Anthropogenic heat flux
ALADIN Aire Limiteé (pour l’) Adaptation dynamique (par un) Dev´eloppement InterNational (model and consortium)
AOD Aerosol optical depth
AQ Air quality
AQMEII Air Quality Model Evaluation International Initiative
AROME Application of Research to Operations at Mesoscale-model (Météo-France) ARW – the advanced research WRF solver (dynamical core)
BC Black carbon
BEP Building effect parameterisation
CAC Chemistry–aerosol–cloud model (tropospheric box model)
CarboNord Nordic project “Impact of Black Carbon on Air Quality and Climate in Northern Europe and Arctic” CBM-IV The modified implementation of the Carbon Bond Mechanism version IV
CBM-Z CBM-Z extends the CBM-IV to include reactive long-lived species and their intermediates, isoprene chemistry, optional DMS chemistry
CHIMERE A multiscale CTM for air quality forecasting and simulation CISL Cell-integrated semi-Lagrangian (transport scheme) COGCI Copenhagen Global Climate Initiative
CORINE European land-use database
COST European Cooperation in Science and Technology (http://www.cost.eu/) COSMO Consortium for Small-Scale Modelling
COSMO-ART COSMO plus aerosols and reactive trace gases CPU Central processing unit
CRAICC-PEEX CRyosphere-Atmosphere Interactions in a Changing Arctic Climate – Pan-Eurasian EXperiment
CRUCIAL Nordic project “Critical steps in understanding land surface atmosphere interactions: from improved knowledge to socioeconomic solutions
CTM Chemistry-transport model
CWF Chemical weather forecasting DMI Danish Meteorological Institute
DMS Dimethyl sulfide
DEHM Danish Eulerian hemispheric model
ECMWF European Centre for Medium-Range Weather Forecasts EFI European Forest Institute
ECHAM5-HAM Global aerosol–climate model: Global GCM ECHAM (version 5)+aerosol chemistry and microphysics package HAM (MPI for Meteorology, Hamburg)
ENCWF European Network on Chemical Weather Forecasting
Enviro-HIRLAM High Resolution Limited Area Model with chemistry (DMI and collaborators)
EnviroRISKS EU FP6 project: “Environmental Risks: Monitoring, Management and Remediation of Man-made Changes in Siberia”
EPA USA Environmental Protection Agency
ESM Earth system modelling
EuMetChem The COST Action ES1004 – European framework for online integrated air quality and meteorology modelling (eumetchem.info)
ETEX European Tracer Experiment
FAR False alarm ratio
FMI Finnish Meteorological Institute
FP5,6,7 European Union Framework Programmes
FUMAPEX EU FP5 project “Integrated Systems for Forecasting Urban Meteorology, Air Pollution and Population Exposure” GADS Global Aerosol Data Set
GAW Global Atmosphere Watch (WMO programme)
GEOS-Chem GEOS-Chem is a global 3-D chemical transport model (CTM) for atmospheric composition driven by meteoro-logical input from the Goddard Earth Observing System (GEOS) of the NASA Global Modeling and Assimilation Office
GIS Geographical Information System GLCC Global land cover characterisation
HAM Simplified global primary aerosol mechanism model
HARMONIE Hirlam Aladin Research on Meso-scale Operational NWP in Europe (model)